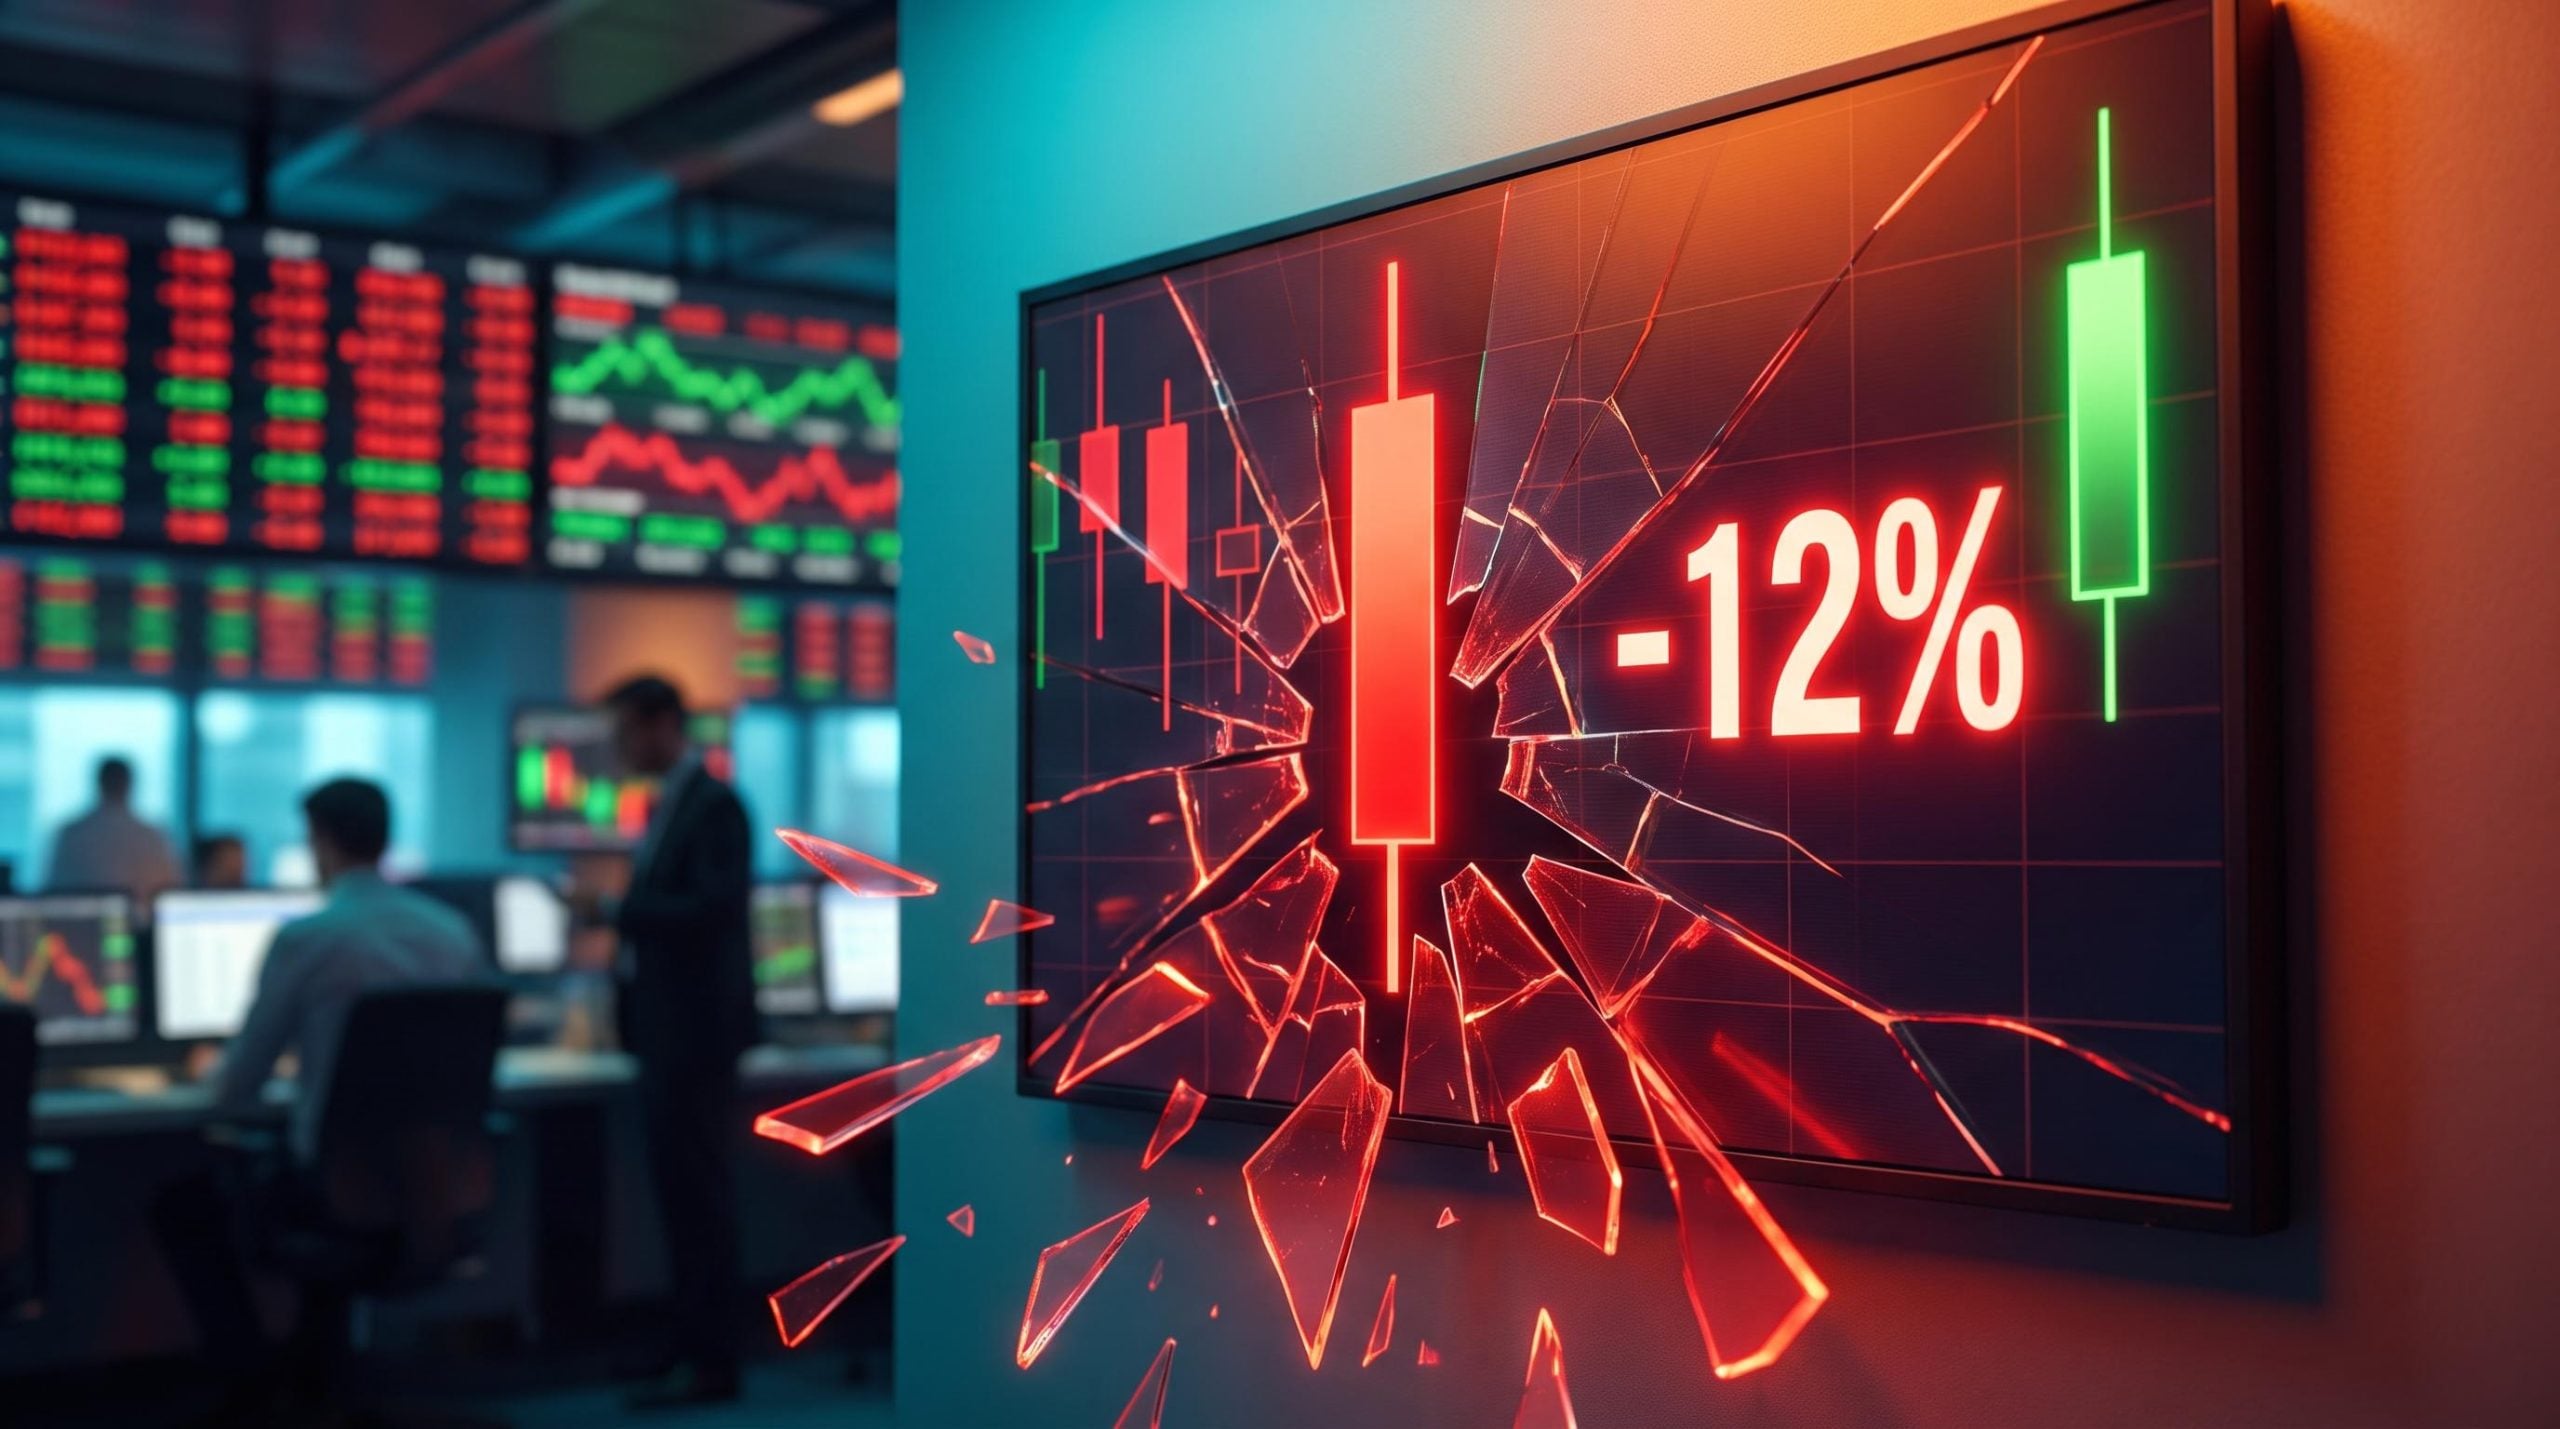
Alphabet shares fell roughly 12-13% on 29 October 2026, erasing about $500 billion in market value at the intraday low in the stock’s largest post-earnings decline on record. Microsoft gave back an overnight surge of around 5% and traded about 1% lower in the regular session.
The damage was uneven. Fortinet and ServiceNow fell by a fifth or more on the same day, while KLA Corporation and Carvana rose. This was not a broad tech selloff.
The market sorted companies by a narrower test, and the companies that failed it were punished hard. Holding a name into results without knowing that test exposes you to gaps that can wipe out months of gains overnight.
Here is what the numbers show about why the market punished some AI spenders and rewarded others, and what today’s post-earnings stock moves reveal about risk.
How big was Alphabet’s drop compared with what options traders expected?
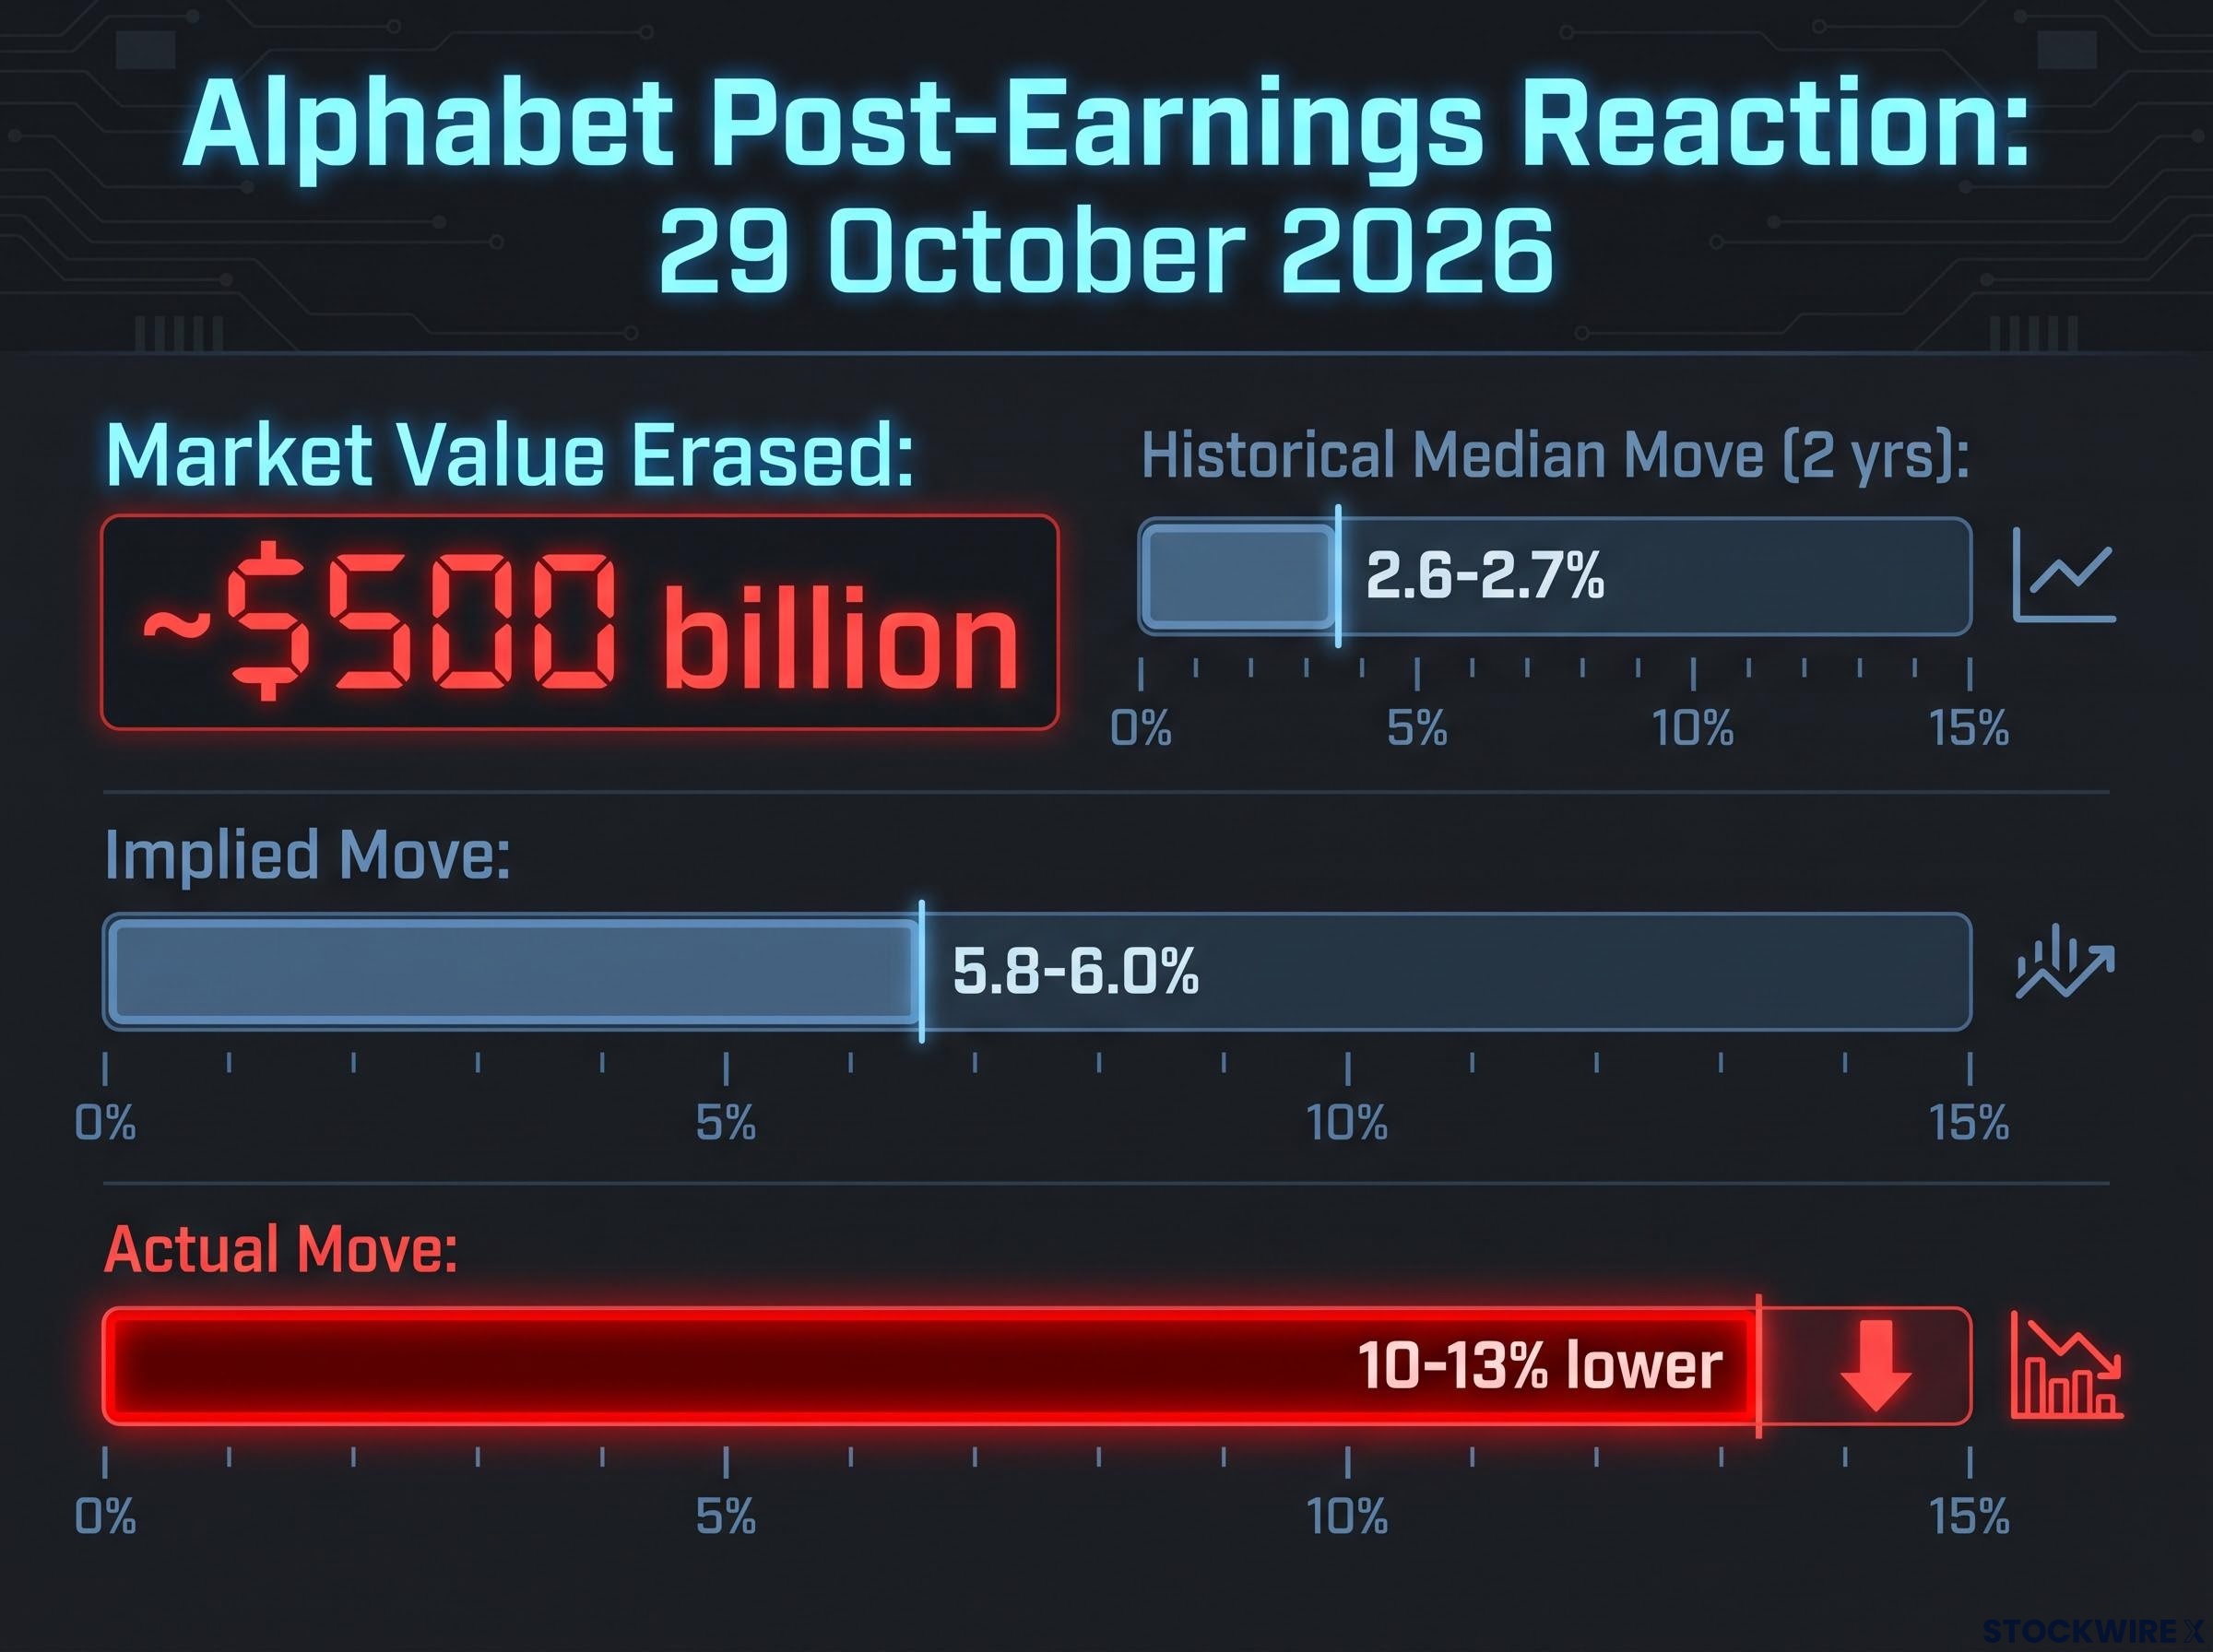
Before the report, the options market priced Alphabet to move about 5.8-6.0% in either direction through Friday’s expiry. The pricing also had to absorb the Federal Reserve decision that week. Over the past two years, Alphabet’s median post-earnings reaction was only about 2.6-2.7%.
The stock fell 10-13%, depending on whether you measure extended-hours or regular-session prices.
Alphabet: priced for a move of about 6%, delivered roughly twice that.
| Company | Implied move | Actual move | Comparison |
|---|---|---|---|
| Alphabet | ~5.8-6.0% | ~10-13% lower | About twice the implied move; several times its typical reaction |
| Microsoft | Under 5% to 5.1% | ~+4-5% overnight, then ~-1% | Close to the priced range at first; the reversal made the day far more volatile |
Microsoft’s first move sat inside its priced range. The swing from up 5% to down 1% within a few hours was the real volatility, and the closing figure hides it.
What a two- to three-standard-deviation move means
An implied move approximates one standard deviation, a statistical range that captures roughly 68% of likely outcomes. A two-standard-deviation move shows up only about 5% of the time in a simple model, so Alphabet’s fall sat deep in the tail.
Option buyers face a second risk called volatility crush. Volatility crush is the sharp fall in option prices after earnings once the uncertainty has passed, and it means you can be right on direction and still lose money. One options-education source suggests capping your maximum loss near 2% of portfolio capital per earnings trade. That is a guideline, not a rule, but this tail event shows why you should size a position to its worst case rather than its average move.
Investors who write predefined trim triggers before results land, such as a specific guidance-cut threshold, remove in-the-moment emotion from the decision and avoid being forced to size a position after the gap has already happened.
When big ASX news breaks, our subscribers know first
Why is AI spending now hitting cash flow instead of just earnings?
On paper, Alphabet had a strong quarter. Cloud sales roughly doubled. The problem sat lower in the accounts.
| Metric | Alphabet actual | Alphabet expected |
|---|---|---|
| Q3 capex | $51.36B | $55.09B |
| Free cash flow | -$9.07B | ~-$2.70B |
| Long-term debt (supporting) | $125.1B | $21.6B a year earlier |
Free cash flow is the cash left after a company pays for operations and investment. Alphabet’s was deeply negative. During the quarter it issued $28.7 billion of senior unsecured debt and raised $12.4 billion through at-the-market stock sales. Management kept 2026 capex guidance at $195-205 billion and warned that 2027 spending would increase “significantly.”
J.P. Morgan Global Research has described a shift from paying for AI infrastructure out of free cash flow toward debt and equity issuance. Alphabet is now the clearest example.
“Absolutely no patience right now for higher capex,” said John Belton, portfolio manager at Gabelli Funds, speaking to the Los Angeles Times.
Microsoft told a different cash story:
- Revenue of $92.3 billion, up 19%
- Azure growth of about 48%
- Capex and finance leases of $45.2 billion, below the roughly $50.67 billion estimate
- Free cash flow down 27% to $18.63 billion, but still positive
Supporters argue this is an investment phase, and demand is clearly real. The open questions are return on invested capital, timing and how long the returns last. Alphabet had been sliding since its May 2026 peak, leaving its one-year return roughly flat. For you, the signal is that the market now prices how credible each company’s future cash flow looks, so free cash flow and funding mix matter as much as cloud growth.
The Big Tech earnings split reflected cash flow rather than cloud demand: Alphabet’s cloud growth was outpaced in the market’s eyes by negative free cash flow, while Microsoft’s below-estimate capex earned it credit for spending discipline.
Why did Fortinet and ServiceNow fall hard on beats and raises while KLA and Carvana rose?
A beat usually means a rally. On Thursday, it often did not.
The decliners
Fortinet earned $0.91 a share against $0.85 expected, on revenue of $2.08 billion against $2.06 billion. Billings rose 29% to $2.34 billion. The stock still fell about 20%, after a premarket drop reported above 25%, because the company cut its service-revenue forecast to $5.15-5.17 billion from $5.18-5.22 billion and revenue growth slowed to 20% from 26%.
ServiceNow dropped about 24-25%. Revenue of $4.106 billion edged past the $4.095 billion consensus and current remaining performance obligations, contracted revenue due within a year, rose 20.5% to $13.65 billion. EPS of $1.00 missed the $1.02 estimate, however, and fears that generative AI could disrupt enterprise software overwhelmed a lifted $1.7 billion AI annual-contract-value target.
Fortinet and ServiceNow illustrate the expectations gap: share prices respond to the distance between results and prior forecasts, and a guidance cut can override a substantial EPS beat.
The risers
KLA paired a beat ($1.22 EPS against $1.18; $4.14 billion revenue against $4.04 billion) with stronger guidance of about $4.7 billion revenue and $1.44 adjusted EPS. Management projected the wafer-fabrication equipment market could exceed $200 billion in 2027. Shares were up roughly 3-4% early, with some reports citing more than 7%.
Carvana rose about 14-16% despite missing on EPS. Revenue jumped 42% to $8.04 billion, with a record 217,385 retail units and record $800 million adjusted EBITDA (earnings before interest, tax, depreciation and amortisation). The stock had spent weeks forming a bearish diamond pattern and rallied anyway.
| Company | Move | What beat | What disappointed |
|---|---|---|---|
| Fortinet | ~-20% | EPS, revenue, billings | Service-revenue forecast cut, slowing growth |
| ServiceNow | ~-24-25% | Revenue, current RPO | EPS miss, bookings outlook, AI disruption fears |
| KLA | ~+3-4% | EPS, revenue, guidance | None flagged |
| Carvana | ~+14-16% | Revenue, units, EBITDA, guidance | EPS miss |
The Los Angeles Times reported the Bloomberg Magnificent Seven Index up only 6.5% in 2026, against 11% for the S&P 500 and 15% for the Nasdaq 100. You should read Thursday as evidence that the market scores next quarter’s outlook above this quarter’s beat, so holding into results carries gap risk even when the numbers look good.
What do chart patterns like bearish engulfing and diamond tops actually tell you after earnings?
Two chart patterns framed much of the commentary. Neither holds up well when an earnings gap gets involved.
A bearish engulfing pattern forms when a large down candle fully covers the body of the previous up candle, suggesting sellers have overpowered buyers. Microsoft’s overnight rally and reversal may qualify. A diamond top is a price range that widens and then narrows after an uptrend, and it turns bearish only on a break below its lower support line.
Confirmation criteria for each:
- Bearish engulfing: heavy volume, a break of nearby support, and follow-through in the next session
- Diamond top: a decisive break below lower-right support, ideally on rising volume
Historical success rates for diamonds vary widely between sources, and no single figure is dependable. Earnings gaps also distort candle shapes, because overnight prices do not form through continuous trading. A quick Microsoft recovery would turn the engulfing read into a failed signal, and Carvana’s diamond has already failed once a fundamental catalyst arrived.
Patterns are conditional signals, not forecasts.
For you, wait for confirmation and weigh the earnings data before acting on any chart pattern.
What the shockwaves change, and what they do not
The market did not reject technology. It repriced AI investment quality, rewarding visible demand and near-term cash generation while punishing debt-funded spending with uncertain returns.
The shift fits a wider turn in AI capex sentiment, where companies now need a credible roadmap for when infrastructure spending converts to positive free cash flow, or face a valuation discount regardless of headline results.
A stock-picker’s market is not a safe one. A handful of megacaps still carry heavy index weight, so broad funds remain exposed if several de-rate together.
Three variables deserve your attention from here:
- Free cash flow trends at each AI spender
- 2027 capex guidance as it firms up
- Whether Microsoft’s engulfing signal is confirmed or fails
Past performance does not guarantee future results. Financial projections are subject to market conditions and various risk factors.
This article is for informational purposes only and should not be considered financial advice. Investors should conduct their own research and consult with financial professionals before making investment decisions.