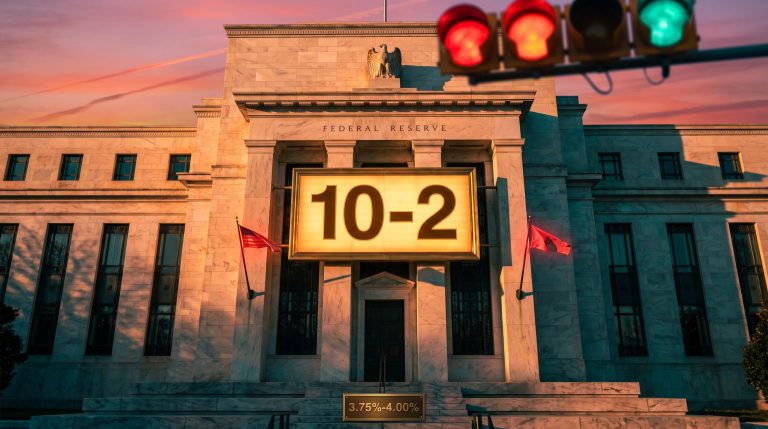
Gold fell more than 1% on Thursday 29 October to roughly $4,019-$4,026 an ounce. US growth and inflation data came in above forecasts and pushed up the odds of a December Federal Reserve rate hike. For anyone tracking the gold price forecast, the $4,000 line is now the level that matters.
The Fed’s decision to hold rates on Wednesday gave bullion no lift. The coming week also packs the US midterm elections and October payrolls into a few days.
The two price prints reflect different publication times rather than an official close. Kitco put spot gold at $4,026.20, down $40.40, while FXStreet reported a print near $4,019.
Here is why gold is behaving this way, and which levels and data points are most likely to decide its next move.
Why did gold fall when the Fed held rates?
A Fed pause usually helps gold. That only holds if traders read the pause as the end of tightening, and this one was not read that way.
Gold’s reaction to the data
Gold briefly climbed to $4,035 before the 29 October releases, after touching a day high near $4,069. When the numbers arrived, it reversed and broke below Wednesday’s low of $4,025.
| Indicator | Latest | Forecast or prior |
|---|---|---|
| Real GDP, Q3 2026 | 3.4% | 3.2% expected; 2.2% prior quarter |
| Core PCE, Q3 annualised | 2.5% | 2.4% expected |
| Core PCE, September y/y | 3.1% | In line with forecasts |
| Initial jobless claims | 194,000 | 199,000 expected; 195,000 prior |
The two inflation figures measure different things. Core personal consumption expenditures (PCE) is the Fed’s preferred inflation gauge, excluding food and energy. The 2.5% figure is the quarter’s annualised pace, while 3.1% compares September with a year earlier.
Growth beat, inflation ran hot and layoffs stayed low. All three point towards a hike rather than a cut.
What the Fed did and did not signal
The Federal Open Market Committee (FOMC) held its target range at 3.75%-4.00% by a 10-2 vote. Governor Lisa Cook and Cleveland Fed President Beth Hammack dissented in favour of a 25bp hike. The statement said “inflation remains elevated” and that more information would guide policy.
The Federal Reserve statement recorded the 10-2 vote to hold the target range at 3.75%-4.00%, with Lisa Cook and Beth Hammack preferring a 25bp hike, and kept the ‘inflation remains elevated’ wording that tempered any dovish reading.
Fed Chair Kevin Warsh said the Fed was not on a predetermined course but would deliver price stability “no ifs, ands or buts.”
The dollar index slipped 0.18% to 101.96 and the 10-year Treasury yield held flat at 4.999%, yet hike pricing stayed high. Reuters put December odds near 90%, while Prime Terminal showed 84% easing to 81%. These figures come from different sources taken at different times, and neither is wrong.
A hold with hawkish dissents and no guidance means rate-cut hopes are not driving the metal. You should treat any bounce as fragile until those hike odds actually fall before the 8-9 December meeting.
How do rates, the dollar and risk appetite move gold?
To a newcomer, the screen looks backwards. The economic data came in stronger, and gold went down.
Gold pays no interest, so the real yields that matter are nominal Treasury returns minus inflation expectations, which is why a hot inflation print can weigh on bullion even when the headline rate is unchanged.
Three mechanisms explain it:
- Rates and real yields: gold pays no interest, so higher rates and real yields (bond returns after inflation, near 1.6% on the US 10-year according to Equiti) make holding it more costly.
- The dollar: a stronger dollar makes gold dearer for non-US buyers, which usually weighs on demand.
- Risk sentiment: fear lifts safe-haven demand, but easing Middle East tensions and lower oil did not help gold this time because rate expectations dominated.
Why the old playbook is looser
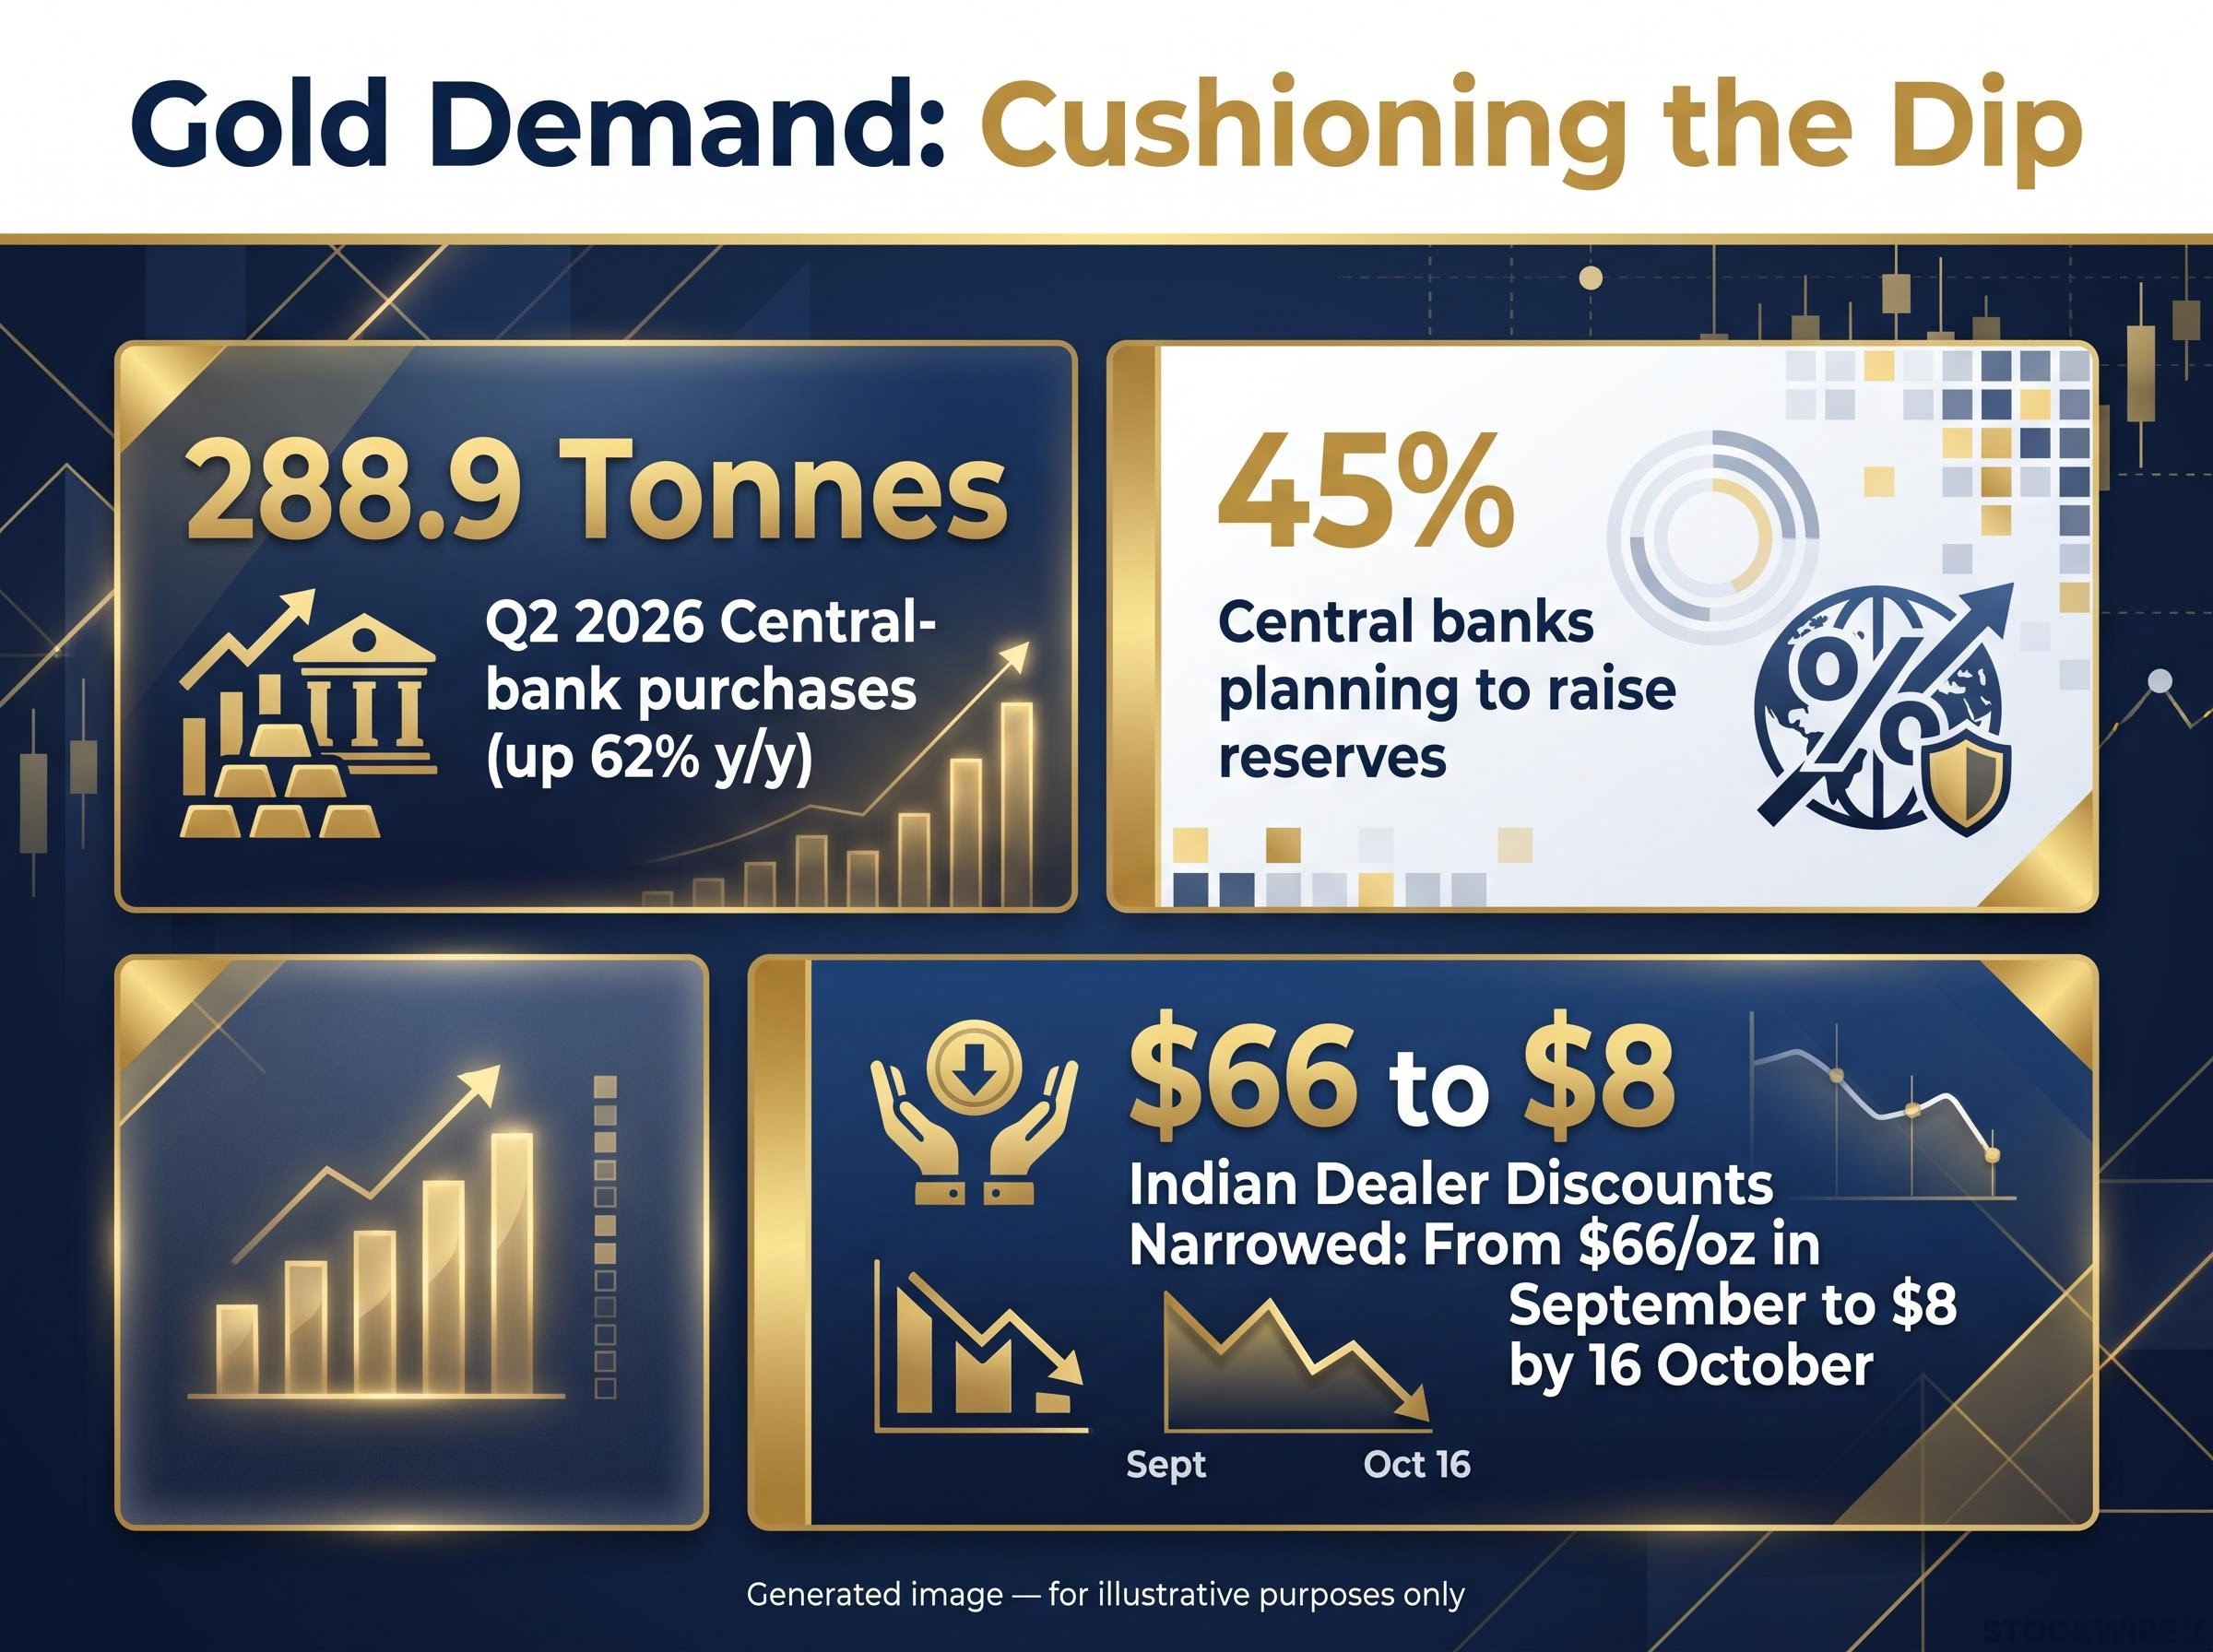
Central banks now buy gold to diversify reserves and to protect against sanctions, not to trade rates. The World Gold Council (WGC) reported 288.9 tonnes of central-bank purchases in Q2 2026, up 62% year on year. In the WGC’s survey, 45% of central banks planned to raise their reserves.
Physical demand is firming too. Indian dealer discounts narrowed from an average of $66/oz in September to $8 by 16 October. Standard Chartered’s Suki Cooper expects gold to consolidate and then recover.
Reuters poll of 30 analysts: the 2026 median forecast was cut to $4,495 from $4,509, with about $4,650 expected for 2027.
The forecasters trimmed their numbers despite that buying. Official demand can cushion a dip, but you should not assume it caps a fall driven by rising real yields.
Which levels and data will decide the next gold price forecast?
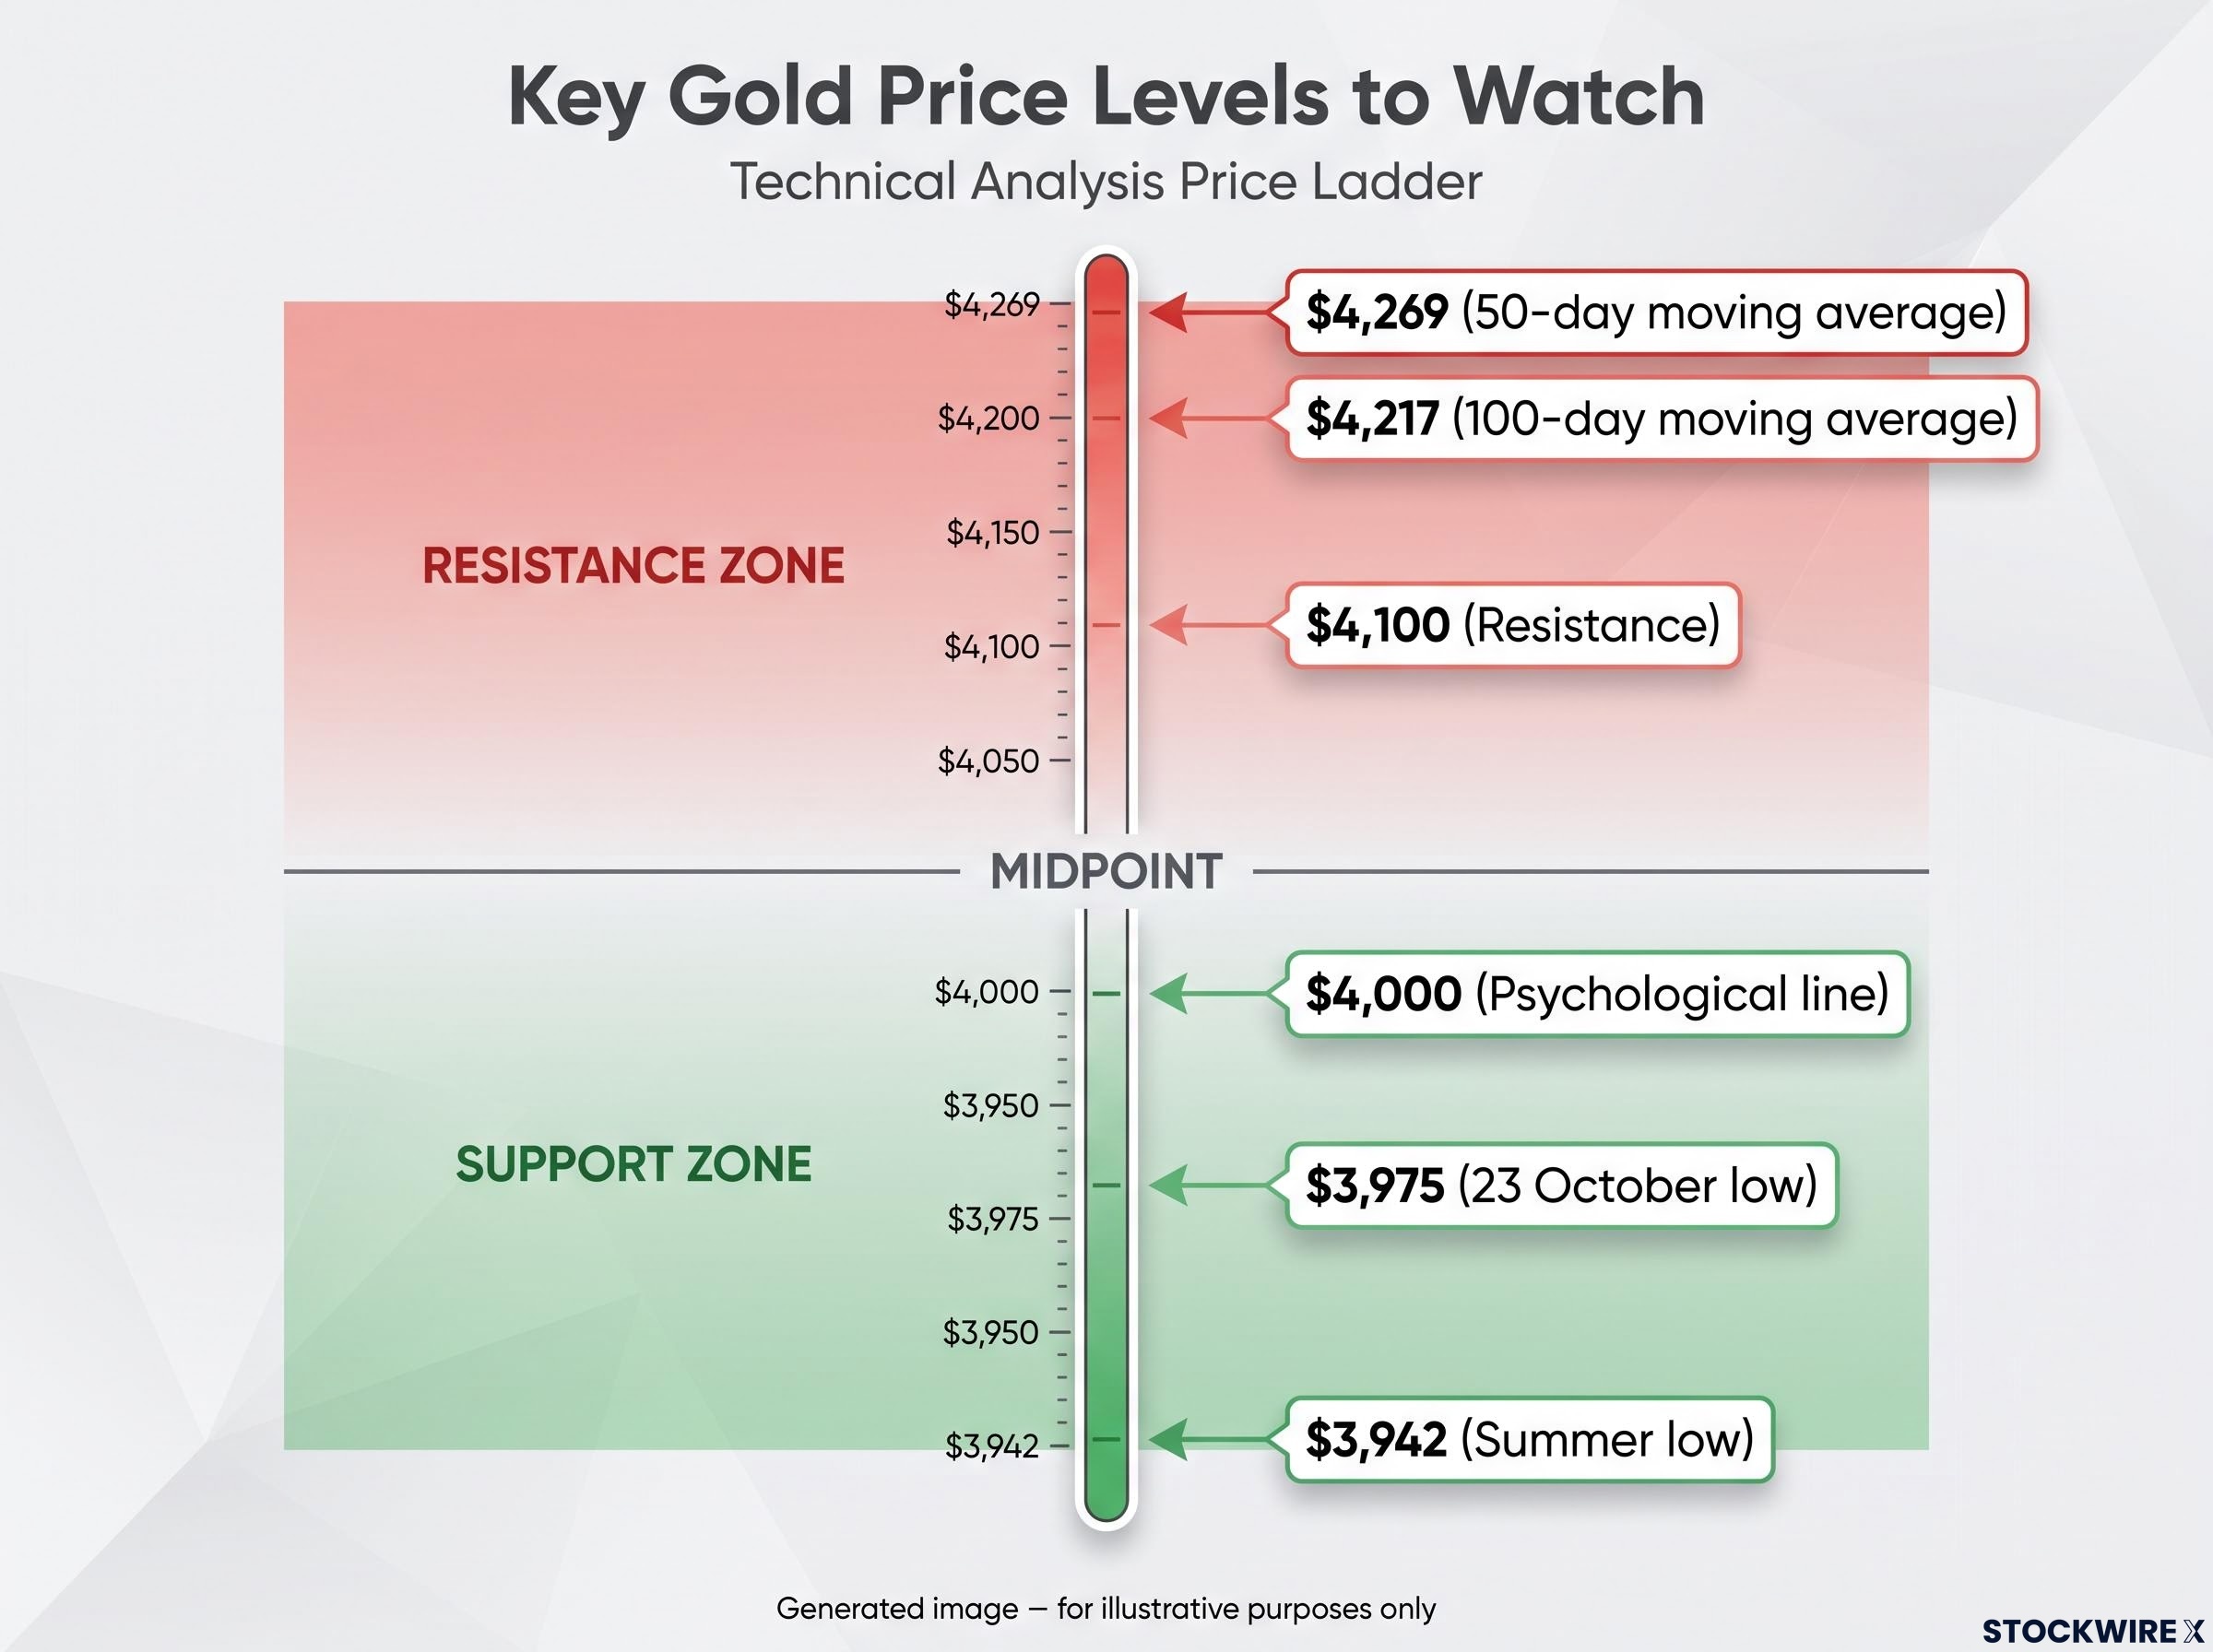
The levels traders are watching
| Level | Type | Why it matters |
|---|---|---|
| $4,269 | Resistance | 50-day moving average |
| $4,140-$4,227 | Resistance | Includes the 100-day moving average at $4,217 |
| $4,100 | Resistance | A clear break would weaken the bearish setup |
| $4,000 | Support | Psychological line |
| $3,975 | Support | Three-month low of $3,975.23 on 23 October (Reuters) |
| $3,940/$3,930 | Support | Summer low near $3,942 (Equiti) |
FXStreet places the year-to-date low below $3,970, which conflicts with the Reuters figure. Its technical read has sellers in control, with the relative strength index (a momentum gauge) sliding towards oversold. Reclaiming $4,100 would undercut that read.
Han Tan of Bybit had warned that a hotter PCE could push gold below $4,000. Equiti sees room towards $3,500 if the summer low breaks while the dollar and yields keep rising.
The week ahead
- 2 November: ISM Manufacturing
- 3 November: JOLTS, factory orders and the US midterm elections
- 4 November: ADP and ISM Services
- 5 November: Initial jobless claims
- 6 November: October payrolls at 8:30 a.m. ET, with consensus about +40,000 against a prior +29,000
Consensus figures for the other releases were not available.
Two scenarios
In the hawkish case, strong payrolls, jobless claims below 200,000 and a firmer dollar threaten $4,000 and then $3,975. In the dovish case, weak payrolls and softer inflation could support a rebound towards $4,100. Early October showed how this works: softer jobs data cut October hike odds from 64% to 22% and gave gold support.
Swings in hike odds can be sharp, as early October showed when a single data release or Fed speech moved futures pricing by tens of percentage points within days.
A daily close below $4,000 is the signal that matters, not a brief intraday dip. Watch payrolls against the +40,000 consensus as the likeliest trigger for a break in either direction.
What the drop changes, and what it does not
The near-term bias has shifted to bearish-to-neutral, not structurally bearish. The next move depends on payrolls, December hike pricing, the dollar, real yields and the midterms.
A sustained break under $4,000 opens $3,975 and then $3,940/$3,930. Softer data combined with steady official buying favours $4,100 and then $4,200.
Beyond next week, the 8-9 December FOMC meeting is the bigger test. It will decide whether today’s hike pricing becomes policy.
This article is for informational purposes only and should not be considered financial advice. Investors should conduct their own research and consult with financial professionals before making investment decisions. Past performance does not guarantee future results, and forecasts are subject to market conditions and various risk factors.