The VIX closed near 20 last week, a reading that usually signals a nervous market. Yet the S&P 500 had barely been moving: its 20-day realised volatility sat close to 10%. You were being asked to pay roughly double for options compared with what the index had actually delivered. Implied volatility skew and the gap behind it explain why that calm may not be what it looks like.
The week ending 23 October 2026 brought a sharp Treasury rally tied to French bond stress, uneasy sentiment around the big AI spenders, and a calendar that still has the Federal Open Market Committee (FOMC) decision on 27-28 October and major tech earnings ahead.
The useful question right now is not which way the market breaks. It is what the price of insurance is telling you.
Here is a working method for judging whether options look rich or cheap, using IV rank and skew together. This is an educational framework, not trade advice.
What does a nine-point gap between implied and realized volatility actually tell you?
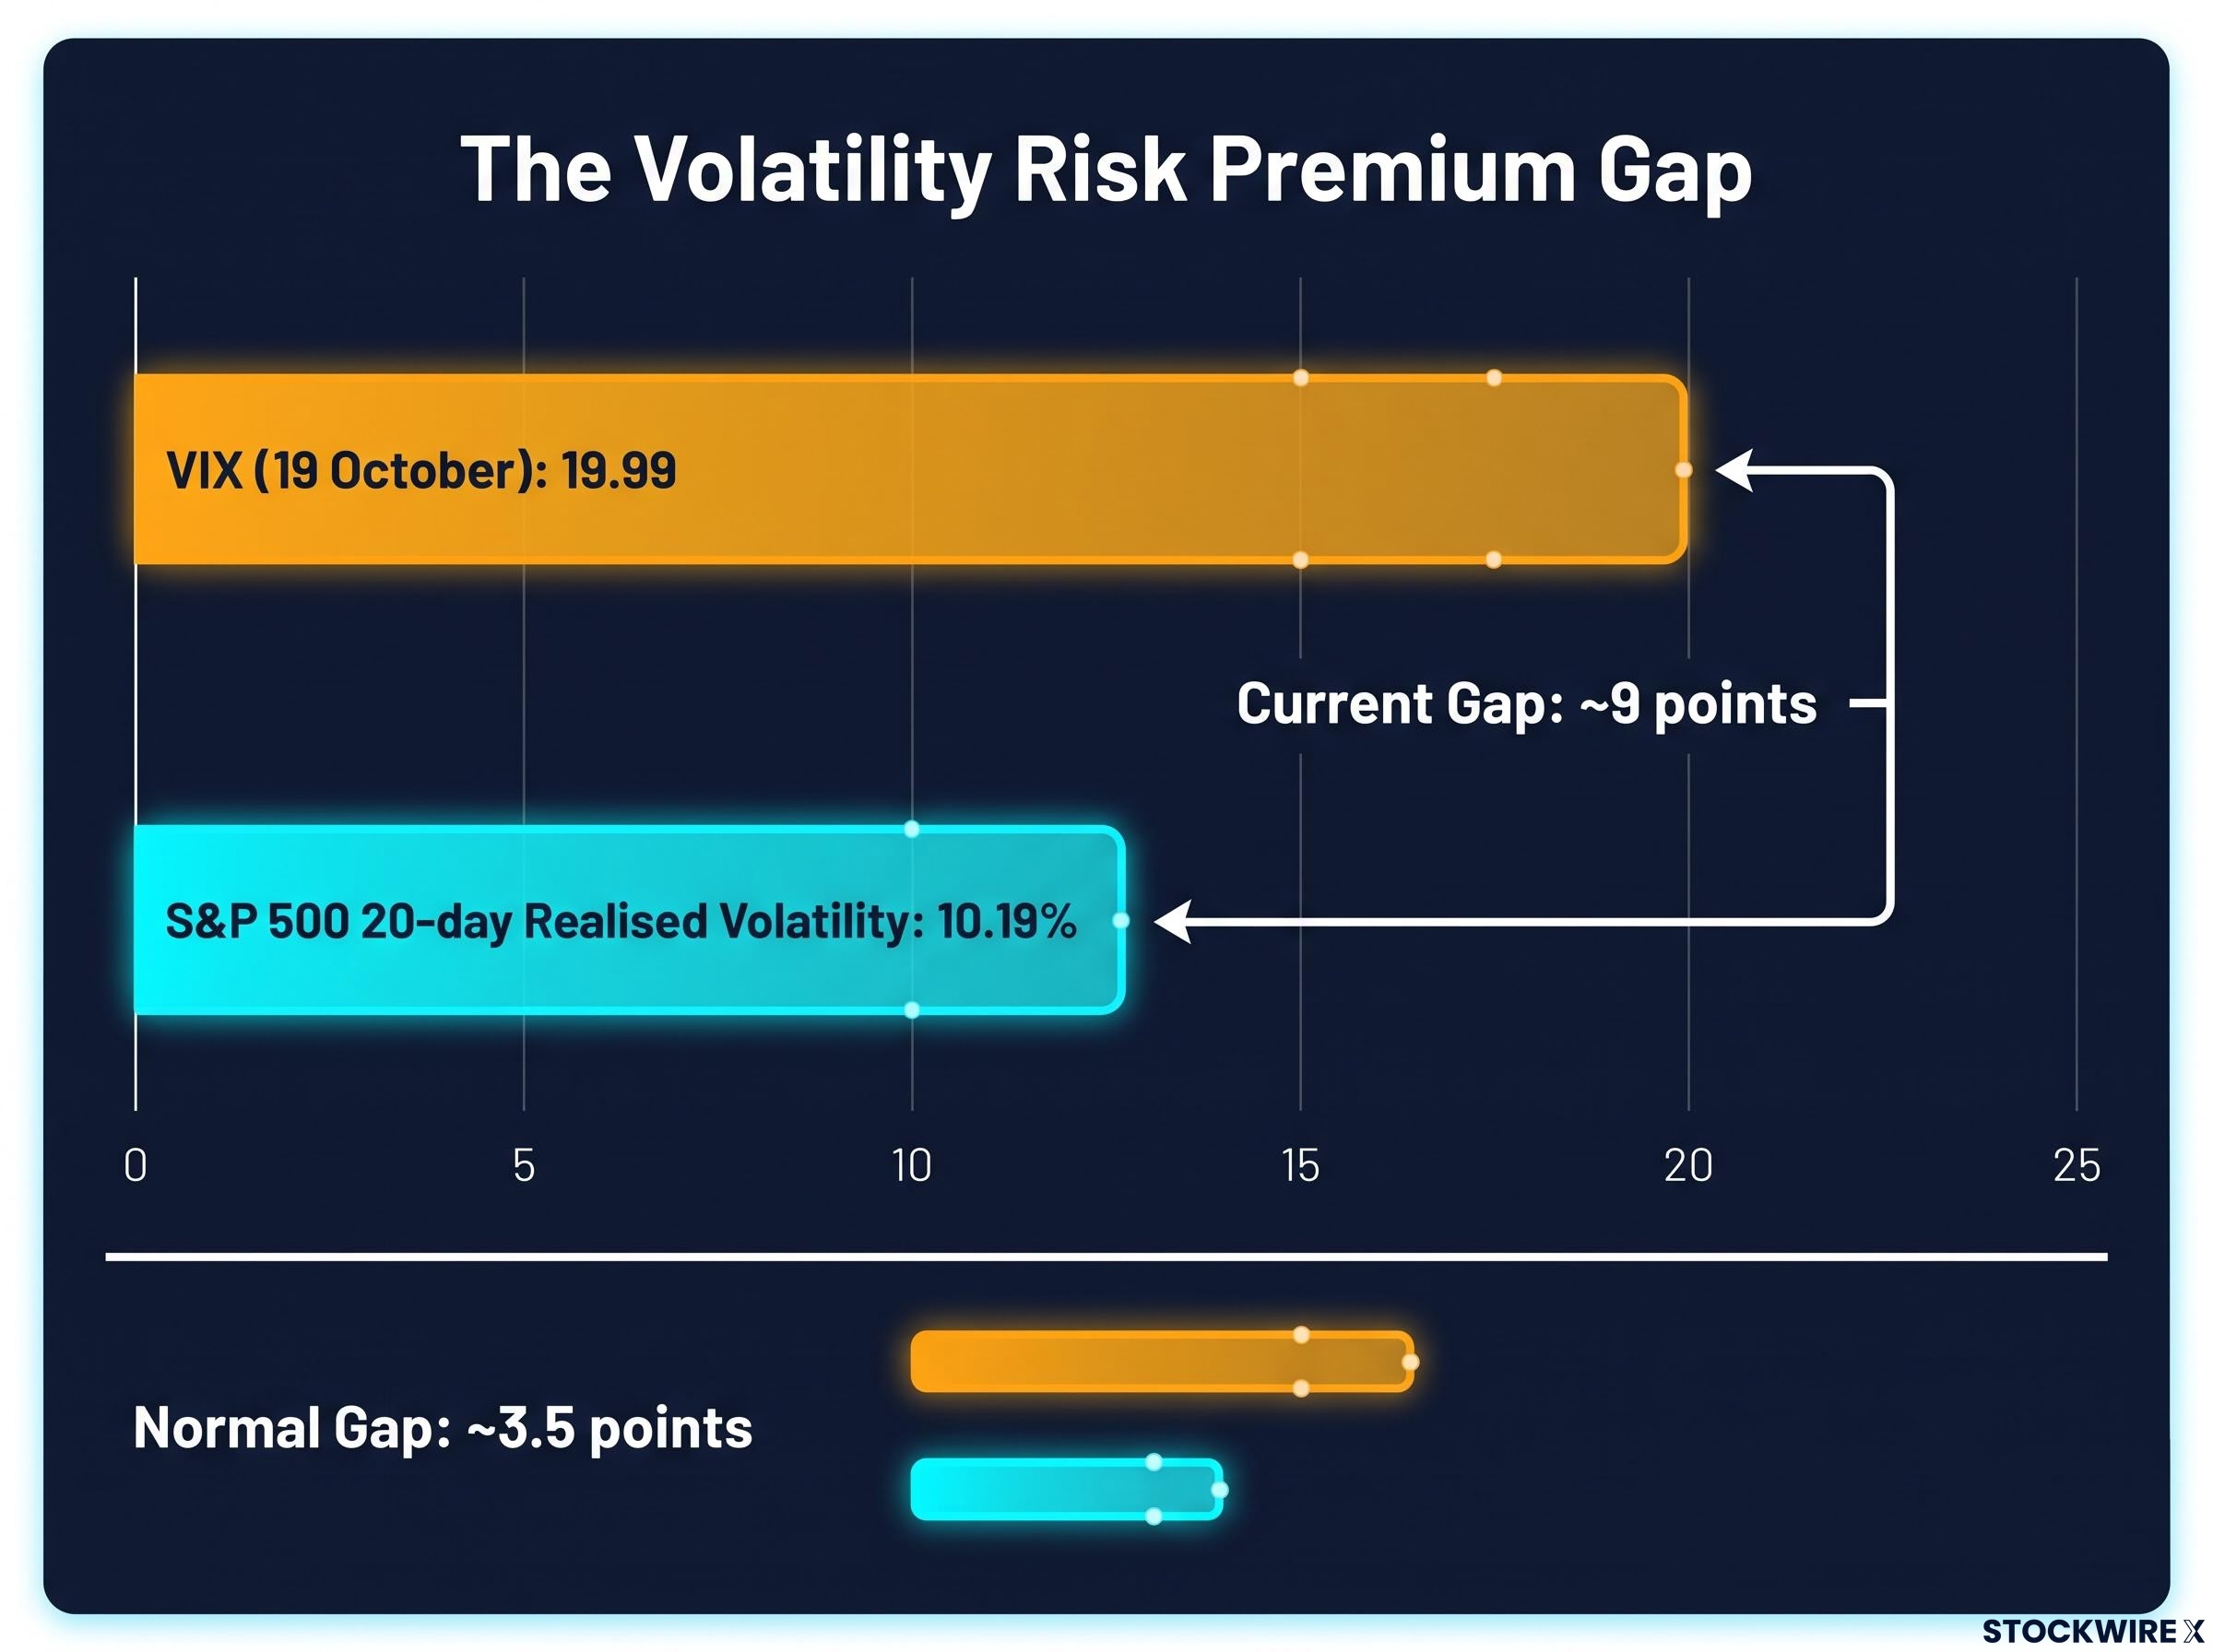
Nine points. That is how far the VIX stood above one-month realised S&P 500 volatility late last week, according to SpotGamma. The firm puts the normal gap at about 3.5 points.
Some definitions first. Realised volatility measures how much the index has actually moved over a past window. Implied volatility is the level of future movement baked into option prices, so it works as the price you pay for protection.
Because implied volatility is backed out of live option prices rather than past movement, you are reading the market’s collective expectation, and that is why it can sit far above what the index has actually delivered.
The space between them is the volatility risk premium. This is the extra amount option buyers pay above recent movement, compensating sellers for the risk of sudden jumps.
| Reading | Level | Source |
|---|---|---|
| VIX (19 October) | 19.99 | Saxo |
| S&P 500 20-day realised volatility | 10.19% | Saxo |
| Implied minus realised gap | About 9 points vs normal of about 3.5 | SpotGamma |
By 26 October, Saxo reported the VIX at 19.45, the Cboe SKEW index at 151.80 and the VIX futures curve in contango. Cboe said the VIX had climbed about five points week on week, driven mainly by demand for downside convexity. In plain terms, that means investors were buying protection that pays off faster the further the market falls.
The gap in context SpotGamma’s Brent Kachuba read the roughly nine-point spread as traders pricing far more future risk than the market had recently shown.
So what are they insuring against? The list is specific: the FOMC, earnings from Microsoft, Alphabet and Amazon, worries over how AI spending gets financed, and French credit stress.
That tells you the gap measures anxiety about known catalysts. It is not proof that a selloff is coming.
Two outcomes typically follow. If the catalysts pass quietly, implied volatility collapses, a move known as volatility crush. If a jump arrives, realised volatility catches up and options that looked expensive turn out to have been fairly priced or even cheap. The gap can also widen before it closes.
Why realized volatility can look artificially quiet
Part of the calm may come from zero-DTE options, which are contracts that expire the same day they trade. Dealers who sell them hedge throughout the session. Heavy volumes can pin the index near popular strike prices, so small moves get absorbed.
Kachuba cited a UBS paper arguing that zero-DTE flow stabilises the S&P 500, though that paper could not be publicly confirmed. The dampening also only holds within limits. If the index breaks decisively through key strikes, the same hedging flows can amplify the move instead of absorbing it.
When big ASX news breaks, our subscribers know first
How French bond stress pulled Treasury yields lower and what it means for U.S. volatility
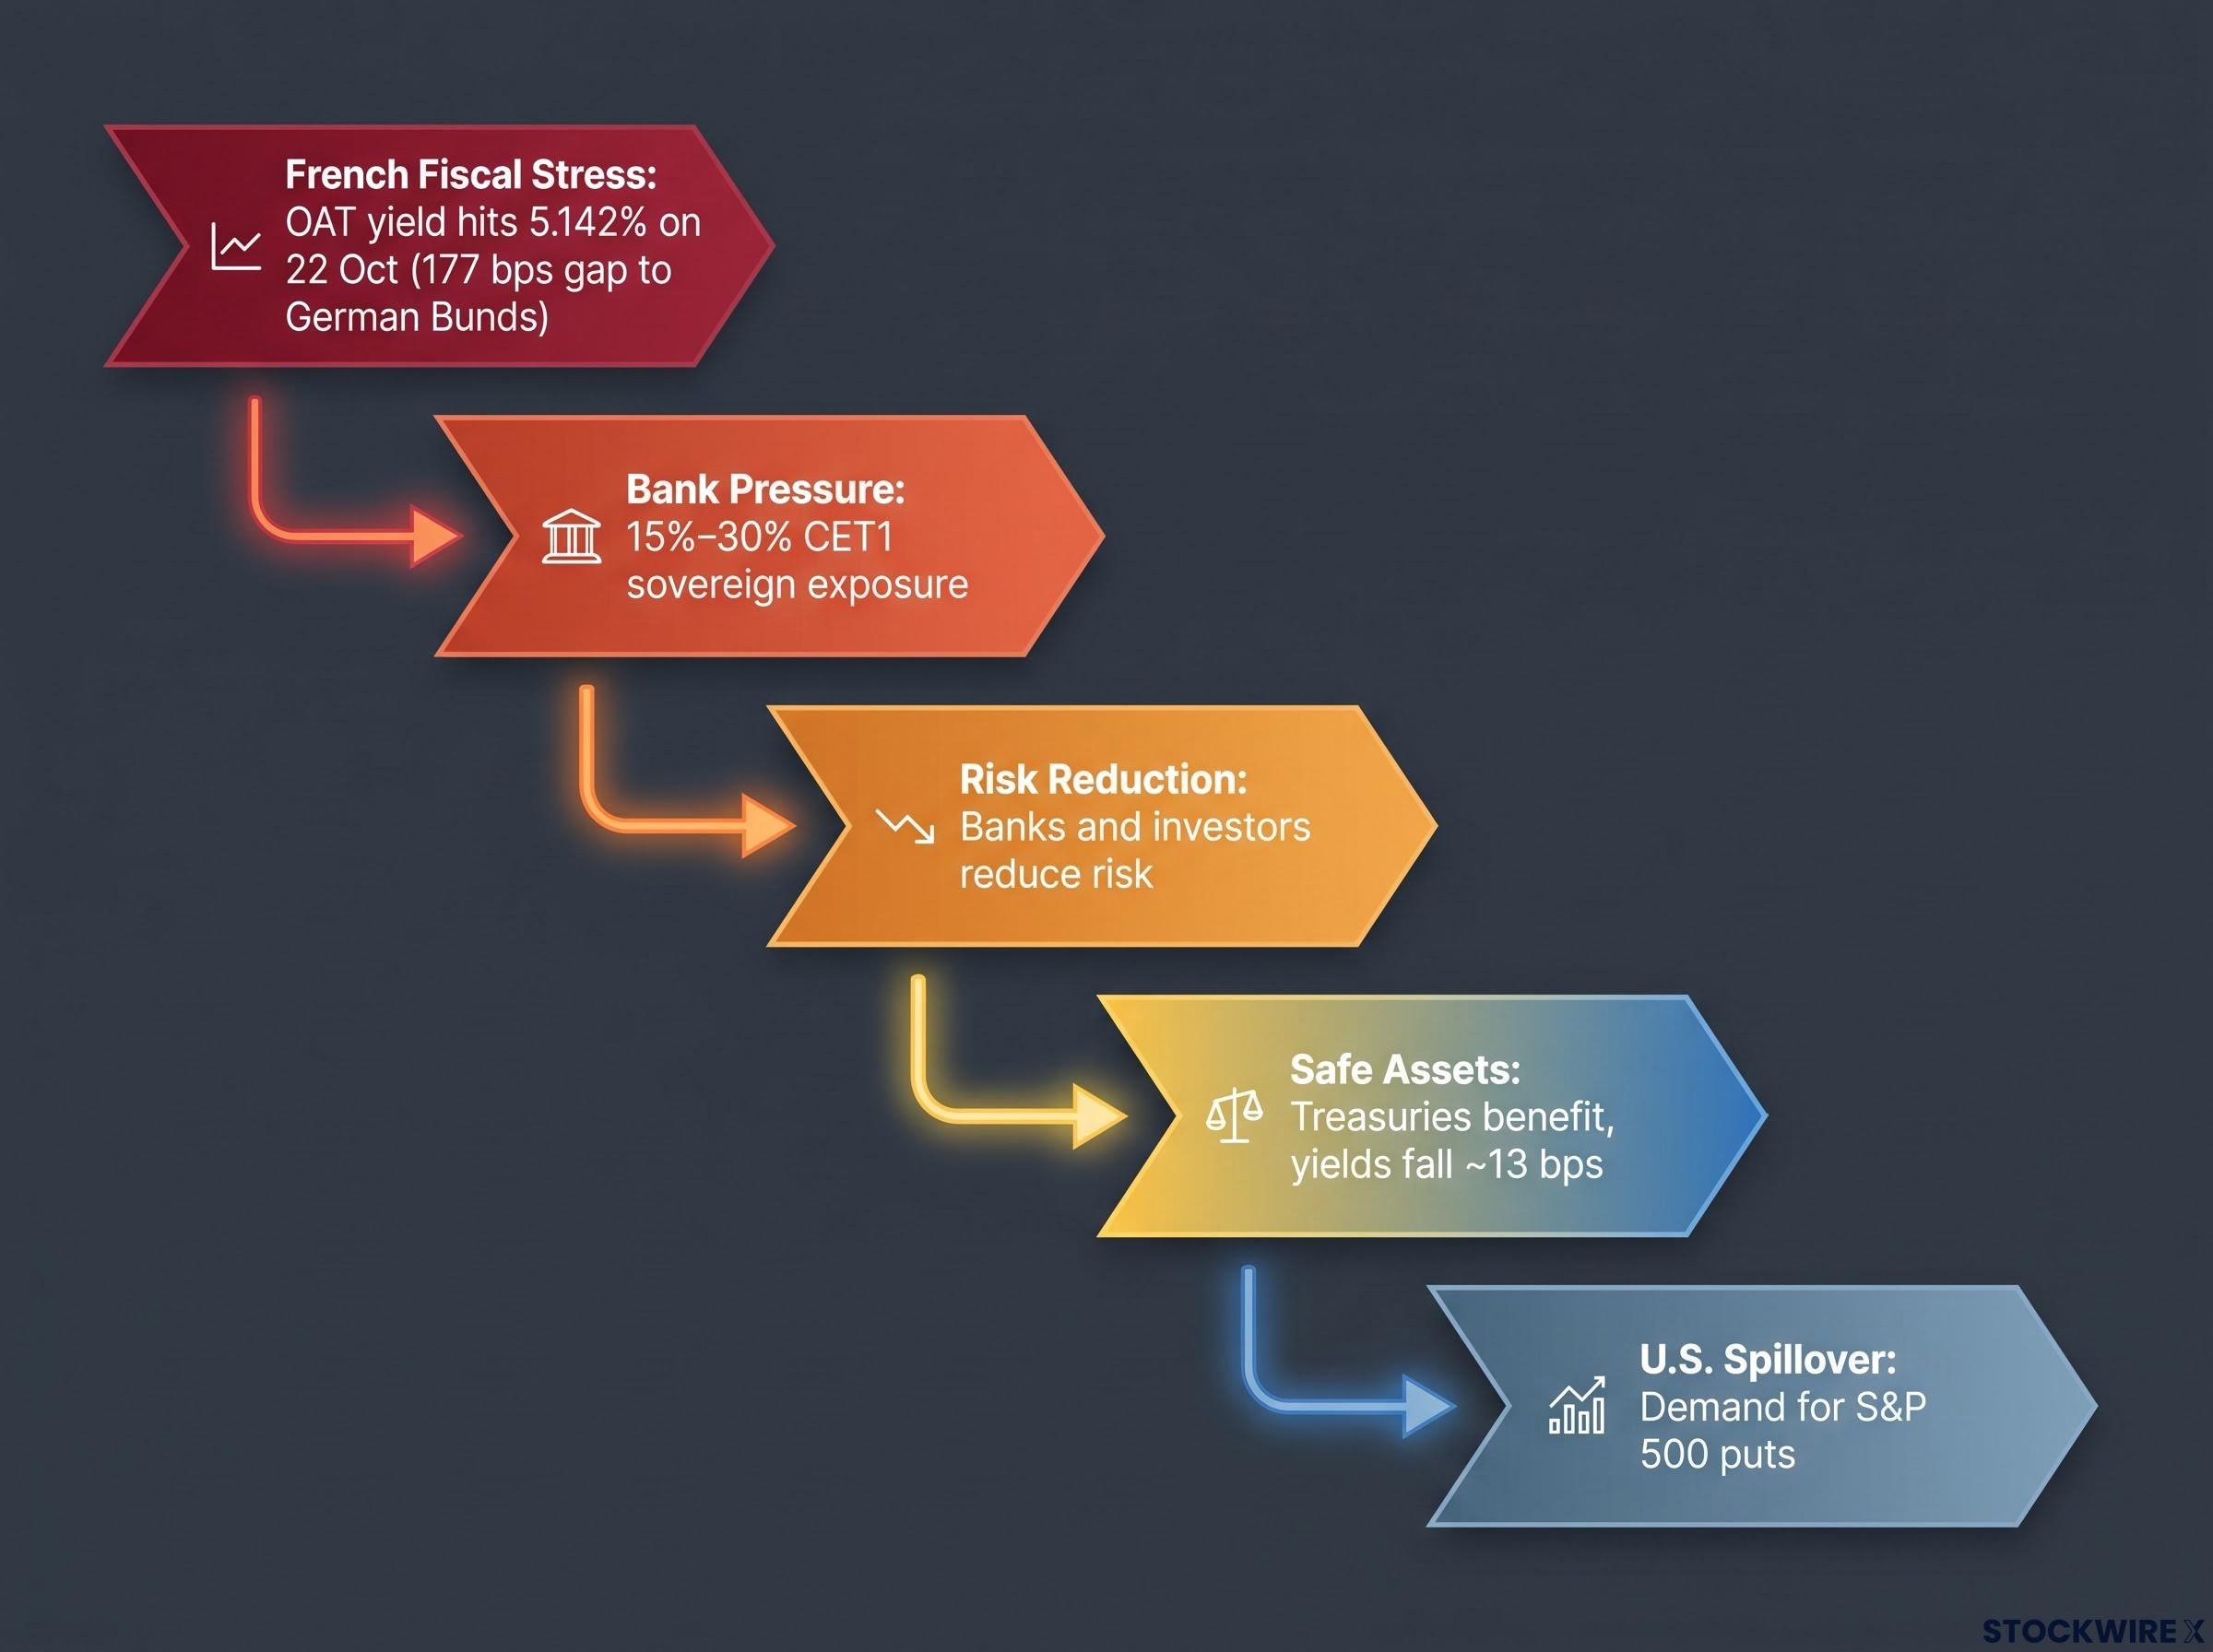
That pinned, quiet surface sits on top of a stress point several thousand kilometres away. Following the chain one link at a time shows how it reaches your U.S. portfolio.
- French fiscal and political stress pushed bond yields up. The French 10-year government bond yield, known as the OAT yield, hit 5.142% on 22 October, its highest since July 2002. The gap to German Bunds widened to 177 basis points, the widest since 2011.
- French banks felt the pressure. Higher yields cut the value of their sovereign bond holdings and raise funding costs. The Asian Banker reported estimates that direct sovereign exposure at large French banks could equal 15%-30% of their core capital (CET1), a figure that has not been independently verified.
- Banks and leveraged investors reduce risk. Wider spreads and costlier refinancing can force selling.
- Money seeks liquid safe assets. U.S. Treasuries benefit, pulling yields lower. The original source described one of the fastest recent one-day falls, roughly 13 basis points.
- Stress can spill into U.S. equities. Tighter global financial conditions can weigh on cyclical stocks and lift demand for S&P 500 puts.
By 23 October, the OAT yield had eased to 5.040% and the spread to 170 basis points, while the U.S. 10-year Treasury settled at 4.985%. Nothing had been resolved. European volatility (the VStoxx index) and European bank put skews had not yet moved sharply.
The daily Treasury par yield curve rates are the official benchmark for the U.S. 10-year yield, so you can check the 4.985% settlement and any rebound described in the safe-haven reading against the published figures.
The AI financing story adds a second layer. Meta raised the low end of its 2026 capex outlook to $135B, and Elon Musk said debt markets had nearly shut out neoclouds (smaller AI cloud providers) lacking revenue beyond data centres.
Three ways to read the Treasury rally
- Safe haven: The drop in yields reflected capital fleeing to safety, not a stronger U.S. economy.
- Growth-disinflation: Lower yields signal weaker global data and expectations of easier policy.
- Fiscal risk: Concern can broaden to government debt everywhere, pushing yields back up. Earlier in October, the U.S. 10-year touched 5.364%.
The same episode can produce lower yields first and higher global yields later. If the safe-haven reading is right, you should be wary of treating the rally in rate-sensitive sectors as a durable signal. And if France stabilises, the original source warns U.S. rates could rebound sharply, running the whole chain in reverse.
How to read IV rank and skew together (the educational core)
Macro stories explain why protection is in demand. Two tools tell you how much you are paying for it and where.
IV rank: cheap or rich versus its own history
IV rank compares an asset’s current implied volatility with its own range, usually over the past year. A reading of 80 means options are pricier than they have been for most of that window. A reading of 20 means they are near the low end.
It has limits. IV rank looks backwards, it can go stale after a lasting shift in volatility, and it never tells you an option is cheap in absolute terms. A low rank only means cheap relative to that asset’s recent past.
Skew: where the fear is concentrated
Implied volatility skew is the difference in implied volatility across strike prices, most often between puts and calls. When puts carry higher implied volatility than calls, demand for downside protection is outrunning demand for upside bets.
Cboe’s data shows how fast this can shift. One-month, 30-delta S&P 500 put skew jumped from the 15th to the 82nd percentile last week, meaning downside protection went from relatively cheap to relatively expensive within days.
| Observation | Usual interpretation |
|---|---|
| Put IV high vs calls, put IV rank high | Downside protection is rich versus the asset’s history |
| Put IV high, put IV rank low | Skew may be normal for that asset; puts not necessarily expensive |
| Both call and put IV ranks high | The whole surface is expensive, often before an event |
| Low IV rank, steep put skew | Options cheap overall, but downside still costs more than upside |
| High VIX, ordinary skew | Volatility broadly expensive, not concentrated in puts |
Kachuba’s rule of thumb is that high IV rank plus high skew suggests mean-reversion fades. Treat that as a heuristic, not a timing rule. He also observes that markets often pause near an IV rank of 50 or a flattened VIX term structure before sharper stress. Term structure adds a time dimension: contango means near-term volatility is priced below longer-dated volatility, while backwardation usually signals immediate stress.
The habit is two questions. Is this option expensive versus its own history, and is that expense concentrated in puts or calls? Together, they tell you what the market is paying for, which matters more than the headline VIX.
Whether the whole surface looks rich or cheap matters most for strategy selection, since elevated implied volatility with high IV rank tends to favour premium sellers while low readings favour buyers, with extra checks needed around liquidity-driven spikes.
Worked examples: what skew and IV rank suggest about TLT, Nasdaq puts and IBIT puts
Apply those two questions to three instruments and you get three different answers. These are observations about what the readings imply, based on approximate figures from the original source, not recommendations.
| Instrument | IV rank reading | Skew reading | What it implies | Key caveat |
|---|---|---|---|---|
| TLT calls | Not specified | Call skew rich, not extreme | Demand for bets on falling U.S. rates | Rates could rebound if France stabilises |
| QQQ puts | About 65 | Notable put skew | Nasdaq protection is pricey | Skew can stay rich or rise further |
| IBIT puts | About 19 | Not specified | Puts screen cheap versus history | Correlation to equities is unstable |
TLT calls
Rich call skew on the long-dated Treasury fund tells you traders are paying up for a further fall in yields. Safe-haven buying can help those calls, but duration, inflation and fiscal shocks can push yields the other way, and a calmer France could trigger the rebound described earlier.
Nasdaq (QQQ) puts
An IV rank near 65 with notable put skew says Nasdaq protection costs more than usual for QQQ itself. The original source also notes Nasdaq volatility rising faster than the S&P’s, so the right comparison is QQQ’s own history, not the S&P 500. Remember that expensive skew can get more expensive in a selloff.
IBIT puts
IBIT, the iShares Bitcoin ETF, shows an IV rank near 19, near the bottom of its range. It closed at $45.96 on 23 October, down from $47.84 on 21 October, after spot-Bitcoin ETFs saw $82.39M of outflows on 16 October, $71.78M of it from IBIT.
Correlation snapshot 247WallSt measured the 21-day correlation between Bitcoin and the Nasdaq-100 at 0.67, against 0.38 over 63 days and 0.44 over 99 days.
Kachuba’s scenario is that a credit crunch could hit Bitcoin harder than equities. That is a scenario, not a forecast, and it rests on a link that has swung widely in a few months. Cheap on IV rank is not the same as a dependable hedge.
Rank and skew also hide real costs: rolling puts, wide bid-ask spreads and time decay can make a hedge expensive even when it works.
What the staging point changes, and what it does not
Elevated implied volatility, a wide gap to realised volatility, steeper put skew and French credit stress all describe a market pricing a jump, not one that has had it. The gap guarantees no direction. Outcomes split between volatility crush and realised volatility catching up.
Three indicators are worth watching:
- The FOMC outcome on 27-28 October
- How markets react to Microsoft, Alphabet and Amazon earnings
- French 10-year yields and the OAT-Bund spread
This article is for informational purposes only and should not be considered financial advice. Investors should conduct their own research and consult with financial professionals before making investment decisions. Past performance does not guarantee future results, and the scenarios discussed are speculative and subject to change.
Whichever way this week breaks, the price of insurance will show you first.