
The consensus and TD Securities agree almost exactly on September inflation: core PCE at 3.1% year on year, headline at 3.6%. Ahead of the PCE release, the September inflation forecast is not where the real argument lies.
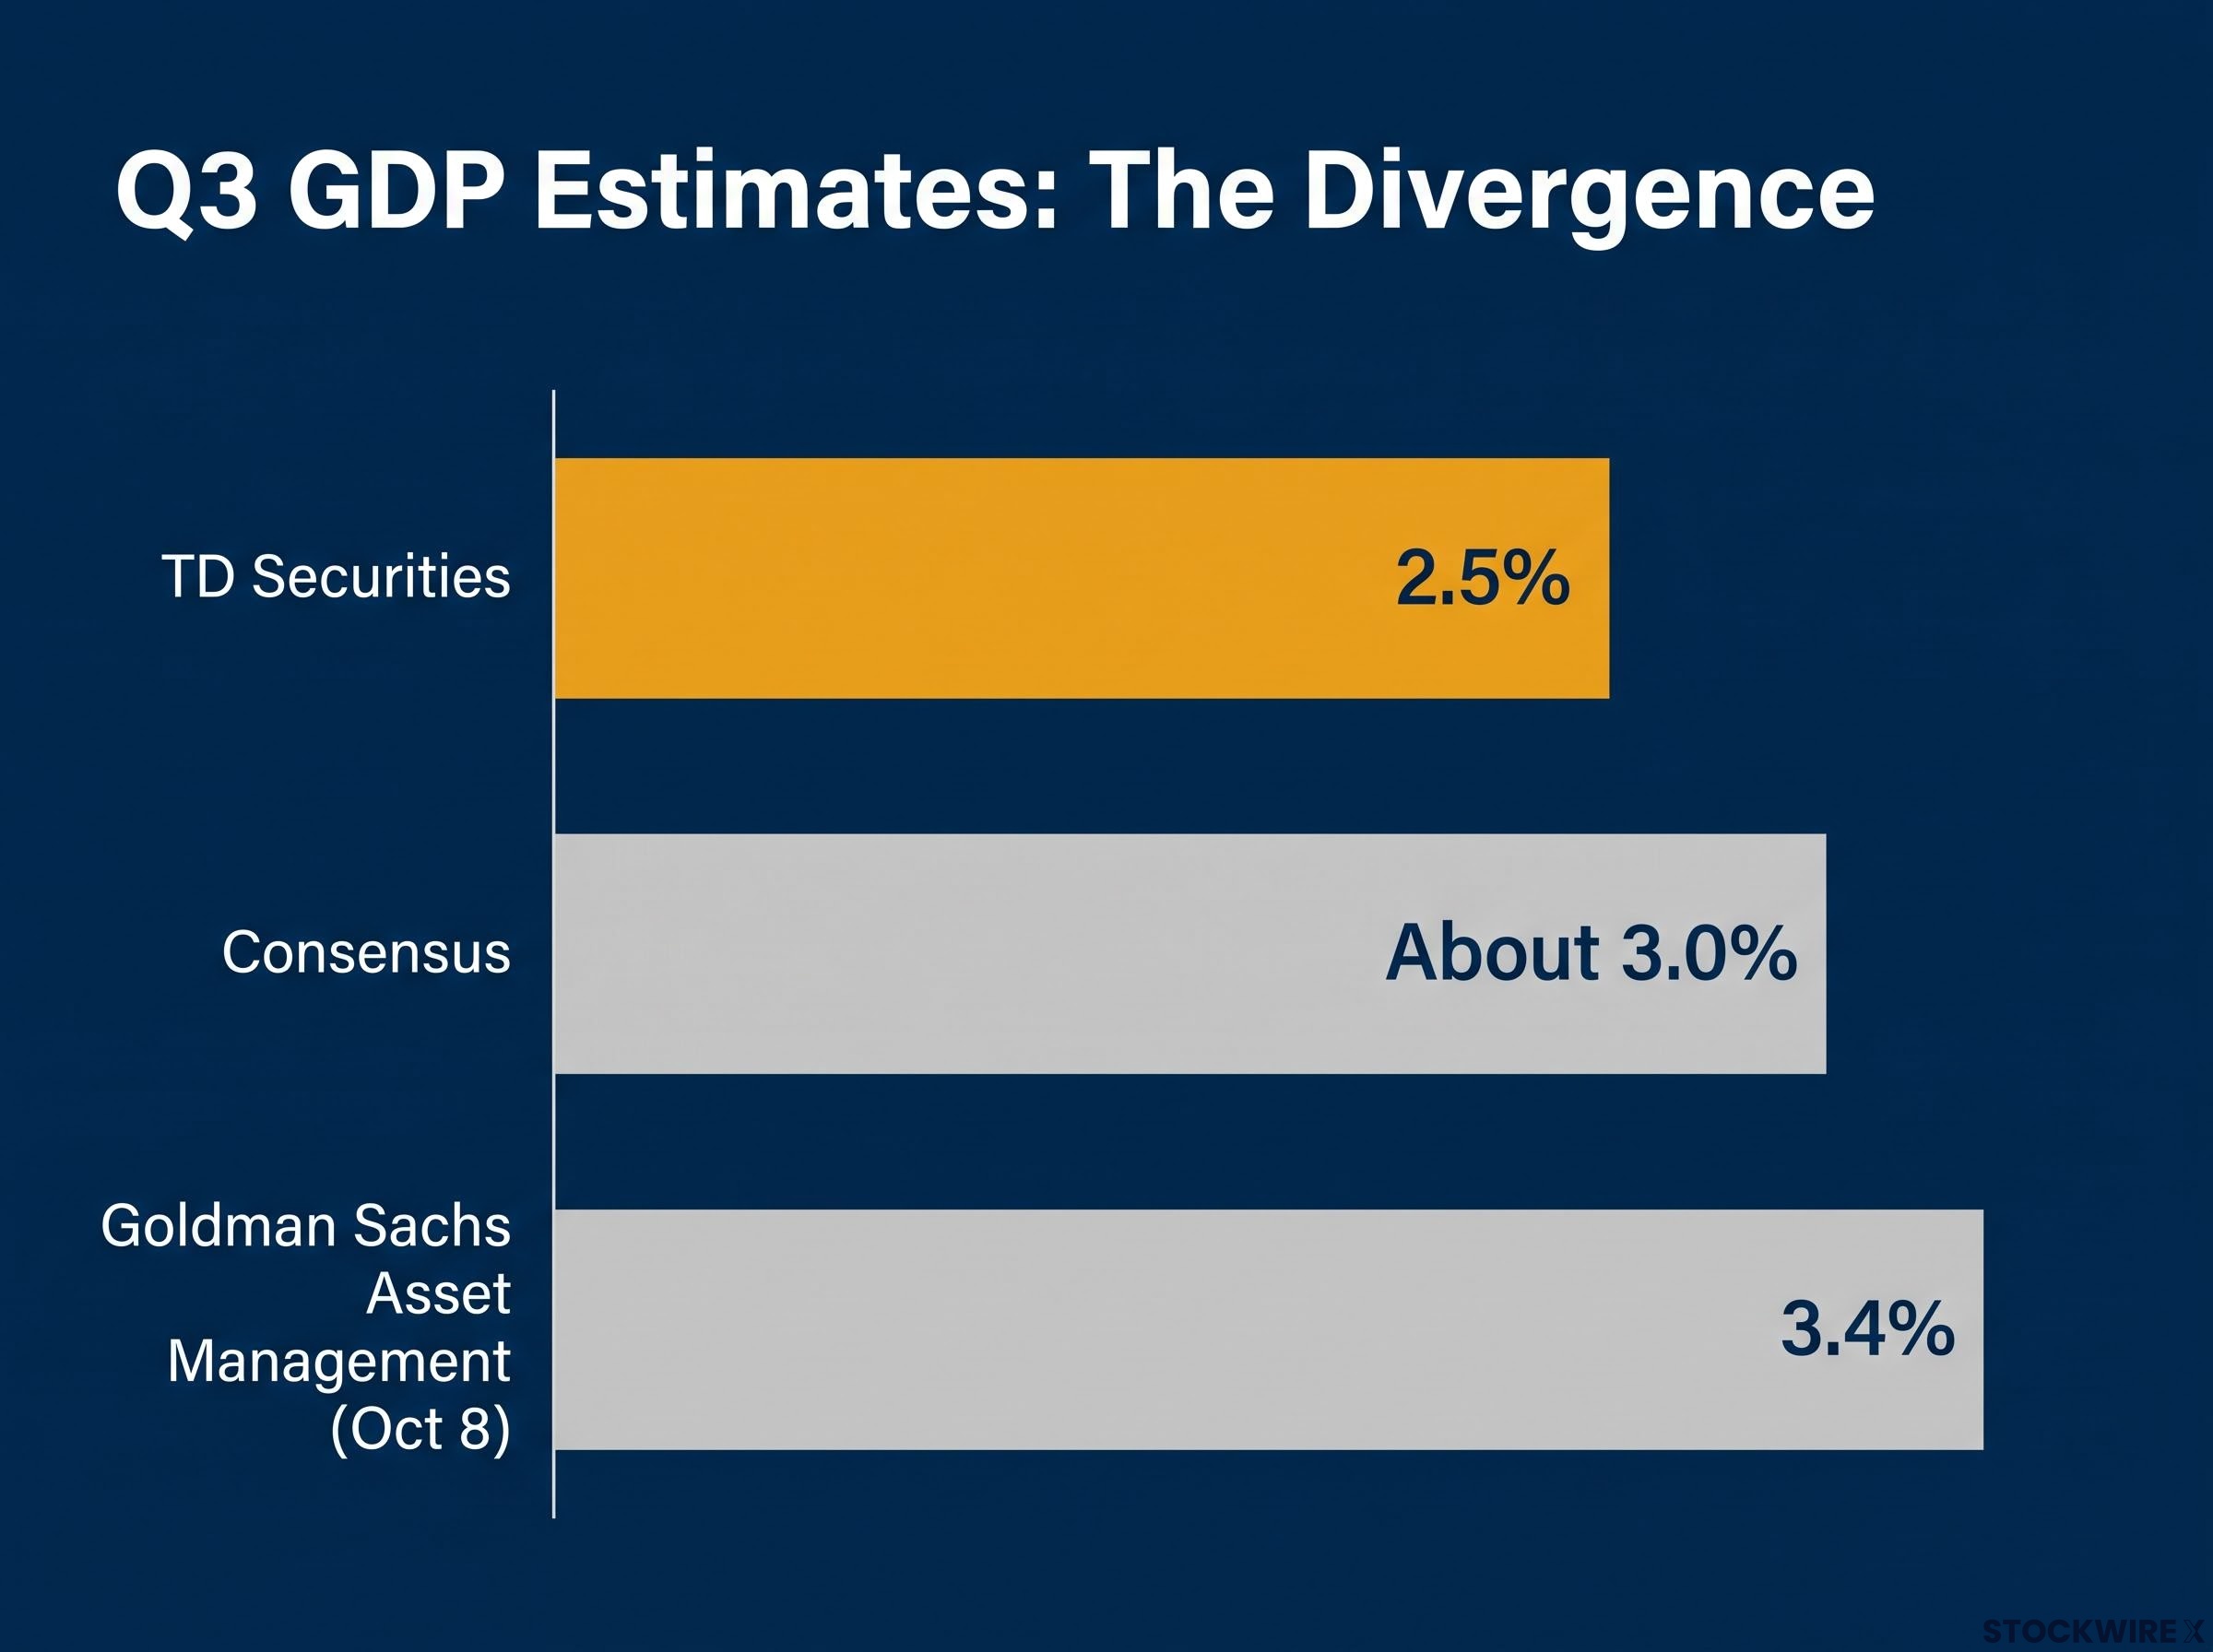
The disagreement is on growth. TD expects third-quarter GDP of 2.5% annualised, against a consensus near 3.0%.
The data arrives with a December rate hike priced at roughly 76%, according to CME FedWatch figures reported on 26 October. The federal funds target range sits at 3.75%-4.00%. The September PCE report is due on 29 October 2026 and has not yet been released.
Here is a framework for reading a hot, in-line or soft print. It also covers how to judge whether a solid GDP figure is hiding a squeezed household.
What TD Securities expects from September PCE and Q3 GDP
On inflation, TD’s numbers sit almost on top of the market’s. On growth, they part ways.
| Measure | Consensus | TD Securities | Gap |
|---|---|---|---|
| Headline PCE, m/m | 0.50% | 0.49% | Essentially identical |
| Headline PCE, y/y | 3.6% | 3.6% | Identical |
| Core PCE, m/m | 0.30% | 0.32% | TD 0.02 pp higher |
| Core PCE, y/y | 3.1% | 3.1% | Identical |
| Q3 real GDP, annualised | About 3.0% | 2.5% | TD 0.5 pp lower |
Consensus figures come from Newsquawk (23 October).
The PCE forecast: energy lifts the headline, goods and services lift the core
TD expects the report to echo September’s hot consumer price index (CPI). The bank sees energy driving the headline acceleration from August’s 0.3% monthly and 3.4% annual pace, according to the Bureau of Economic Analysis (BEA). The Bureau of Labor Statistics (BLS) September CPI data showed where that energy pressure came from:
- Headline CPI: 3.8% y/y, core 3.1% y/y
- Energy: +5.2% m/m
- Gasoline: +9.1% m/m, more than half of the monthly all-items rise
TD also sees strength in both goods and services lifting core PCE. Its market-based core measure, which strips out prices that are imputed rather than observed in transactions, is forecast at +0.34% m/m. Because the forecasts cluster so tightly, a tenth-of-a-point miss on core m/m will move your rate expectations. The y/y headline will not.
The GDP forecast: where TD sits below the crowd
TD lifted its Q3 call to 2.5% from 2.2%. It sees consumption as resilient but slowing, and fixed investment strong on AI spending. That still leaves TD below consensus and well below Goldman Sachs Asset Management‘s 3.4% estimate from 8 October. The bank also expects real spending and real income to turn negative in September.
Strip out inventories, imports and government spending and private domestic demand often gives a cleaner read on corporate revenue conditions than the headline growth figure does.
When big ASX news breaks, our subscribers know first
How PCE is calculated and why the Fed trusts it over CPI
How can CPI run at 3.8% while TD expects PCE at 3.6% for the same month? The two gauges measure different things.
What PCE measures that CPI does not
PCE stands for personal consumption expenditures, the national accounts measure of what consumers spend. Governor Philip Jefferson has explained that CPI covers mostly what households pay for directly. PCE aims to capture all consumer spending.
| Feature | PCE | CPI |
|---|---|---|
| Scope | All consumer spending, including purchases made on households’ behalf by third parties | Mainly out-of-pocket household purchases |
| Health care | Includes employer- and government-funded payments | Direct out-of-pocket spending |
| Housing weight | Lower | Higher |
| Weight updating | Monthly | Generally fixed for a year |
| Formula | Chain-weighted, allows substitution | More fixed-basket |
The Cleveland Fed flagged the same health care, housing and weighting differences in December 2024.
Why the Fed gives PCE the last word
A chain-weighted index updates its weights as spending shifts, so it follows what people actually buy.
The Fed’s view The Federal Reserve‘s inflation explainer, updated on 2 October 2026, says PCE adapts more quickly to changing spending patterns.
JPMorgan Asset Management notes that consumers move away from items whose prices rise fastest. A fixed basket overweights those items, which is one reason PCE often runs below CPI. PCE also sits inside the national accounts, and the BEA can revise its history as data improves.
When the two gauges diverge, the Fed leans on PCE. A hot CPI does not automatically mean a hot PCE, so do not extrapolate one into the other.
Energy, tariffs and AI: is this inflation shock cyclical or structural?
Each institution tracking this inflation has identified a slightly different driver.
| Source | Date | Main driver cited | View on persistence |
|---|---|---|---|
| Fed September minutes | 7 October | Tariffs, geopolitically linked energy and input costs, AI-related tech goods | Multiple overlapping pressures |
| Governor Michael Barr | 29 September | AI investment, tariffs, Middle East conflict | Several forces at once |
| San Francisco Fed | 15 October | Energy and core goods | Gap to 2% concentrated there |
| JPMorgan | 9 July | Hormuz-linked oil, gas, fertiliser and helium shock | Year-end core PCE raised to 3.4% |
| Goldman Sachs Research | 27 February | Tariffs | Expected to fade, core PCE 2.2% by December |
Goldman’s David Mericle offered the optimistic case early in the year: tariff effects would wash out. The evidence since then has complicated that view. Energy CPI is up 20.4% year on year, and the San Francisco Fed places the remaining gap to target squarely in energy and core goods. Goldman Sachs Asset Management adds one reassurance: services inflation has largely normalised.
Split the drivers by how long they may last:
- Likely cyclical: energy prices, tariff pass-through, consumer demand
- Possibly structural: AI-related capital spending, which may persist for years
Barr pointed back to 2022, when PCE inflation peaked near 7%. That shock came largely from reopening bottlenecks and the war in Ukraine. Today’s trade-off is harder, because tariffs and AI demand sit on top of energy.
Fed officials have begun naming AI infrastructure inflation as a distinct pressure, since data-centre construction competes with housing and manufacturing for scarce resources and lifts electricity costs.
The read is a cyclical supply shock layered onto a structural investment boom. Rate hikes cannot produce more oil or remove tariff costs. That leaves the Fed choosing between tolerating elevated inflation and weakening demand, and that choice shapes the pricing of rates and long-duration assets in your portfolio.
Solid GDP, squeezed households: what the growth and real income split signals
TD expects GDP of 2.5% in the same quarter that real incomes turn negative. Both can be true at once.
Two ways to read solid GDP
The optimistic reading, shared by JPMorgan and Goldman Sachs Asset Management, treats AI capital spending and wealth effects as genuine supports for growth. The cautious reading points to the Fed’s July 2026 Monetary Policy Report. It linked slower consumer spending to weaker real disposable income, slower wages, lower immigration, tariffs and high gasoline prices.
August adds a pointer. Current-dollar spending rose 0.9% while personal income rose 0.2% and disposable income 0.3%. The gap suggests some households may be leaning on savings, although the data does not confirm it.
The trend underneath Reuters reported on 26 October that business investment boomed on the data-centre and AI build-out, yet economists still see underlying trend growth near 2%.
What to check inside the GDP report
Five caveats shape how much weight to put on the headline:
- Consumer fragility: negative real income erodes the consumption engine.
- Stagflation risk: energy and tariffs can lift prices while cutting demand.
- Concentration risk: AI spending may sit with a few large firms.
- Import leakage: imported equipment adds less to domestic output than it appears.
- Distributional effects: asset gains may support wealthier households while others are squeezed.
A GDP figure at or above 2.5% does not mean households are healthy. Before you conclude the economy can absorb a December hike, check consumption growth, equipment and data-centre investment, and imports. A hot inflation print alongside weak real consumption fits a stagflationary pricing pattern.
GDP composition matters because consumer spending is roughly 68% of output, so a strong headline built on investment cannot fully offset households pulling back.
What the Fed and markets do with a hot, in-line or soft print
The Fed held the range at 3.75%-4.00% on 16 September, and the October meeting has not yet taken place. December hike odds have eased from 89.5% on 15 October to about 78% (CNBC, 23 October) and 76.2% on 26 October.
| Scenario | Core PCE m/m | December hike odds | Treasury yields | Dollar |
|---|---|---|---|---|
| Hot | Near or above 0.32%-0.34% | Rise; hike could become base case | Higher | Stronger |
| In-line | Around 0.30% | Little changed | Little changed | Little changed |
| Soft | Below roughly 0.30% | Fall | Front end lower | Weaker |
A soft print would also support the view that this is a one-off energy and tariff shock.
The asymmetry With a hike largely priced, a soft print would probably trigger a bigger dovish repricing than an in-line one.
Judge the print against what is already priced, not against zero. Positioning can amplify a surprise in either direction.
What to take into 29 October and what comes after it
The inflation forecasts sit at consensus. The real divergence is on growth, and the Fed must weigh a supply-driven price shock against fragile household income.
On release day, check three things:
- Core PCE m/m against 0.30% and 0.32%
- The consumption versus investment split in GDP
- Any move in December hike odds from roughly 76%
The October FOMC meeting still lies ahead. One print will not settle whether this shock is cyclical or structural.
Investors exploring cross-asset risk around a priced-in hike can read our detailed coverage of Fed decision market impact, which shows how bonds, the dollar and gold react when guidance disappoints.
This article is for informational purposes only and should not be considered financial advice. Investors should conduct their own research and consult with financial professionals before making investment decisions. Past performance does not guarantee future results. Financial projections are subject to market conditions and various risk factors, and forward-looking statements are speculative and subject to change.