Coca-Cola, Polaroid and Xerox were all excellent businesses in 1972. Investors who bought them at the peak still watched them fall by roughly 69% to 91%, and some waited a decade or more just to break even. If you believe that the price you pay matters less than the quality of the business you buy, their history argues otherwise.
The question has become urgent again. AI and semiconductor leaders now dominate index weightings, with semiconductors alone making up about 18% of the S&P 500, according to Apollo. Last week, Michael Burry published an essay warning that stretched valuations could mean long stretches of flat real returns.
You can own a great company and still make a poor purchase. If you confuse the two, you can lose real money.
Here is a clear way to separate the quality of a business from the quality of its price. You will also see how disciplined, regular buying has historically held up when the starting price was wrong.
Why did great companies become poor investments in the Nifty Fifty era?
In the late 1960s and early 1970s, a group of about 50 large American companies became known as the Nifty Fifty. Professional investors treated them as “one-decision” stocks: you bought them once and never sold. The list included Polaroid, Kodak, Xerox, Disney and Coca-Cola.
The thinking had real merit. These were dominant brands with growing earnings and loyal customers. The belief that followed was the dangerous part: if the business was this good, the price you paid did not matter.
That belief was tested when the group peaked in late 1972.
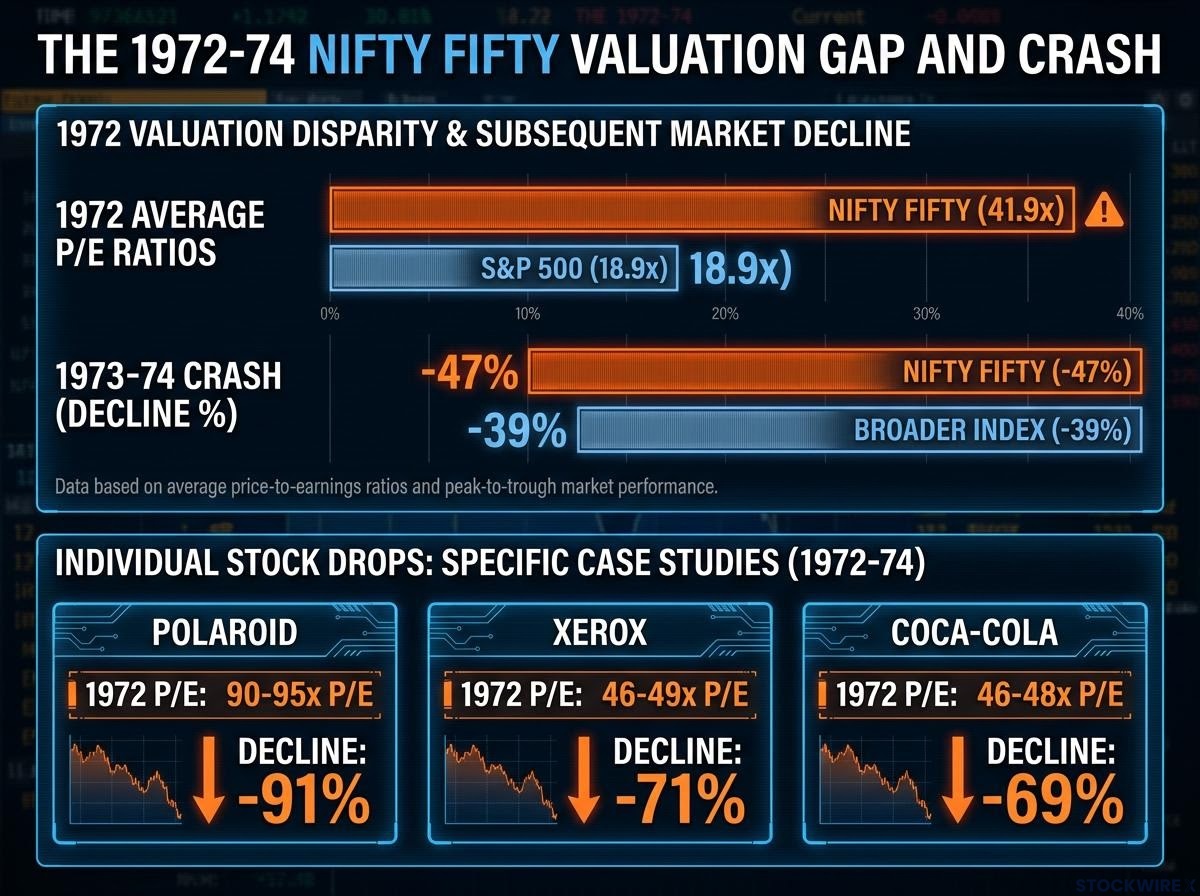
The valuation gap at the peak The Nifty Fifty traded at an average of about 41.9x earnings, against about 18.9x for the S&P 500.
A price-to-earnings (P/E) ratio is the share price divided by the company’s annual earnings per share. It tells you how many dollars you pay for each dollar of yearly profit. Morningstar rounds the 1972 gap to about 40x versus 20x. On its estimates, the Nifty Fifty then fell 47% in 1973-74, compared with 39% for the broader index.
Your price-to-earnings (P/E) ratio is the quickest check on how much future growth you are paying for, though it has well-known blind spots with cyclical earnings, debt-heavy balance sheets and one-off accounting items.
The gap between a 40x multiple and a 20x market means the 1972 buyer was paying in advance for decades of flawless growth. Even when the business performed well, the buyer had very little room for error.
| Stock | Approx. peak P/E | Peak-to-trough decline 1972-74 |
|---|---|---|
| Polaroid | 90-95x | About -91% |
| Xerox | 46-49x | About -71% |
| Coca-Cola | 46-48x | About -69% |
| Eastman Kodak | About 48x | Not available |
Polaroid’s shares slid from about $149.50 to $14.13. Kodak and Xerox never recaptured their former standing. Coca-Cola did eventually grow into its valuation, but its 1972 buyers still waited years for that to happen.
What Siegel’s defence adds
Wharton’s Jeremy Siegel argues that the group was not uniformly irrational. In his view, the superior long-run earnings growth of many members meant that, measured over decades, they were less badly priced than the crash implied. That case softens the verdict without erasing the drawdown.
Company-specific problems also played a part. Reuters Breakingviews points out that Polaroid and Avon suffered operating troubles on top of the market derating, with digital photography eventually undermining Polaroid’s economics. Overpaying was necessary for the damage, but it was not the only cause.
When big ASX news breaks, our subscribers know first
How does a great business turn into a poor investment?
Most investors carry a simple assumption: a good company makes a good stock. The Nifty Fifty show that the assumption leaves out a variable, and you can see it once you break your return into its parts.
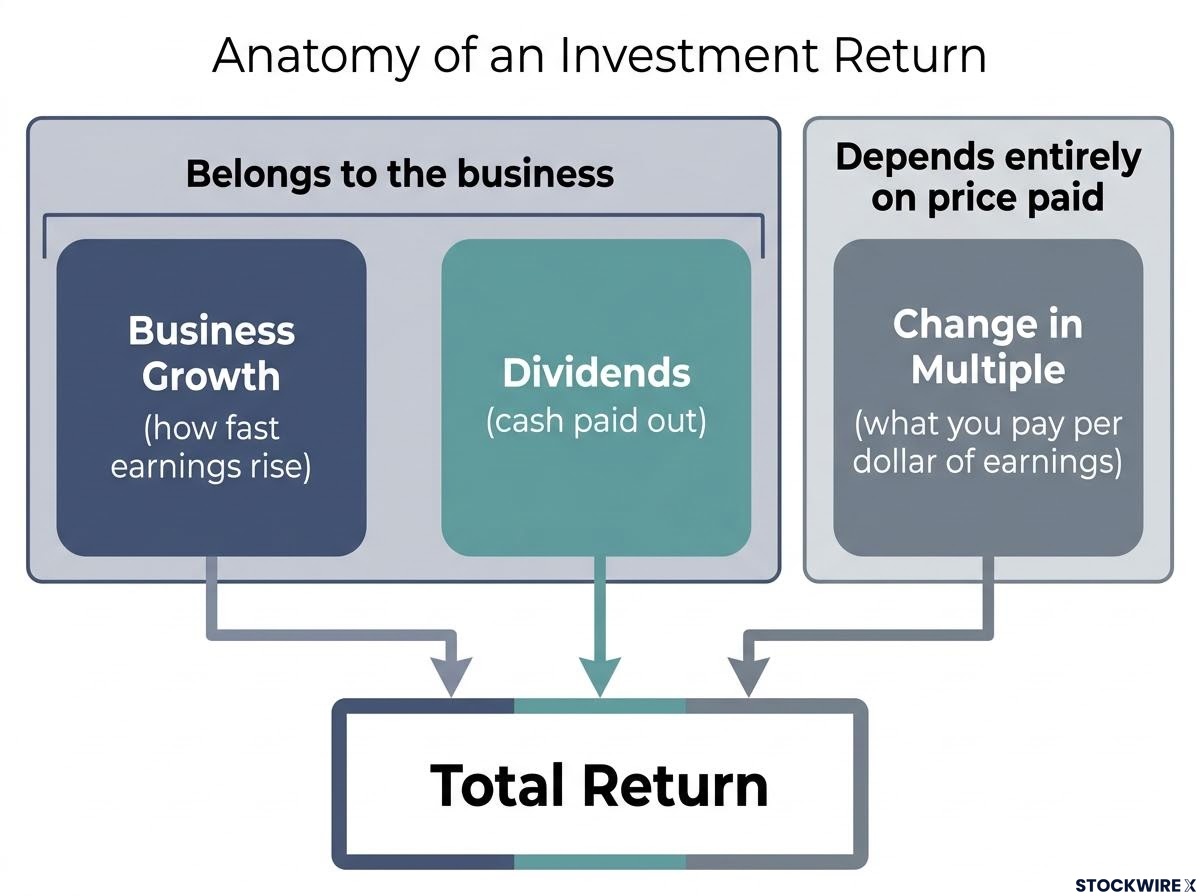
Over time, your investment return roughly equals:
- Business growth: how fast the company’s earnings rise
- Dividends: the cash the company pays out to you
- Change in the multiple: whether investors pay more or less per dollar of earnings at the end than at the start
The first two parts belong to the business. The third depends entirely on the price you paid.
Here is a hypothetical example. Suppose you buy a company at 40x earnings, and over ten years its earnings double. If the market then values it at 20x, your share price ends roughly where it started. A business that did everything right has given you little more than its dividends.
That is exactly where the Nifty Fifty buyers lost. Their companies often grew, but the multiple term turned sharply negative.
A great story becomes a bad investment at the wrong price.
This rule comes from the principle-based framework taught by Everything Money. It sits alongside a related idea: a company’s value equals the present value of its future cash flows. The decision rule follows naturally. If the price is good, buy. If it is not, wait.
The pattern did not end in 1972.
| Case | What happened | Lesson |
|---|---|---|
| Cisco after 2000 | Stayed profitable, but its extreme valuation meant a long recovery | A dominant company can still be overpriced |
| Microsoft after 2000 | Buyers near the 1999-2000 peak saw roughly a decade of little nominal price progress | Quality does not protect against an excessive multiple |
| Nikkei after 1989 | Strong companies, but decades of poor aggregate returns | A market of good businesses can still disappoint after a speculative peak |
| Polaroid | A P/E of about 90-95x, then a fall of about 91% | Technological leadership is not a margin of safety |
| Coca-Cola | Excellent franchise bought at a P/E in the high 40s | Later success does not erase the original valuation risk |
When you weigh up a purchase, “Is this a good company?” is the wrong question. Ask instead what growth is already priced in, and what happens to your return if the multiple shrinks.
Because P/E alone cannot tell you what is priced in, you can pair it with other stock valuation metrics such as the PEG ratio, free cash flow multiples and EV/EBITDA before deciding whether a price is reasonable.
What is Burry’s flat-returns warning, and how much do dividends change it?
In his 17 October 2026 essay on his Cassandra Unchained Substack, Burry cautioned that speculation and stretched valuations could bring another 15-20 years of little or no real stock gains. To support the view, he pointed to three earlier stretches of stagnation in the S&P 500.
The price-only figures make uncomfortable reading. Real prices fell about 58% from 1929 to 1949, about 53% from 1966 to 1982, and about 40% from 2000 to 2011.
Burry’s argument, however, is narrower than “everyone loses for two decades”. His point is that high starting valuations can keep real price returns disappointing for very long periods. It is his opinion, not a forecast you should treat as certain.
Dividends change the picture considerably.
| Period | Real price return | Real total return with dividends reinvested |
|---|---|---|
| 1929-1949 | About -58% | Positive by 1949 |
| 1966-1982 | About -53% | About -10% |
| 2000-2011 | About -40% | About -25% |
The gap between those columns shows that dividends are far more than a footnote. Over 15-20 years, reinvested income can turn a painful-looking chart into a modest loss or even a gain.
Reading the caveats
These caveats cut both ways. Some make the warning look worse than typical experience, while others make index returns look better than you might have achieved in practice.
- Start-date bias: 1929, 1966 and 2000 were unusually unfavourable entry points. They show what is possible, not the median outcome.
- Survivorship bias: Index returns benefit from replacing weaker companies over time. If you had held the original constituents, your result could have differed.
- Price versus total return: Burry’s headline figures exclude dividends. He also compares annual-average levels rather than precise daily peaks and troughs.
- Inflation measure: Real returns shift depending on how inflation is calculated.
The longer record adds balance. The UBS Global Investment Returns Yearbook 2025 reports 3.5% annualised real returns for global equities since 2000, which is weaker than in earlier eras. Over 125 years, the figure is 5.2%, against 1.7% for bonds and 0.5% for bills.
Today’s S&P 500 trades at about 18.5-20.1x forward earnings on late-October readings. Forward earnings are analysts’ estimates of profit for the coming year. Earlier 2026 estimates ran as high as 22.5-25.2x. Either way, the market sits above its long-run average, though not at 2000-style extremes.
Does dollar cost averaging protect you when the price is wrong?
Dollar cost averaging (DCA) means investing a fixed amount at regular intervals, whatever the market is doing. When prices fall, your fixed amount buys more shares, and you keep collecting dividends through flat stretches.
The headline claims are striking. According to Everything Money, DCA into the Nasdaq from the March 2000 peak produced about 15% annualised, and into the S&P 500 more than 13%, despite the Nasdaq falling roughly 80% into 2003.
A separate reconstruction, which assumes $10,000 invested at the start plus $200 a month, shows how the recovery unfolded.
| Index | Peak-to-trough decline from March 2000 | Approx. DCA break-even |
|---|---|---|
| S&P 500 | -46.5% | July 2005 |
| Nasdaq-100 | -78.2% | About 2009 |
By comparison, a lump sum invested in the Nasdaq-100 at the peak did not regain its nominal value until about 2017.
Two results that look contradictory
Morningstar analysis, summarised by Nasdaq in May 2025, tells a much more sober story. Through October 2022, DCA into the S&P 500 from the 2000 peak returned about -1.75% annualised, against about -13.84% for a lump sum.
You cannot compare the two sets of results directly. They use different end dates and contribution schedules, and the original source does not say how it measured returns. What both agree on is that steady buying limited the damage of a terrible starting point.
What dollar cost averaging cannot do
The lump-sum evidence Vanguard research found that investing a lump sum outperformed staged investing about two-thirds of the time, because stocks tend to rise and cash sitting idle earns less.
Advantages:
- It reduces the risk of investing everything just before a crash
- It supports discipline and lowers regret
- It suits investors who invest from each pay packet
Limitations:
- It can leave money idle in cash while markets rise
- It does not fix the problem of overpaying for an expensive asset
- Results depend on the schedule, fees, taxes and end date
Regular investing is best seen as a way to stay invested and avoid a single badly timed bet, not as a guarantee against buying an expensive market. Use broad indexes rather than narrow sector funds. The hardest part, as Everything Money’s presenter stresses, is controlling your emotions.
Investors exploring how contributions held up through the 2000s will find our full explainer on lost decade investing, which tracks a monthly contributor against a lump-sum holder using the same S&P 500 fund.
Pricing the next great story: what the Nifty Fifty leaves you to weigh
The Nifty Fifty did not prove that quality investing fails. They showed that quality bought at an extreme valuation can deliver poor or flat real returns for years.
Today’s AI and semiconductor leaders are real, profitable companies, which lowers the odds of a 2000-style collapse. That does not remove the risk of paying for too much future success. Whether current prices are reasonable remains a matter of judgement, and Burry’s warning is one investor’s opinion.
Before you buy, ask yourself three questions:
- What growth is already priced in?
- What happens to my return if the multiple shrinks?
- Could I keep buying through a long flat stretch?
Historically, reinvested dividends and steady buying of broad indexes have softened bad starting points, though past performance does not guarantee future results.
This article is for informational purposes only and should not be considered financial advice. Investors should conduct their own research and consult with financial professionals before making investment decisions.