On 22 October 2026, the Nasdaq Composite dropped 2.6% to 26,008.86, its sharpest single-day fall since early June. In the same month, Kohl’s and Cracker Barrel each posted gains above 30%, two of the clearest mid-cap turnaround stocks in a rally that most headlines missed.
That contrast is the signal. Money was not leaving the market. It was changing address.
Doubts about how AI spending will be financed, and whether it will ever pay off, pushed some investors toward under-followed mid-caps, cyclicals and companies repairing their operations. Much of the hard evidence for the named stock gains, however, comes from Investing.com’s own promotional coverage of its ProPicks AI screener. The market’s moves and the screener’s claims need to be judged separately.
Read on and you will know what actually drove these rallies, which parts look durable and which look one-off, and how to test any quantitative stock-picking claim before you trust it.
Why did a Nasdaq sell-off push money toward under-followed mid-caps?
The jolt was broad. Alongside the Nasdaq’s fall, the S&P 500 slipped 1.21% to 7,663.43, according to reported closing levels that have not been independently confirmed.
Reuters linked the sell-off to high-profile earnings that revived fears about the AI-spending race. Commentators also pointed to rising bond yields, costlier financing and growing impatience for proof that AI outlays will lift profits.
The AI payoff question Edward Jones strategist James McCann said investors are becoming more demanding about AI payoffs and are questioning whether the spending is sustainable at higher interest rates.
Put that doubt next to the alternatives and the rotation’s logic appears. When expensive tech must prove its earnings, cheaper companies that can show near-term earnings surprises, debt reduction or capital returns start to look relatively attractive.
The same pattern appeared earlier in the year, when a mid-cap rotation outpaced mega-cap tech in June as investors questioned expensive valuations; the October move looks like a second leg of that trade rather than a new one.
Several names moved hard on single days, as reported by Investing.com:
- HP Inc. rose 7.79%
- Robert Half rose 8.78%
- Bobs Discount Furniture rose 8.16%, taking its October gain to 17.51%
Investing.com’s InvestingPro team, through author Mark Garro, says its list contains more than 35 double-digit winners. That is the provider’s figure, not an independent market study.
What this tells you is that investors were repricing expectations on AI payoffs rather than abandoning equities. The catch is that a rotation built on sentiment can unwind as quickly as it formed, and mid-caps carry less liquidity, which can make them more volatile when risk appetite fades.
When big ASX news breaks, our subscribers know first
What do Kohl’s and Cracker Barrel reveal about how a turnaround rally is built?
On the surface, both stocks look like clean success stories. Each beat earnings by a wide margin, cut debt and drew analyst support. Underneath, both reports lean on tariff refunds, and neither has fixed its customer traffic.
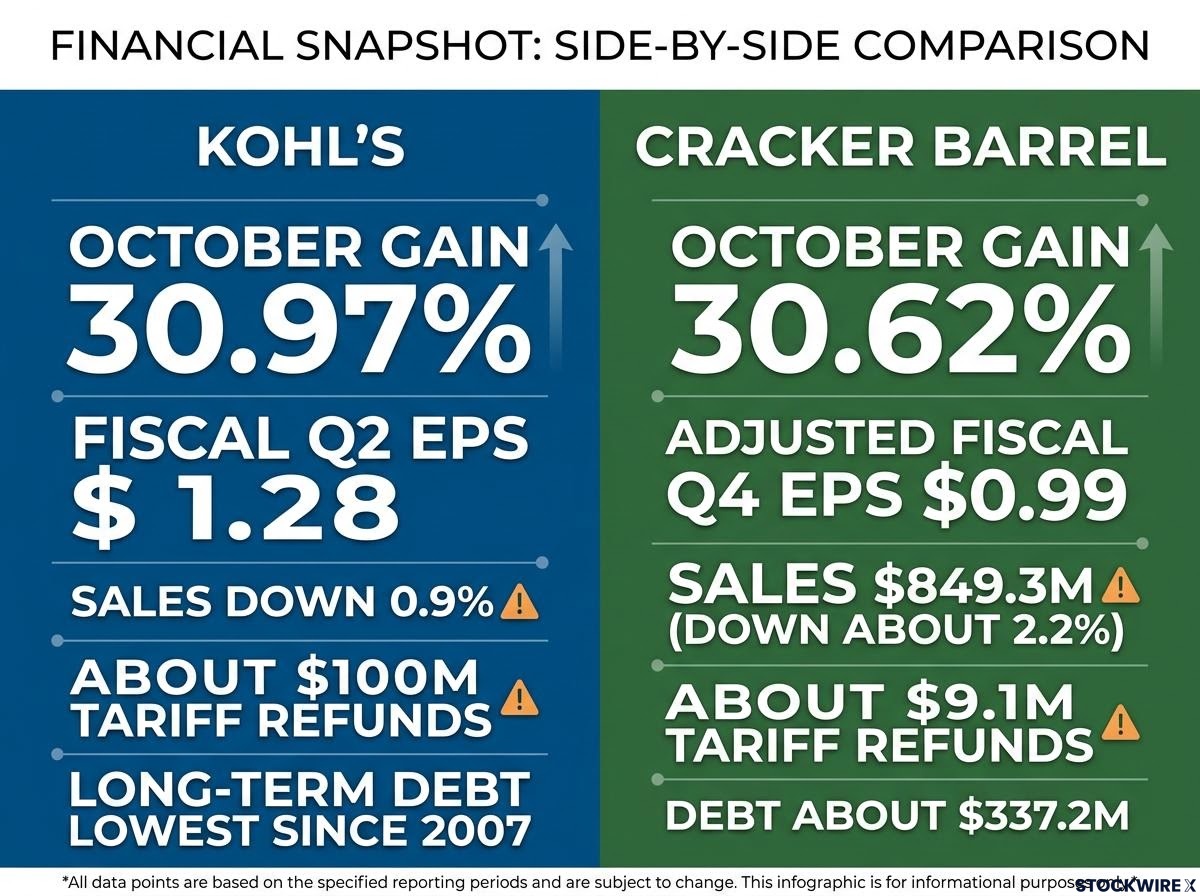
| Metric | Kohl’s | Cracker Barrel | Headline strength | Caveat |
|---|---|---|---|---|
| Latest EPS | $1.28 (fiscal Q2) vs $0.57 consensus | $0.99 adjusted (fiscal Q4) | Very large beats | Expectations were set low |
| Sales | Down 0.9% | $849.3M, down about 2.2% | Cracker Barrel beat revenue forecasts | Both still shrinking |
| Tariff refunds | About $100M | About $9.1M in adjusted EBITDA | Lifted margins and profit | May not repeat |
| Balance sheet | Long-term debt lowest since 2007 | Debt about $337.2M vs $484.6M | Lower risk | Cracker Barrel used asset sales |
| October gain | 30.97% | 30.62% | Sharp re-rating | Price may run ahead of recovery |
Kohl’s: a beat with an asterisk
Kohl’s reported fiscal Q2 earnings per share (EPS, the profit attributable to each share) of $1.28, more than double the $0.57 consensus. Gross margin rose 305 basis points to 43.0%; a basis point is one-hundredth of a percentage point. Management lifted full-year EPS guidance to $1.80-$2.40 from $1.00-$1.60, and resumed buybacks for the first time since 2022.
Gordon Haskett upgraded the stock to Buy with a $27 target, noting traffic declines had narrowed from high-single digits to mid-single digits. The firm still called traffic “choppy” and flagged the lower- and middle-income shopper, squeezed by food, fuel and other essentials, as the main risk. Shares jumped 11.82% in one day.
The roughly $100 million in tariff refunds is the asterisk. Strip it out and the margin story looks considerably less dramatic.
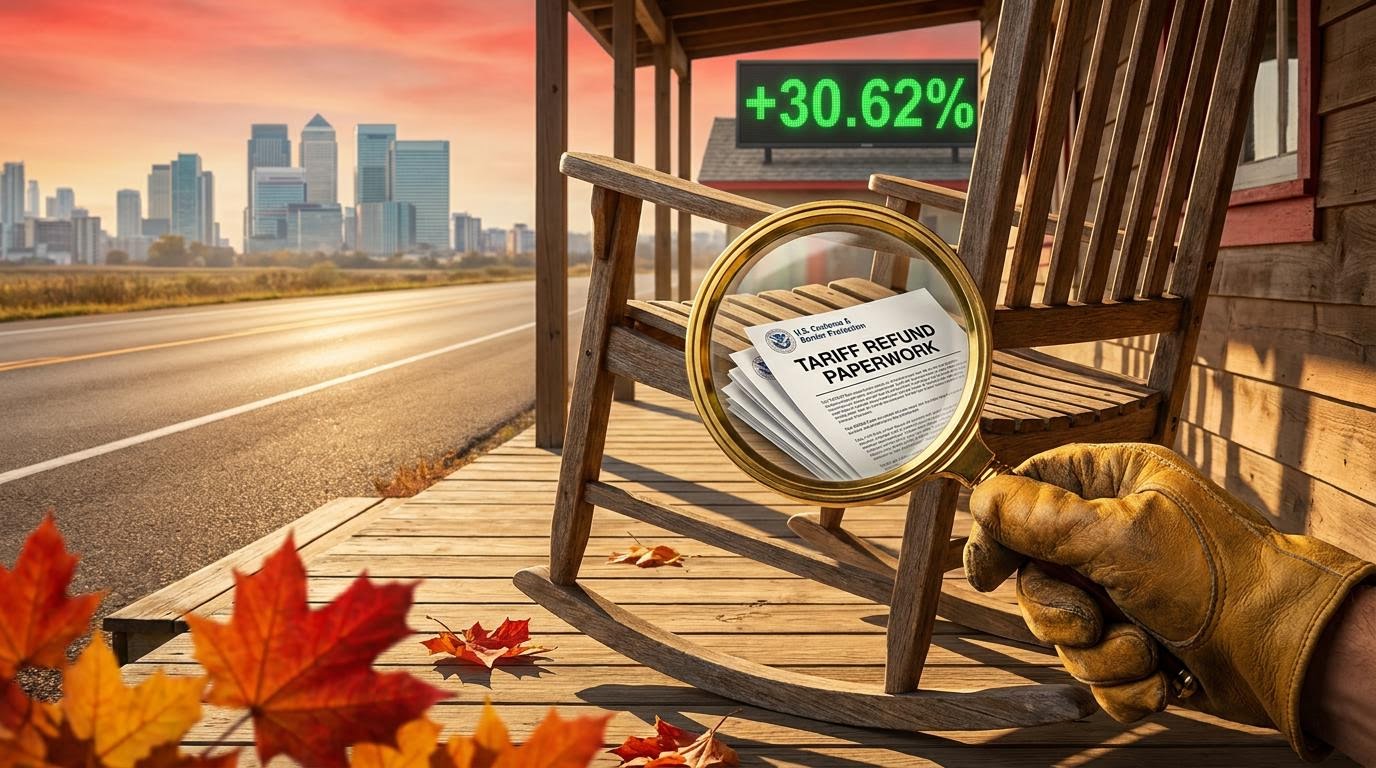
Tariff refunds flowing back to importers after the Supreme Court ruling explain why both companies could book one-off profit lifts, and why the benefit may not repeat once the refund pipeline runs dry.
Cracker Barrel: brand reversal, balance-sheet repair, soft traffic
Cracker Barrel’s rally is a narrative repair. CEO David Deno’s “return-to-heritage” strategy reversed unpopular modernisations, including an abandoned rebrand, and leaned on a loyalty base of 12 million members. Adjusted EBITDA (earnings before interest, tax, depreciation and amortisation) reached $62.1 million, beating forecasts by a very large margin, though sources disagree on the exact consensus.
Debt reduction came partly from a sale-leaseback (selling property, then renting it back) and the Maple Street Biscuit divestiture. Those moves shrink debt but can hand future flexibility to landlords and buyers. Argus set a target near $60, and Wells Fargo holds a bullish stance, while Citi and Bank of America remain cautious and consensus sits at Hold with an average target near $51.
The bear case rests on traffic, still down about 6%. The large EPS beats tell you expectations were set very low; the refunds and weak traffic tell you to ask how much of this improvement would repeat next quarter.
Why do turnaround rallies happen, and why do so many fade?
Kohl’s and Cracker Barrel are not isolated cases. The same handful of forces shows up across very different businesses.
Six mechanisms behind the rally
- Low expectations. When forecasts are near zero, a small improvement produces a huge percentage surprise. Cracker Barrel fits here.
- Re-rating. Investors stop valuing a company as a decliner and apply a normal sector multiple, the price paid per dollar of earnings. Kohl’s traded near 8x earnings before its run, according to Investing.com.
- Debt paydown. Less debt means lower interest costs and less refinancing risk. Kohl’s debt at a 2007 low illustrates it.
- Buybacks. Repurchasing shares lifts EPS and signals balance-sheet confidence. Gartner expanded its authorisation by $500 million.
- Short covering. Investors who bet on a fall must buy back shares after good news, amplifying the jump. Cracker Barrel’s near-33% single-day move suggests this force at work.
- Narrative repair. A new CEO or restored brand lowers perceived execution risk, as with Deno.
The other October winners show these forces at work. Their figures come from Investing.com’s promotional coverage and were not independently corroborated.
| Company | October gain | Key operating result | Likely driver |
|---|---|---|---|
| Kyndryl | +25.41% | Hyperscaler revenue up 34% YoY; $400M-$500M free-cash-flow target reaffirmed | Modernisation demand |
| Gartner | +21.60% | Adjusted Q2 EPS $4.37, up 24%; record $5.3B research contract value | Earnings plus buybacks |
| Cognizant | +21.09% | Q2 revenue $5.48B, up 4.5%; improved margin guidance | Enterprise AI migration |
| Ardent Health | +20.59% | Revenue $1.62B; operating cash flow $197M, up 67% | Cost discipline, EBITDA guidance up to $535M |
Where turnaround trades break down
The same forces run in reverse. Watch for:
- One-off tax, tariff, insurance or litigation benefits
- Cost cutting that damages revenue or customer experience
- Debt reduction achieved through asset sales rather than operations
- Buybacks before the balance sheet is genuinely repaired
- A weak consumer cycle overwhelming the improvement
- Re-ratings that price in years of unproven recovery
- Short covering that exhausts itself after the first squeeze
Tariff refunds are the live example: both headline beats included them. Seeing the same mechanisms across Kyndryl, Gartner and Ardent tells you the pattern is repeatable, but the failure list tells you the price you pay today may already include years of recovery that has not happened. Crowding adds risk too, because once a theme is widely promoted, one disappointing quarter can reverse it.
Balance sheet filters such as low long-term debt to equity and net cash positions matter more as rates rise, since companies meeting them face less refinancing stress than those relying on asset sales.
How much weight should you give an AI stock screener’s track record?
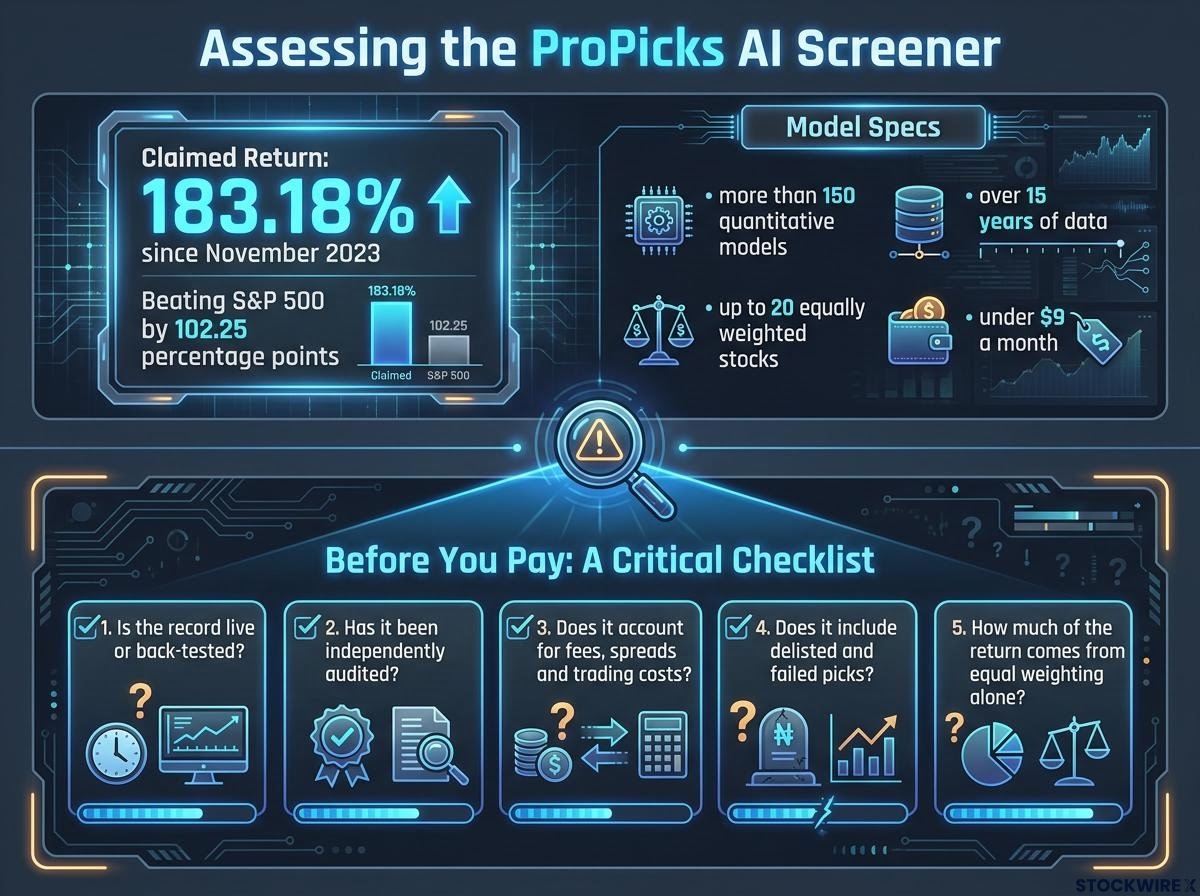
According to Investing.com, ProPicks AI screens thousands of global stocks each month using more than 150 quantitative models and over 15 years of data. It selects up to 20 equally weighted stocks per strategy, then adds, keeps or drops names monthly. The provider says it flagged Kohl’s in October and Cracker Barrel in August, and promotes access at under $9 a month, with prices varying by region.
Equal weighting is the first reason for caution. Giving every stock the same slice tilts a portfolio toward smaller, more volatile companies, so apparent outperformance may reflect that tilt rather than picking skill.
Execution is the second. Models often assume closing prices and ignore bid-ask spreads, taxes and the difficulty of buying thinly traded mid-caps after a public recommendation.
Then come the statistical traps. National Bureau of Economic Research (NBER) work found that combining many signals can produce impressive backtests even from random data, a problem known as overfitting. Survivorship bias, which excludes bankrupt or delisted firms from historical tests, inflates returns further, and models calibrated in one rate regime can drift when conditions change.
Regulatory view According to SEC investor guidance, back-tested performance is hypothetical, does not reflect actual results and should be distinguished from a real track record. This guidance was cited in research but not independently confirmed.
FINRA Rule 2214 also expects analysis tools to disclose their methodology, assumptions and the hypothetical nature of projected results.
With that context, consider the headline. Investing.com says its tech picks list returned 183.18% since launching in November 2023, beating the S&P 500 by 102.25 percentage points, in material published on 23 October 2026. No independent corroboration was found, and the figure is unaudited.
That number means little to you until you know whether it is live or hypothetical. Before paying for any screener, ask:
- Is the record live or back-tested?
- Has it been independently audited?
- Does it account for fees, spreads and trading costs?
- Does it include delisted and failed picks?
- How much of the return comes from equal weighting alone?
Past performance does not guarantee future results, and these return figures are subject to market conditions and various risk factors.
For readers wanting to test the screener’s claims, our full explainer on how ProPicks AI works details the monthly equal-weight rebalancing rules that returns depend on.
What the rotation proves, what it does not, and what to check next
The October shift toward mid-caps and turnarounds is a reasonably supported market story. Kohl’s and Cracker Barrel delivered genuine improvements, but tariff refunds flattered both. The screener’s 183.18% record remains an unverified promotional claim.
Your watch-list from here:
- Whether margins hold once tariff refunds fade
- Kohl’s holiday traffic, especially among stretched lower-income shoppers
- Cracker Barrel’s progress against fiscal-2027 adjusted EBITDA guidance of $180-$200 million
- Whether the rotation survives rising rates or a return to big-tech leadership
Treat the October list as a source of research ideas, not a signal to buy. Check the fundamentals yourself, quarter by quarter. These forward-looking views are speculative and subject to change as market and company developments unfold.
This article is for informational purposes only and should not be considered financial advice. Investors should conduct their own research and consult with financial professionals before making investment decisions.