You buy several exchange traded funds because you want to spread your risk. Look inside them, though, and you may find you have bought the same ten technology giants two or three times. That is the real question behind IVV vs NDQ: whether two popular funds give you two different exposures, or one exposure sold under two labels.
The timing matters. US market concentration sits near historic highs in 2026, which means a handful of companies now carry an unusually large share of index returns.
For Australian investors, the pull towards US funds is natural. The local market leans heavily on banks and miners, so growth often has to come from offshore. The catch is that differently marketed US products can share almost identical underlying holdings.
Using the iShares S&P 500 ETF (ASX: IVV) and the BetaShares Nasdaq 100 ETF (ASX: NDQ) as a case study, you will learn how to check your own holdings for overlap and how to build your US exposure on purpose rather than by accident.
The illusion of diversification in modern index funds
Owning five funds feels safer than owning one. Each new ticker in your brokerage account looks like another layer of protection.
That comfort can be misleading.
Portfolio overlap is the share of your money that ends up in the same underlying companies across different funds. It matters most in market-cap weighted index funds. Market-cap weighting means each company is held in proportion to its total sharemarket value, so the biggest companies get the biggest slices of your money.
Today, the biggest companies are very big indeed. IVV tracks the S&P 500, which covers roughly 80% of the US equity market by value. On paper that is 500 companies. In practice, the fund’s top ten holdings make up 38.99% of the portfolio, so a small group of mega-caps drives a large part of your result.
The same pool of stocks drives most US indices right now, and that pool is narrow. Simonelle Mody of Morningstar Australia makes the point directly: with US concentration near historic highs, many portfolios are far more concentrated than their owners assume, even when they hold a long list of products. Mody also acknowledges she once held around ten ETFs and ended up with duplicated exposure herself.
Product diversification is not asset diversification Counting the funds you own tells you how many products you bought. Measuring what share of your money sits in each underlying company tells you how diversified you really are.
The distinction is simple but easy to miss. Holding hundreds of companies on paper is not the same as being spread out by weight.
If every fund you own defaults to the same massive technology companies, adding another fund gives you no real protection. It just repeats the bet you already made.
Pairing a broad fund with a themed one can leave your portfolio less diversified than you think, because many themed ETFs lean on the same handful of mega-cap names that already dominate your core holding.
When big ASX news breaks, our subscribers know first
Peering under the hood at shared DNA and fee gaps
So what happens when you put IVV and NDQ side by side?
Their mandates sound different. IVV tracks the S&P 500, a broad index of large US companies across every sector. NDQ tracks the Nasdaq-100, the 100 largest non-financial companies listed on the Nasdaq exchange, fully replicated. One markets itself as the whole US market, the other as a targeted growth play.
Now look at what they actually hold.
| Rank | IVV holding and weight | NDQ holding and weight |
|---|---|---|
| 1 | NVIDIA 8.37% | NVIDIA 8.2% |
| 2 | Apple 7.36% | Apple 8.1% |
| 3 | Microsoft 5.77% | Microsoft 6.2% |
| 4 | Amazon 3.70% | Amazon 4.3% |
| 5 | Alphabet A 3.06% | Micron Technology 4.3% |
| 6 | Broadcom 2.53% | AMD 3.6% |
| 7 | Alphabet C 2.45% | Tesla 3.1% |
| 8 | Meta Platforms A 2.42% | Meta Platforms 3.1% |
| 9 | Micron Technology 1.82% | Alphabet 3.0% |
| 10 | Tesla 1.51% | Alphabet 2.8% |
| Top-10 total | 38.99% | 46.7% |
Holdings as at 30 September 2026. Sources: iShares factsheet (updated 12 October 2026); BetaShares (updated 23 October 2026). NDQ total calculated from displayed weights.
Nine of the ten names appear in both lists: NVIDIA, Apple, Microsoft, Amazon, Alphabet A, Alphabet C, Meta, Micron and Tesla. ETFLens estimates the two funds overlap by about 92% by weight, based on published holdings.
The iShares factsheet confirms the fund’s top ten holdings and its 0.04% annual management fee, so you can verify both the concentration and the cost figures for IVV directly from the issuer.
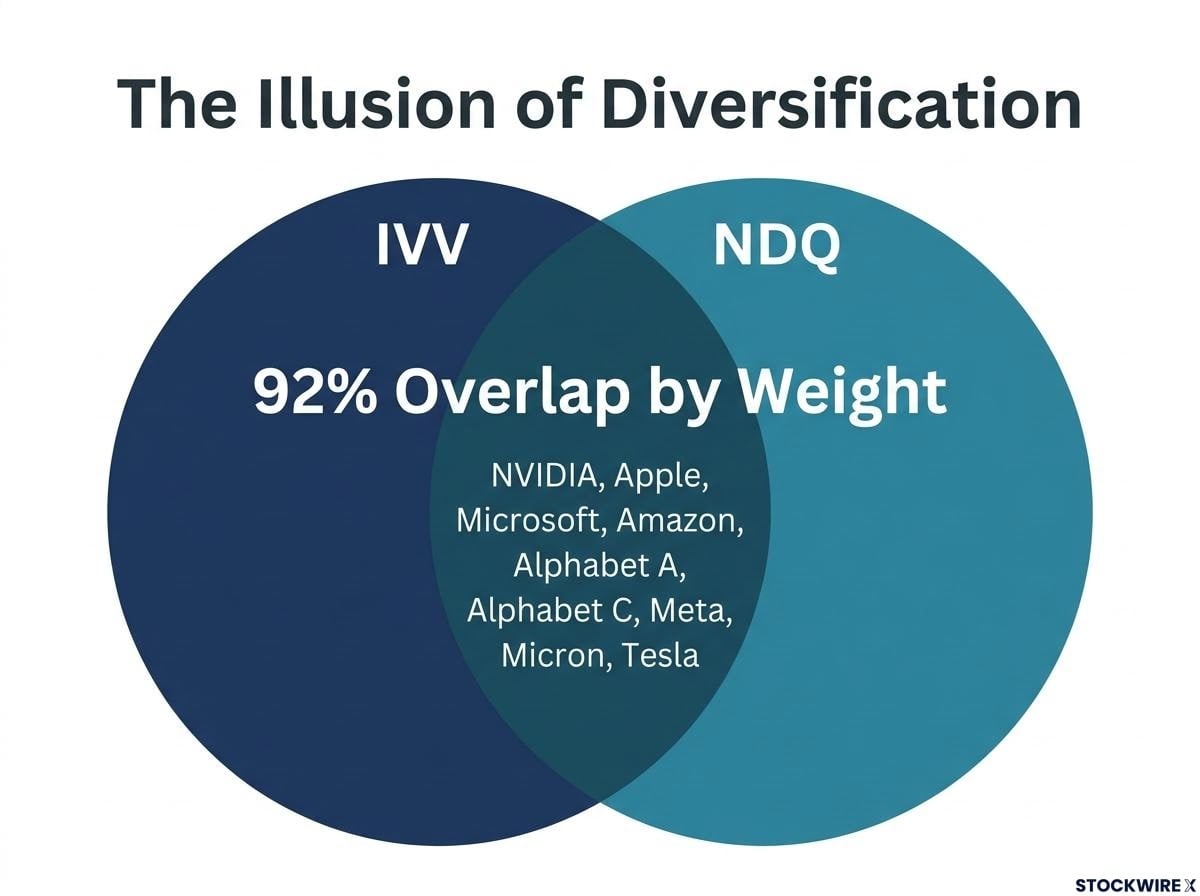
Different stories on the label. Almost the same engine underneath.
The true cost of duplication
The fee gap is where the overlap starts to cost you. IVV charges 0.04% a year, while NDQ charges 0.48%, a difference of 0.44 percentage points. NDQ costs more than ten times as much.
On every $100,000 invested, that gap works out to roughly $440 a year, before compounding and tax. Because fees come out every year, the dollars lost also stop earning returns, so the drag grows over long holding periods.
Morningstar’s analysts reflect this in their ratings. IVV holds a Gold Medalist rating, with analysts describing it as a best-in-class, low-cost option for broad US large-cap shares. NDQ carries a Negative Medalist rating in Morningstar’s most recent assessment (9 September 2026), which had earlier sat at Neutral. Morningstar accepts NDQ’s strong history and calls its fee reasonable, but does not expect the fund to beat its benchmark after costs.
Put simply, you pay a premium for a specialist fund that shares almost its whole top ten with your cheap core holding.
When two funds move as one during market volatility
Strong long-term returns make NDQ easy to love. The more useful question is how the two funds behave together when markets turn.
Correlation measures how closely two investments move in the same direction, on a scale from -1 to 1. A reading of 1 means they move in lockstep. Morningstar’s Portfolio X-ray put the correlation between IVV and NDQ at about 0.95, an increase from 86% in an earlier February 2025 comparison.
That number is distinct from holdings overlap. Overlap tells you what the funds own; correlation tells you how their returns behave. Both point the same way here.
The reason is shared drivers. Both indices respond to US earnings, interest rates, artificial intelligence spending, the US dollar and investor risk appetite. NDQ simply carries a heavier dose of the same ingredients.
| Measure | S&P 500 (IVV) | Nasdaq 100 (NDQ) |
|---|---|---|
| Information technology weight | 39.7% | 60.5% |
| Communication services weight | 9.9% | 14.7% |
| Financials | Included | 0.2% |
| Top-10 concentration | 38.99% | 46.7% |
| Five-year standard deviation | 13.16% | 17.14% |
Sector data as at 30 September 2026 (Charles Schwab using S&P Dow Jones Indices data; BetaShares). Standard deviation from Morningstar.
Standard deviation measures how widely a fund’s returns swing around their average. NDQ’s higher figure tells you it delivers a bumpier ride.
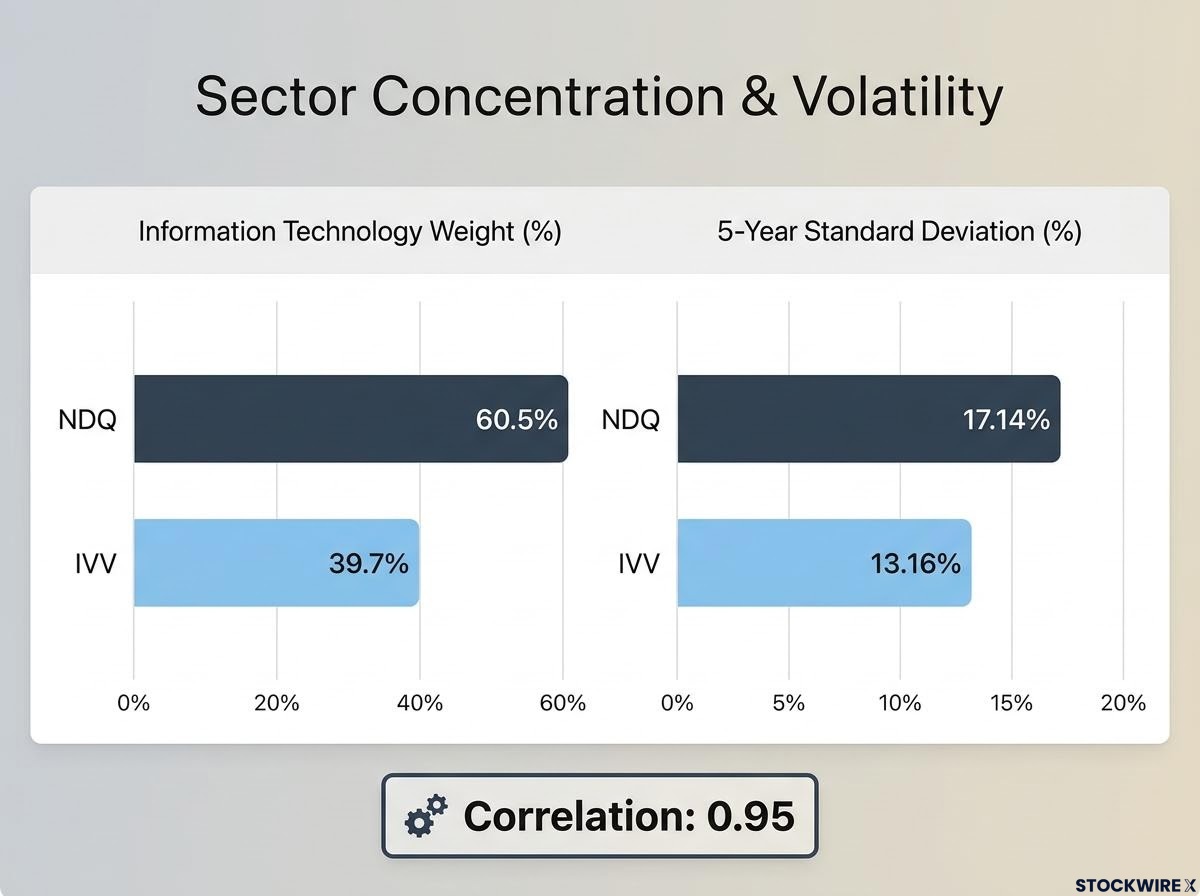
The returns gap does exist. To 30 September 2026, IVV returned 14.38% a year over five years, while NDQ returned 16.74% to 22 October 2026. That extra return came with extra exposure to a single sector.
The semiconductor-driven divergence in 2026 showed how a chip sell-off can hit a Nasdaq 100 fund far harder than a broad S&P 500 fund, even when the two share most of their largest holdings.
2022 showed the other side. As rising interest rates hit the valuations of long-duration growth stocks, companies whose value depends heavily on profits expected far in the future, NDQ fell about 28%, according to Morningstar. That was roughly double the loss of its category benchmark, while financials and energy held up relatively better.
With a correlation near 0.95, holding both funds does not soften a tech sell-off. It makes your losses bigger.
Past performance does not guarantee future results.
Structuring your US exposure with intentionality
None of this means NDQ is a mistake. The mistake is owning it without knowing why.
Many Australian ETF commentators frame the decision as core versus satellite. Your core is a cheap, broad holding that carries most of your money. Satellites are smaller positions that tilt your portfolio towards a specific view. In this setup, IVV acts as the broad US core, while NDQ becomes a deliberate tilt.
Under a disciplined core-satellite framework, each satellite should answer what thesis it expresses and why your core does not already capture it, which is exactly the test an NDQ position needs to pass.
The Nasdaq-100’s construction explains why it works as a tilt. Because the index excludes financial companies entirely, the relative weights of technology, communication services and consumer discretionary rise. You are not buying a different market. You are buying a more concentrated slice of the same one.
To check what you actually own, these tools can help:
- Morningstar Portfolio X-Ray: shows your combined holdings and includes a correlation matrix across funds.
- Sharesight Exposure Report: identifies underlying ETF holdings and flags overlapping securities across ETFs and direct shares.
- ETFLens: estimates overlap by weight between funds using published holdings.
Run your portfolio through one of these. If NVIDIA, Apple and Microsoft keep appearing across every fund, including global funds such as VGS, you have your answer.
The case for a deliberate tech tilt
There are legitimate reasons to hold both. If you want extra weight in semiconductors, software, cloud computing and digital advertising, pairing NDQ with IVV delivers exactly that.
History has rewarded the tilt. Nasdaq’s analysis found the Nasdaq-100 beat the S&P 500 in 14 of 18 calendar years from 2008 through June 2026. That is a historical record, not a forecast.
You can hold both, provided you treat NDQ as an active bet on continued tech dominance. It is not a defensive diversifier.
These statements are speculative and subject to change based on market developments.
Making an informed call in a concentrated market
The central lesson is that two funds with very different marketing can deliver nearly identical economic exposure. IVV and NDQ share nine of their top ten holdings, overlap by roughly 92% by weight and move together with a correlation near 0.95.
Costs are one of the few things you control. A fee gap of 0.44 percentage points compounds quietly, and keeping fees low is among the most reliable ways to lift your net returns over decades.
Holding a long list of ticker codes does not make your portfolio diversified. Knowing what sits underneath them, and why each position is there, is the risk management tool that counts when you invest offshore.
If you choose to tilt towards tech, do it knowingly, and size it like the concentrated bet it is.
This article is for informational purposes only and should not be considered financial advice. Investors should conduct their own research and consult with financial professionals before making investment decisions.