Two traders watched the same week of trading and reached opposite conclusions. One saw gold being dumped for cash and a dollar that refused to rally, and read it as a market bracing for trouble. The other counted a mix of good and bad readings, stepped back to neutral and sold volatility instead of adding risk.
Both had the same question: how do you tell a routine pullback from a deeper defensive shift? Cross-asset signals are the tool professionals use to answer it, and the way you weigh them decides which trader you end up agreeing with.
No single gauge settles this. That is why professionals watch how bonds, gold, the dollar, oil, credit and breadth move against each other. As of 23 October 2026, oil is trading near $100 a barrel, the 10-year Treasury yield sits around 5.1%, and gold has been sold hard this month, so these readings matter right now.
This gives you a practical way to weigh conflicting signals. You will also see which ones have earned the most weight this month, and which are louder than their evidence.
Why do correlations across assets matter more than any single signal?
Most investors reach for the VIX first. The VIX is an index of the volatility traders expect from S&P 500 options over the next month, and a high reading is often treated as proof that something serious is under way.
It is not enough on its own. What separates a pullback from a defensive shift is how many independent markets confirm the stress, not how far stocks fall.
Direction matters too. When equities fall while bond yields rise, the worry tends to be inflation, government finances or supply shocks. When equities fall and yields fall together, it looks more like a growth scare or a rush for safe, liquid assets.
| If you see this combination | It often suggests | Common false reading |
|---|---|---|
| Stocks down, yields up | Inflation, fiscal or supply concerns | A simple growth scare |
| Stocks down, yields down | Growth scare or demand for liquidity | Inflation fear |
| Gold down with stocks | Selling liquid winners to meet margin calls | Gold’s long-term case is broken |
| Dollar weaker during stress | Lower confidence in US assets, or just falling yields | Proof of foreign capital flight |
| CCC spreads widen, broad high-yield holds | Early warning among the weakest borrowers | All credit is fine |
| Equal weight and breadth improve | Selling concentrated in large tech | A broad market breakdown |
These relationships also break. The Bank for International Settlements (BIS) pointed out that gold rallied in 2024 alongside a stronger dollar and rising real yields, the opposite of the usual pattern. The IMF’s October 2025 Global Financial Stability Report warned that unusual correlations can turn a correction into something larger as leveraged investors unwind.
The lesson for you is direct: the same move can mean opposite things depending on what else is moving, so never act on one chart alone.
Why gold and the dollar can fall alongside stocks
When investors face margin calls (demands from a broker to add cash after losses), they sell what they can sell fastest. HSBC linked gold’s recent decline to exactly this kind of forced selling of profitable, liquid positions, along with rising yields and the cost of holding an asset that pays no interest.
Crowded trades in gold or US tech can be cut at the same time as risk limits tighten. If investors see US-specific fiscal or political risk, they may sell US stocks and the dollar together.
A weak dollar is not required, though. In a global scramble for cash, the dollar can strengthen while gold still gaps lower.
The forced selling behind gold’s 2026 bear market was amplified by crowded positioning, rising real yields and a firmer dollar, which is why gold can fall even when geopolitical headlines look supportive.
When big ASX news breaks, our subscribers know first
Same week, two readings: where the traders diverged
That grammar explains how two careful people can read one tape so differently. Each argument holds together; they simply lean on different signals.
The defensive-shift reading
The first trader saw bonds rallying as stocks fell, a return to an older pattern. Bonds, in this view, sit on the other side of the AI trade: heavy AI borrowing pushed financing costs up, and that is now reversing.
Gold being sold for cash and no safe-haven bid for the dollar, even against the euro, made it look worse. Oil near $100 for WTI and about $110 for Brent added to the sense of a market expecting something cyclical or worse.
There was a political layer too. Pictet reported on 20 October that prediction markets put about 60% odds on Democrats controlling both chambers, and BNY flagged possible constraints on the administration’s agenda, a risk for data centre construction and pro-growth policy.
The mixed-signals reading
The second trader ran a checklist: credit, correlations, breadth, the shape of the volatility curve, and the dollar. Credit looked weak and volatility of volatility had risen over two weeks. The front of the curve looked backwardated, with VXX at 19.80 and VXZ at 19.50; backwardation means near-term volatility products price above later-dated ones, a sign of urgent hedging demand.
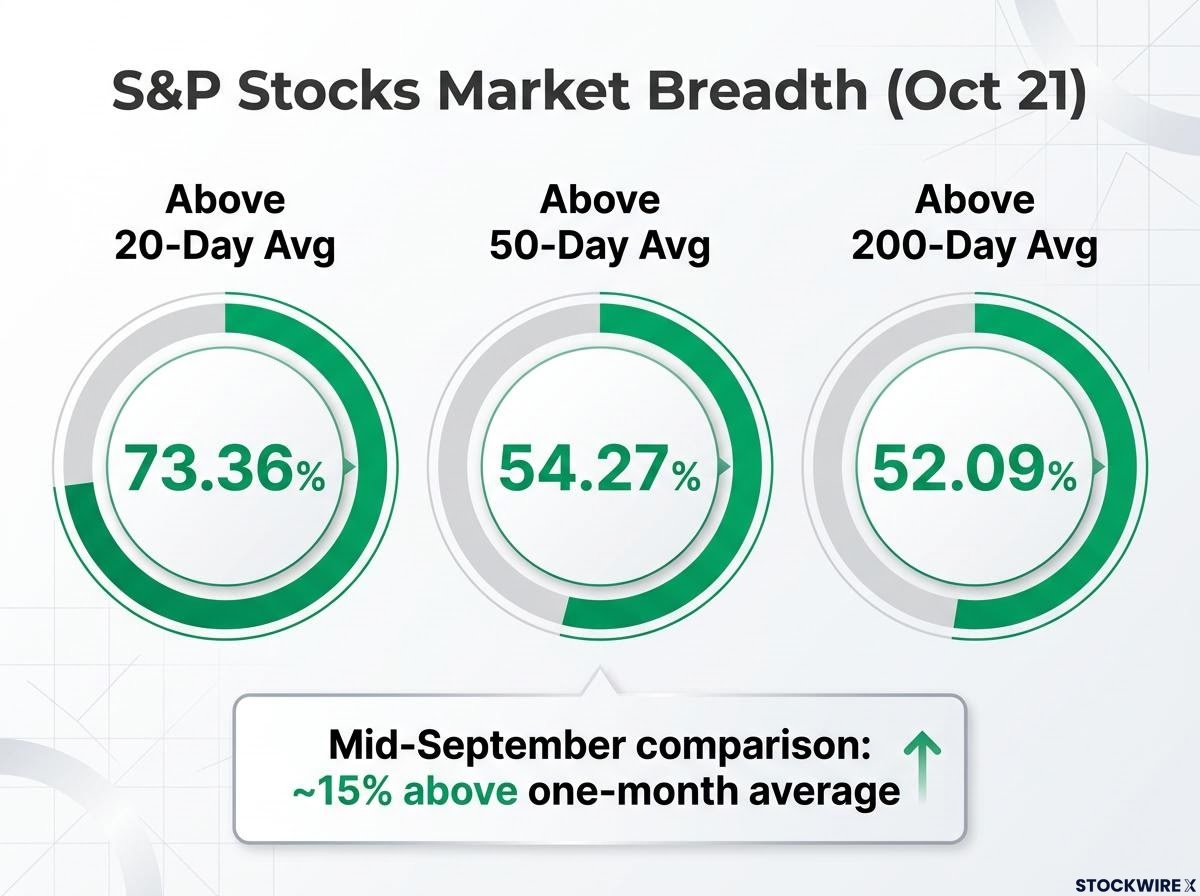
Breadth told a different story. The equal-weight S&P ETF, RSP, had outperformed over two weeks, and about 73% of stocks traded above their one-month average, against roughly 15% in mid-September.
So the trader moved from buying dips to neutral, and flipped from long to short precious metals.
| Signal | Trader one’s reading | Trader two’s reading |
|---|---|---|
| Gold and dollar | Liquidation and no safe-haven bid: a warning | A signal to go short precious metals |
| Credit | AI borrowing reversing | Weakening, not yet reversed |
| Breadth | Not central to the case | Improved, about 73% above one-month average |
| Positioning | Near-term defensive | Neutral and short volatility |
The real gap is weighting: gold and the dollar against breadth and the curve. Notice that “neutral” is itself a position, and that choosing which signals you trust is the actual decision.
Investors exploring how index concentration distorts these signals will find our full explainer on reading market divergence useful for its four comparisons that test whether a rally is broad.
What does the data actually say about each signal?
The fair way to settle the disagreement is to test each claim against dated numbers.
Credit: broad calm, narrow stress
Broad high-yield bonds look contained. The option-adjusted spread, the extra yield over Treasuries after adjusting for features like early repayment, stood at 3.33% on 20 October. The lowest-rated CCC-and-below bonds sat at 13.27%, and another tracker put them at 13.10%, the highest percentile in its history.
The clearest divergence Broad high-yield at 333 bp versus CCC at 1,327 bp: stress is gathering among the weakest borrowers first.
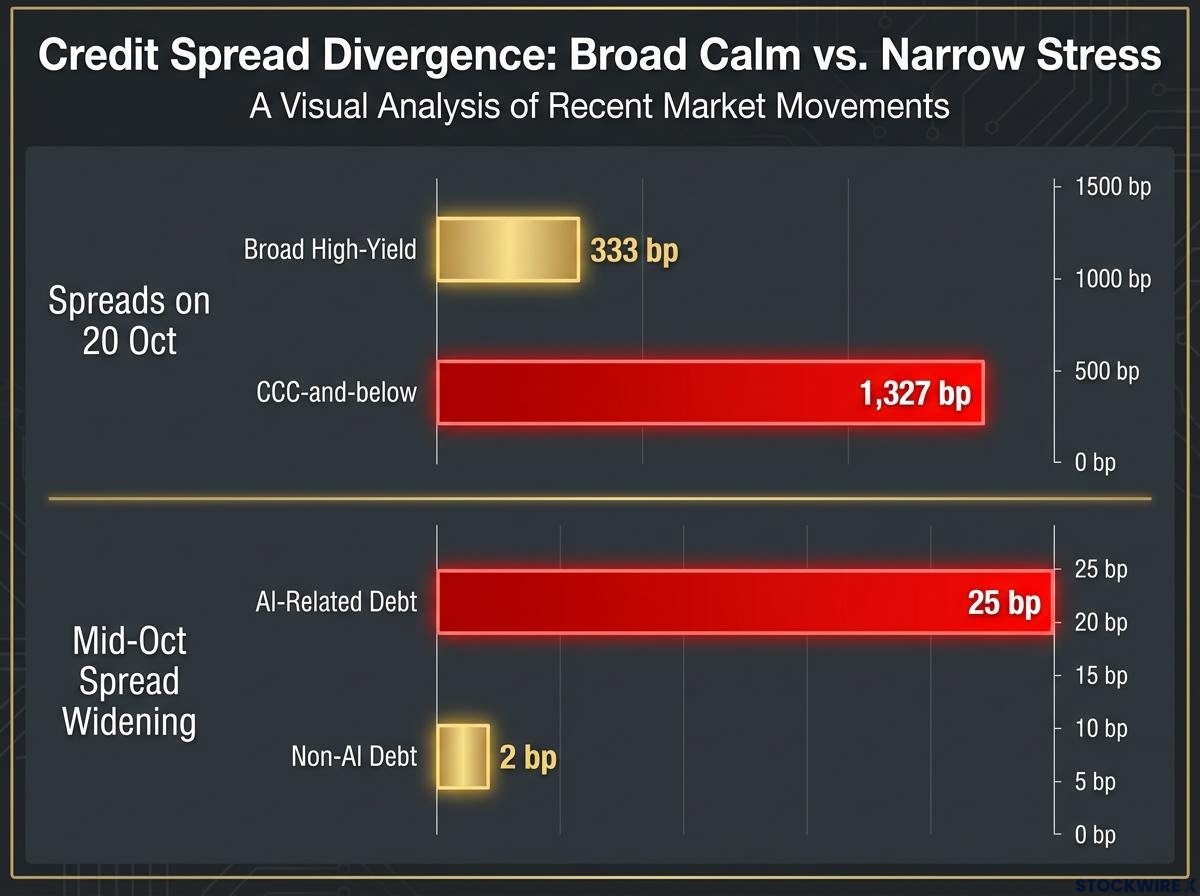
AI-linked debt is the sharpest pocket. According to Business Insider, AI-related high-yield spreads widened 25 bp to 360 bp on 13-14 October, against just 2 bp for non-AI debt. AI-related firms raised an estimated $466 billion in 2026 versus $101 billion a year earlier, and CoreWeave’s five-year credit default swap topped 1,100 bp.
The ETF claim weakens on inspection. HYG was roughly flat (-0.06%) on 20 October, and The Trading Tools rated the HYG/LQD ratio a tight, risk-on reading, so a long HYG decline is not corroborated.
Volatility, breadth and flows
The VIX fell to 16.68 on 21 October from 19.99 on 16 October. No reliable dated reading of the VIX futures curve turned up, so backwardation rests on the trader’s product quotes.
A falling VIX can also be mechanically suppressed, since large short-volatility exposure from systematic strategies can hold the headline reading down without reducing underlying risk, which is why you should not treat 16.68 as an all-clear.
Breadth has firmed: 73.36% of S&P stocks were above their 20-day average, 54.27% above their 50-day and 52.09% above their 200-day on 21 October, per Deanfi.
Flows are mixed and lagged. Foreigners pulled $26.3 billion from emerging markets in September, yet bought a net $279.2 billion of US securities in August, according to Reuters.
| Signal | Latest reading | Reads as |
|---|---|---|
| VIX | 16.68 (21 Oct) | Easing option stress |
| VIX curve | Unconfirmed by dated data | Open question |
| 10-year yield | About 5.1% | High financing cost |
| Dollar index | About 101.7 | Softer, not a safe haven |
| Gold | $4,188.50 (17 Oct) | Liquidation phase |
| WTI | $99.43 (22 Oct) | Inflation pressure |
| Credit | HY 333 bp, CCC 1,327 bp | Concentrated stress |
The loudest warning and the most reassuring one are both true. What you are looking at is a selective risk-off rotation, a concentrated risk rather than a confirmed systemic defensive regime.
A practical checklist for conflicting signals, and where it can mislead
The confirmation checklist
Treat each item as a yes or no. A pullback graduates into a defensive shift only when several tick together.
- Sustained VIX futures backwardation. Now: reported by one trader, unconfirmed.
- VIX elevated while the 10-year yield rises. Now: VIX easing toward the mid-teens.
- Broad high-yield materially above about 333 bp. Now: not yet.
- CCC widening and dragging HYG and JNK lower. Now: CCC widening, HYG stable.
- RSP/SPY and breadth deteriorating. Now: breadth improving.
- Gold falling with a weaker dollar. Now: yes.
- Foreign inflows into US equities reversing. Now: not shown in lagged data.
- Liquidity worsening across Treasuries, stocks and credit at once. Now: no clear evidence.
One or two ticks is a warning. A cluster is a regime change. Holding neutral or trimming risk until that cluster forms is discipline, not indecision.
Where the checklist can mislead
- The VIX measures S&P option implied volatility, not credit or funding stress.
- BIS found the August 2024 spike was amplified by wider option bid-ask spreads.
- ETF prices are not spreads; liquidity and composition move them.
- Flow data describe the past and can miss a fresh unwind.
- Short-volatility products can amplify stress, so the second trader’s stance carries its own tail risk.
| Episode | What happened | Lesson |
|---|---|---|
| February 2018 | VIX surged as short-volatility products amplified the move | A spike can be market structure, not recession |
| August 2024 | Option illiquidity inflated the VIX | High VIX can overstate damage |
| April 2025 | Gold sold to cover losses elsewhere | Gold falling with stocks can be forced deleveraging |
Weighing the evidence without forcing a verdict
On today’s numbers, the evidence points to a concentrated warning in CCC credit, AI leverage and oil, not a confirmed market-wide defensive turn. That can change quickly. The skill is weighting signals and waiting for confirmation, not chasing the most dramatic reading.
Watch three things next: broad high-yield spreads against the 333 bp mark, whether curve backwardation persists, and whether breadth holds near its recent readings. The midterm result is the catalyst that could move all three. These statements are speculative and subject to change based on market developments.
This article is for informational purposes only and should not be considered financial advice. Investors should conduct their own research and consult with financial professionals before making investment decisions.