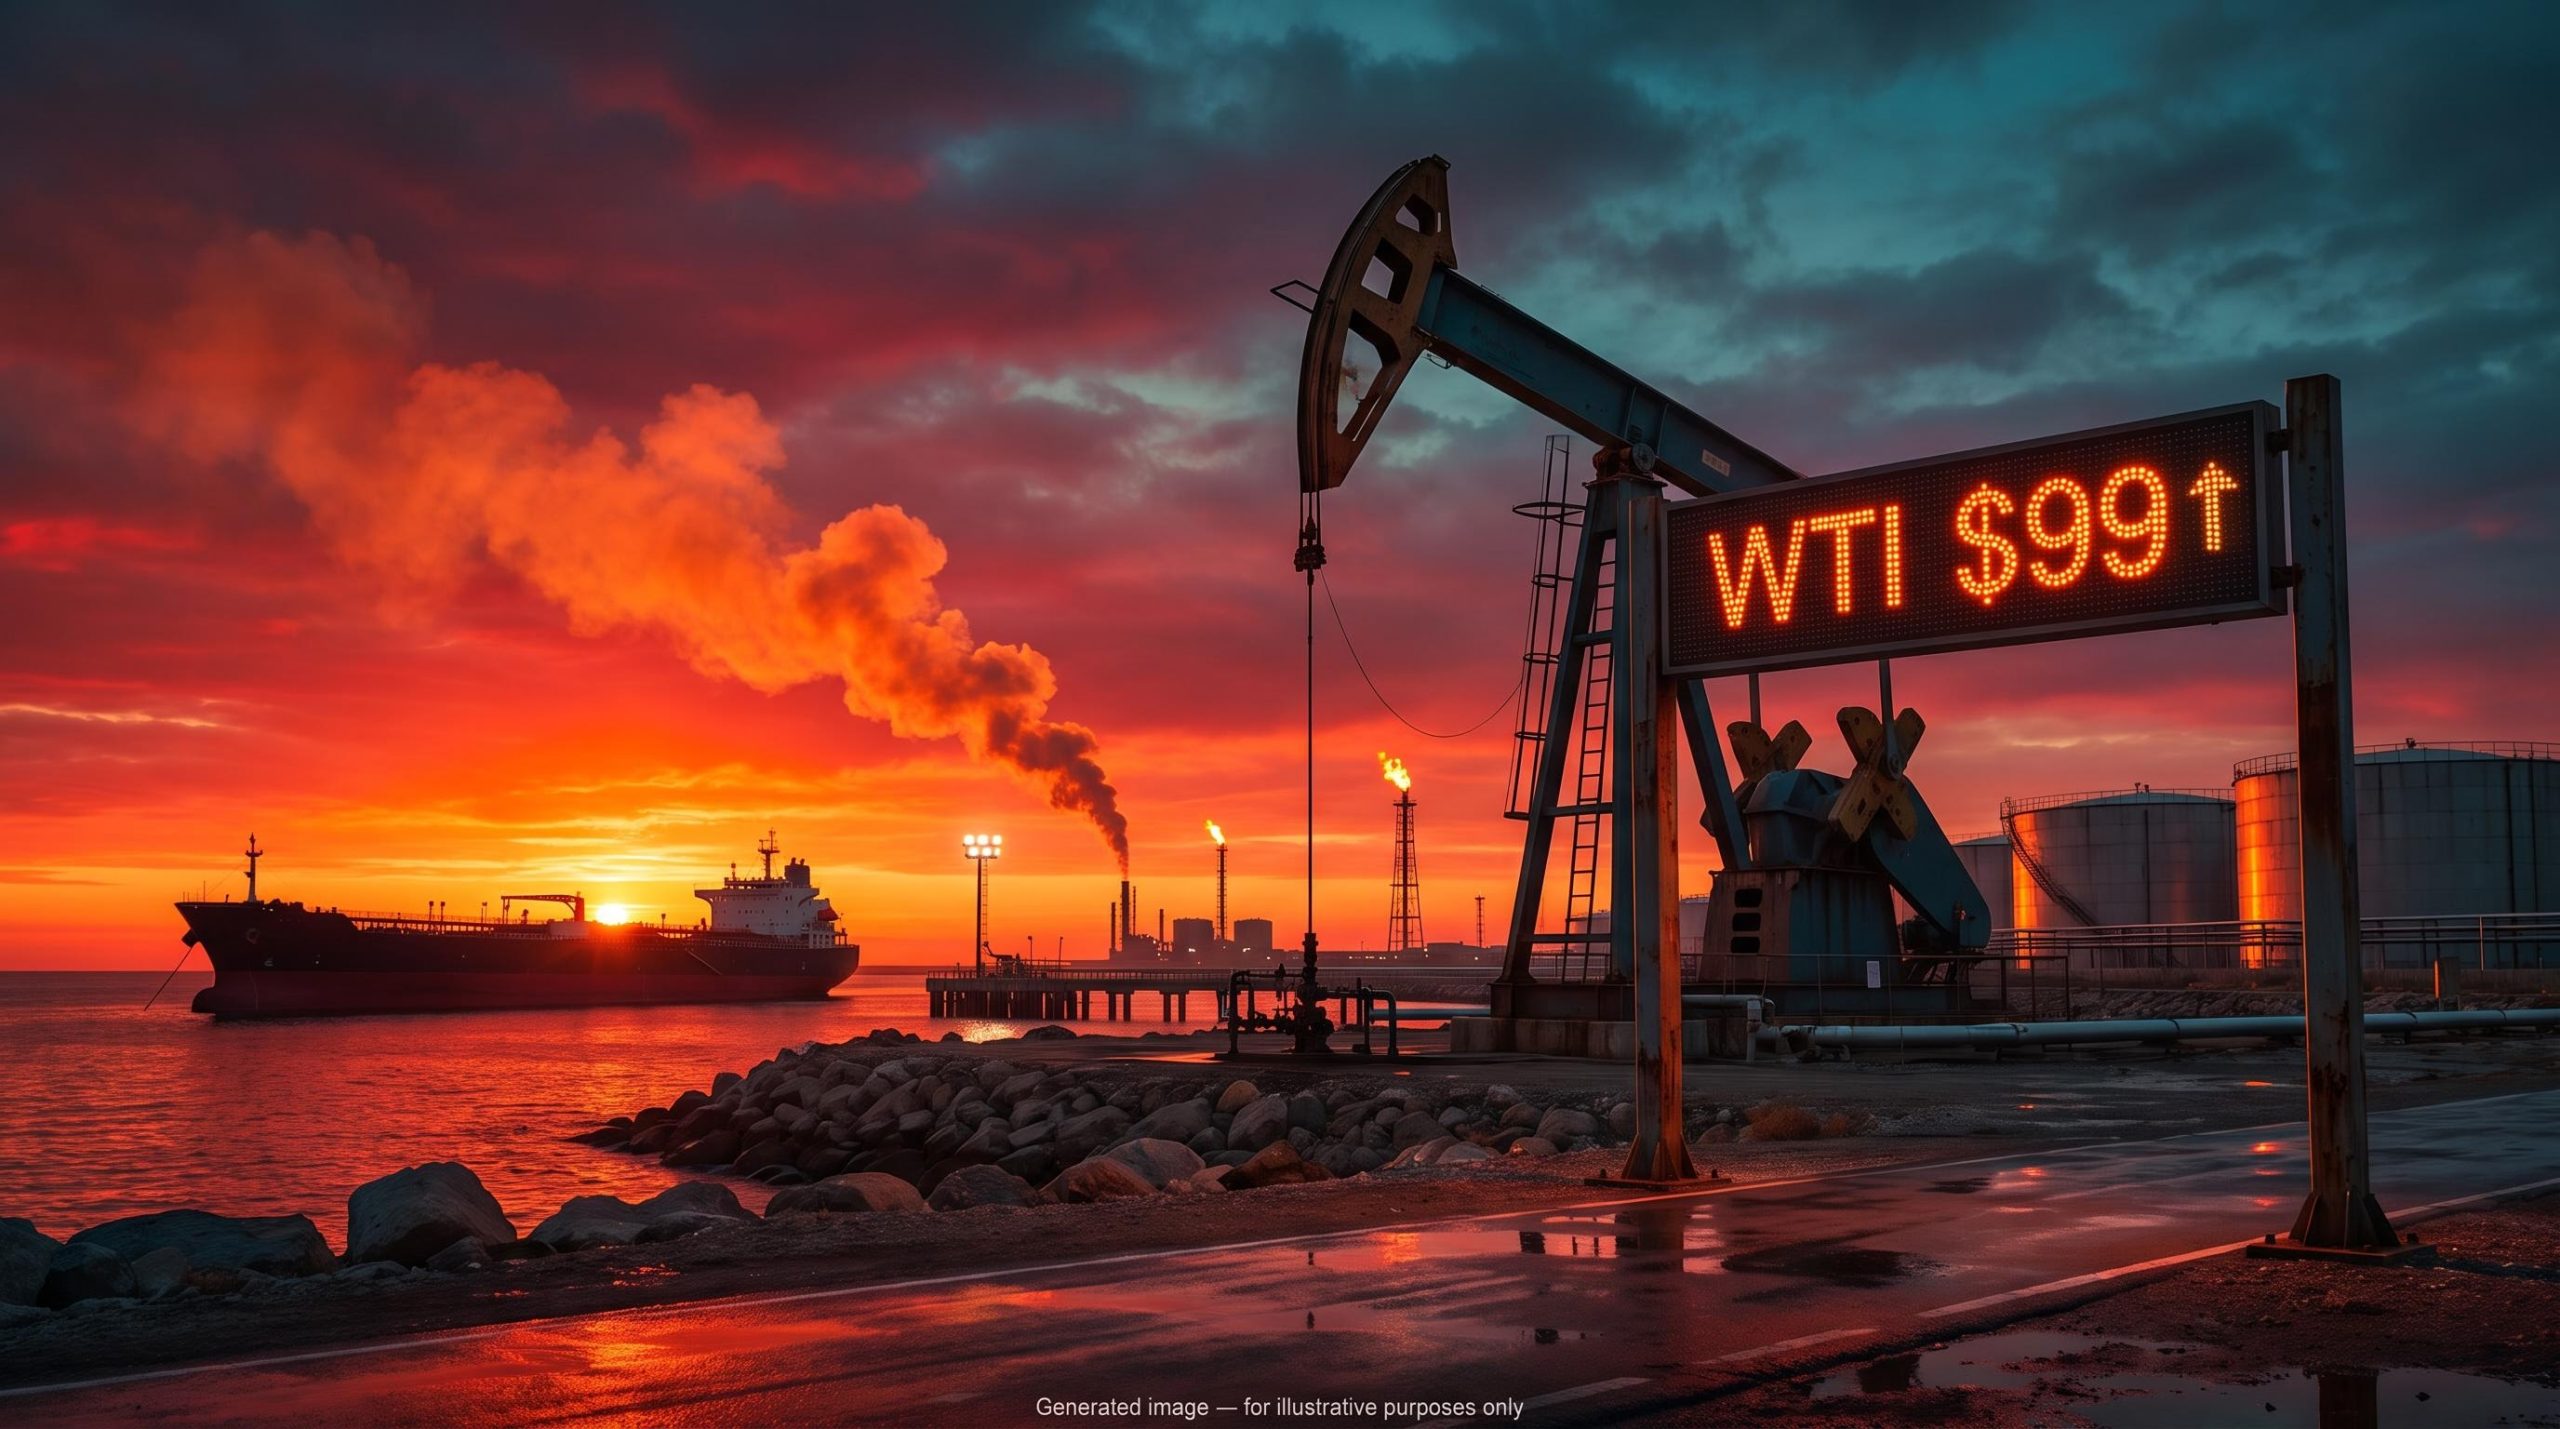
West Texas Intermediate (WTI) crude pushed to about $99 a barrel on Monday 19 October, on track for an eighth straight daily gain, after unconfirmed reports of new US strikes on Iran. Within hours, Yemen’s Houthis claimed hits on two Saudi energy sites, putting both of the Gulf’s main export routes under threat.
None of those claims had been confirmed by Monday. The market priced them anyway.
The two key figures in this story measure different things. The $99 level is Monday’s intraday price. The $101.41 figure is the previous Friday’s settlement, the official closing price.
Here is how to tell a durable move from a rumour-driven spike, and which three data releases this week will test the WTI crude oil price.
Is the rally built on verified supply loss or on rumour?
What has moved and what has not
WTI bottomed out at just over $96.50 on Monday before climbing to roughly $99.00 in a pair of quick pushes. The later push cleared the high set on Friday, taking the intraday high to its strongest level since 16 September. Friday’s $101.41 settlement, up $3.44, was itself the highest close since 17 September.
The timing caught traders off guard. President Trump said on 8 October that the US would not attack Iran before the 3 November midterm elections, so any strike report directly contradicts that statement.
The claims still awaiting confirmation
Here is where the evidence stands:
- Unconfirmed: reports of new US strikes on Iran. No official confirmation or denial was found.
- Unconfirmed: Houthi claims of hits on the Shaybah oilfield and an Aramco site at Yanbu. Saudi Arabia had not confirmed either claim.
- Reported: a Saudi-led coalition intercepted a ballistic missile aimed at Yanbu on 16 October. Rapidan Energy Group said initial reports showed no damage.
- Stated: Iran said it would allow only friendly countries through the Strait of Hormuz.
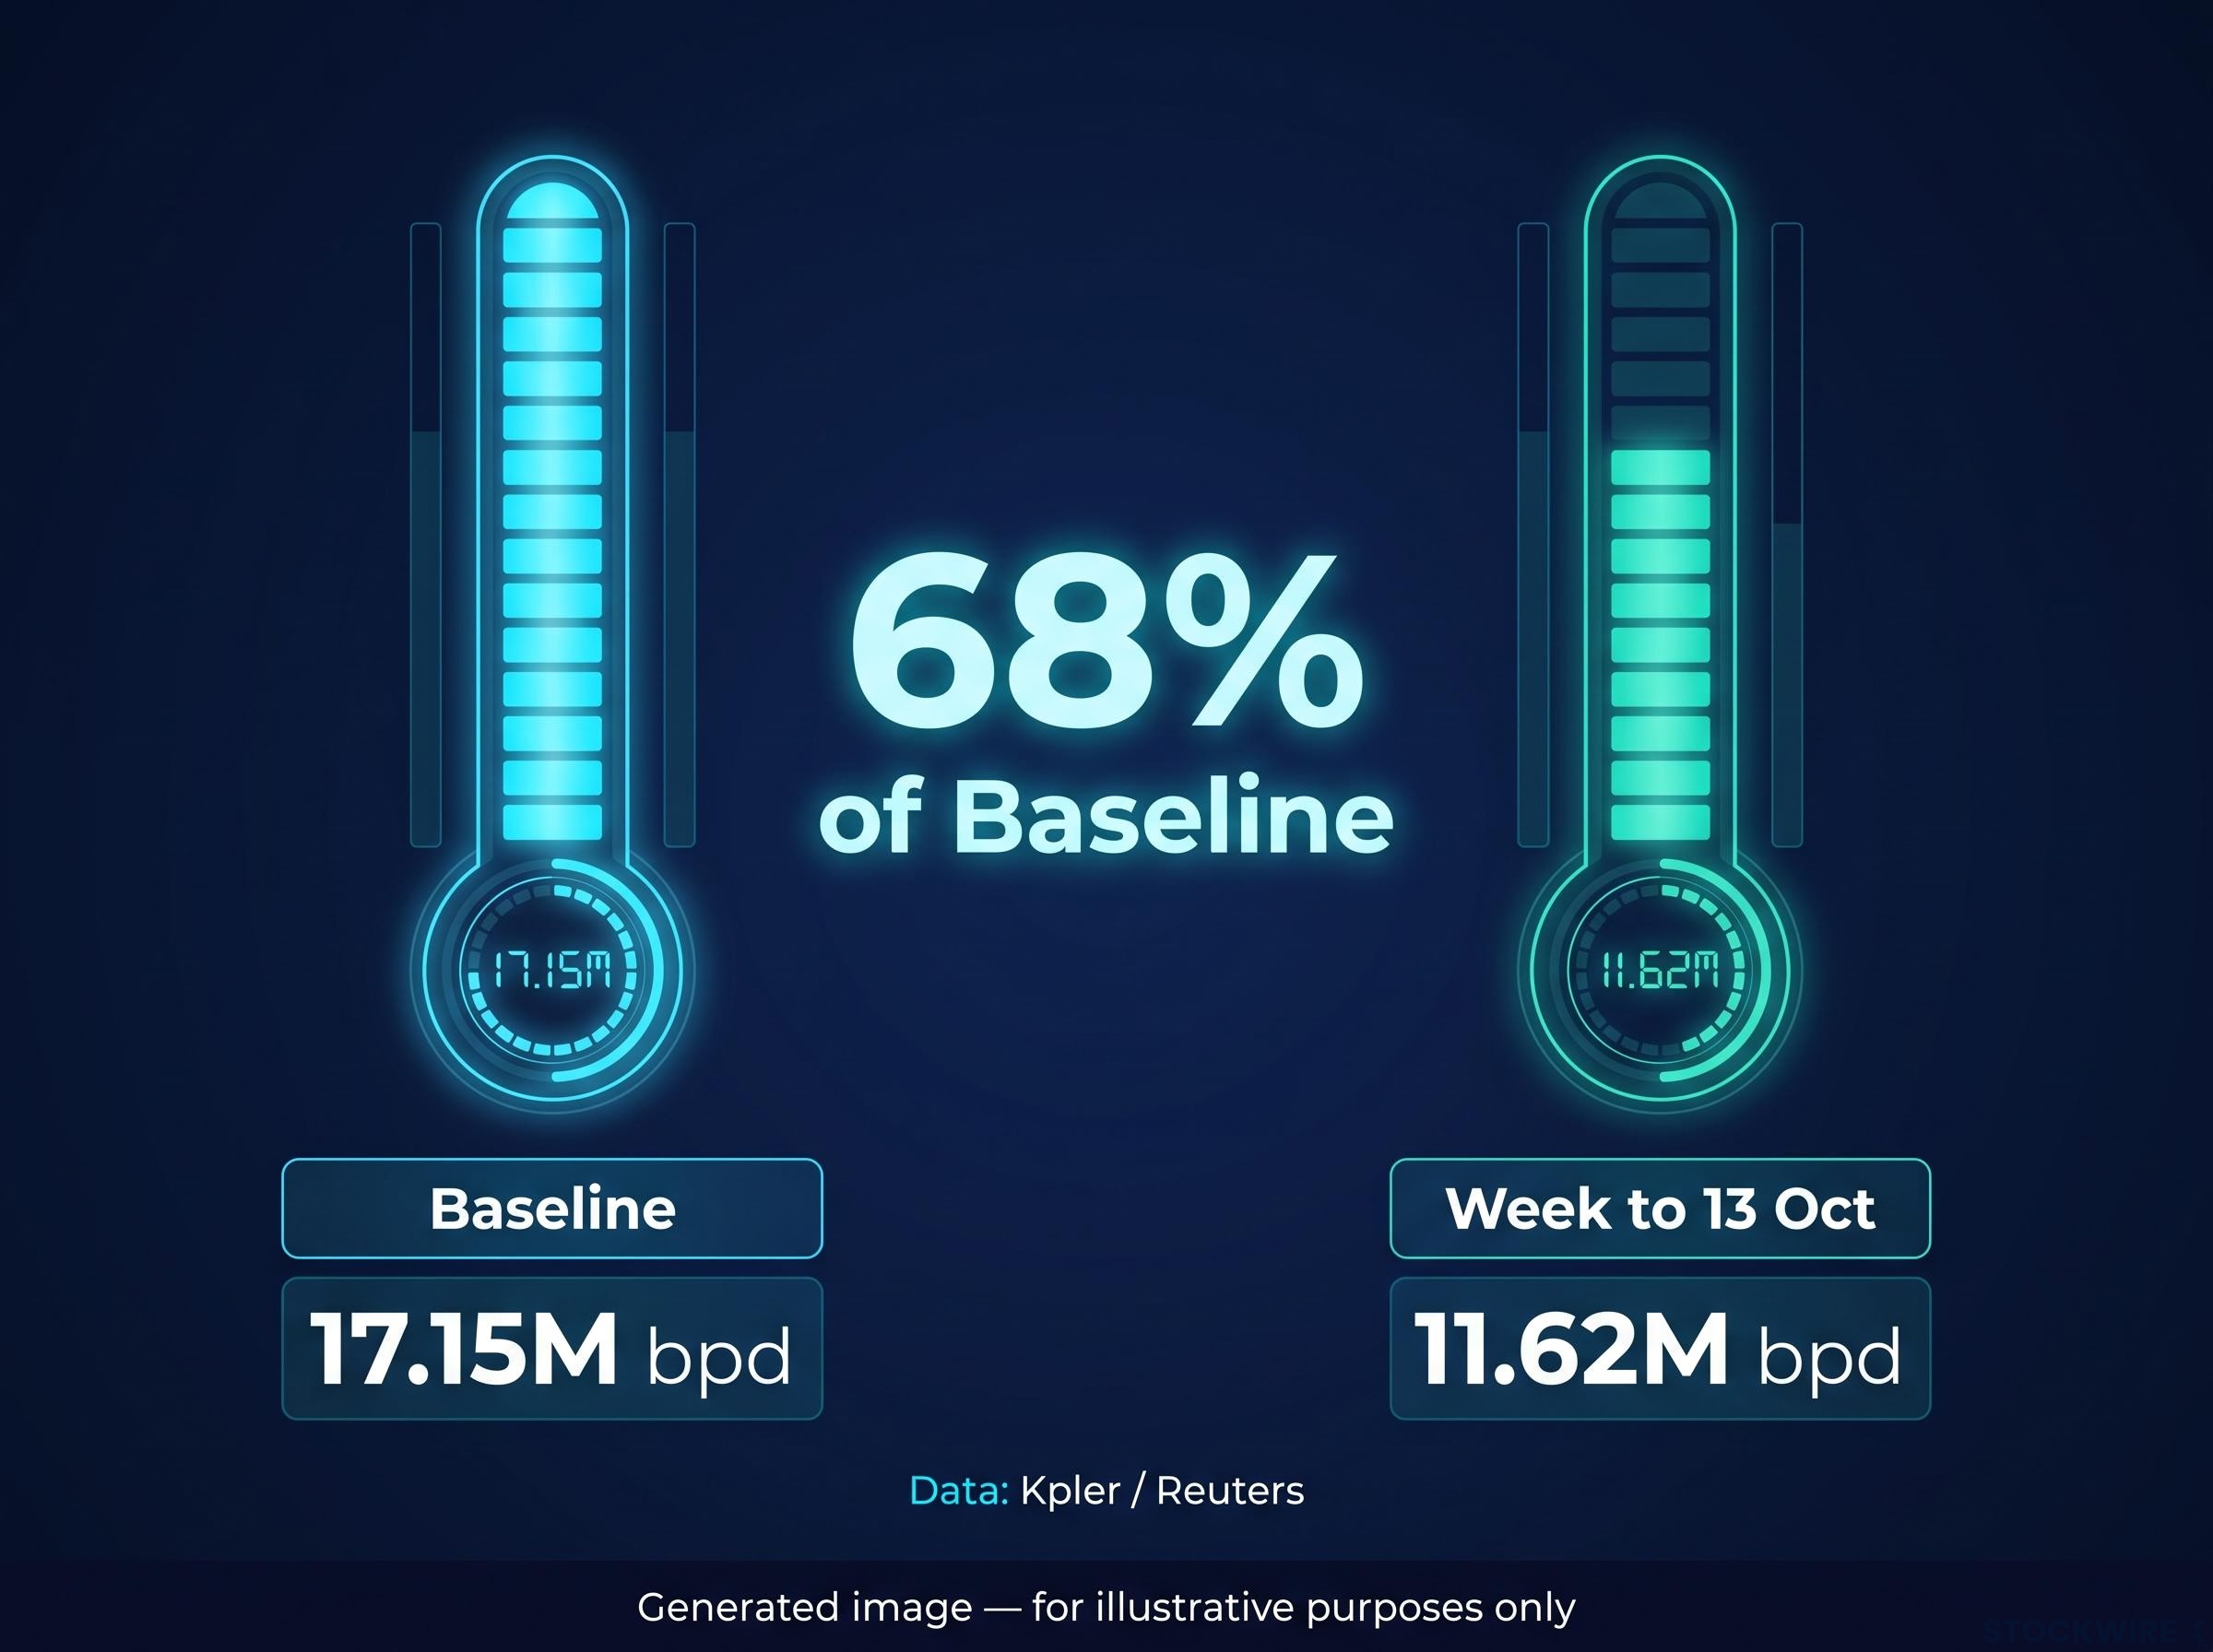
- Measured: Hormuz clearances averaged 11.62 million barrels per day (bpd) in the seven days to 13 October, about 68% of the 17.15 million bpd baseline, according to Kpler data reported by Reuters.
ING, 16 October: Uncertainty over the Middle East and over how long Hormuz flows can last has led the market to price in a “significant risk premium.”
A risk premium is the extra amount buyers pay to protect against a supply loss that has not yet happened. ING added that only a US-Iran agreement would give markets confidence that higher flows can persist. For you, that means the price is currently more exposed to headlines than to any physical shortage.
Analysts note that a significant risk premium tends to decompress slowly, because insurance withdrawal, tanker repositioning and supply chain repairs lag any diplomatic breakthrough by months.
When big ASX news breaks, our subscribers know first
Why Hormuz and Yanbu risk move crude more than headline barrels do
Why would an unconfirmed claim move prices this far? Because traders price routes as well as wells.
Deliverable supply versus produced supply
Crude that cannot reach a buyer does not count as supply. When tankers face attack, insurance, freight and rerouting costs climb, and some operators stay away entirely. Yanbu is the Red Sea terminus of the Saudi pipeline that lets crude avoid Hormuz. A threat to Yanbu therefore puts both the main route and its key alternative at risk.
The International Energy Agency’s (IEA) September Oil Market Report already linked a substantial cut in Saudi supply to attacks affecting Bab el-Mandeb shipping, the Jazan refinery, Yanbu-area shipping and Abqaiq.
What 2019 and 2022 suggest
| Episode | Supply at risk | Initial price reaction | Resolution |
|---|---|---|---|
| 2019 Abqaiq-Khurais | About 5.7 million bpd of Saudi output, temporarily | Brent up roughly 15%-18% | Output restored quickly; prices back near pre-attack levels within weeks |
| 2022 Russia-Ukraine | Feared persistent loss of Russian exports | Sharp surge | Shaped by sanctions, rerouting, reserve releases and replacement supply |
| 2026 Gulf episode | Hormuz and the Yanbu bypass | Larger than the roughly 14% spikes of 2019 and 2022 (Energy Intelligence) | Unresolved; key claims unconfirmed |
The lesson is that prices jump hardest when nobody can tell whether a disruption is temporary or lasting. When a headline threatens an export route rather than a single facility, expect a bigger, faster reaction, and expect it to fade quickly if flows resume.
What the API, EIA and Baker Hughes releases could change this week
Three releases arrive in order:
- American Petroleum Institute (API), Tuesday 20:30 GMT: the first read on whether crude and distillate stocks fell again.
- Energy Information Administration (EIA), Wednesday 14:30 GMT: the official figures, which confirm or revise API.
- Baker Hughes, Friday 17:00 GMT: the weekly count of active drilling rigs.
Reading API against EIA
| Measure | API (week to 9 Oct) | EIA (week to 9 Oct) | EIA level |
|---|---|---|---|
| Commercial crude | -11.1M bbl | -8.6M bbl | 415.6M bbl |
| Cushing crude | Not found | +1.862M bbl | 26.607M bbl |
| Gasoline | +1.623M bbl | +3.5M bbl | 208.3M bbl |
| Distillates | Declined, amount not found | -2.5M bbl | 102.6M bbl |
| Refinery utilisation | Not found | +0.8 pt | 93.5% |
API’s survey is voluntary and published a day earlier. EIA reporting is mandatory, so traders treat it as the authoritative revision. The two land within 1% of each other about 75% of the time.
Traders weigh the headline draw less than the gap to consensus, and the API and EIA data can also diverge on gasoline, Cushing and policy-driven reserve releases that change what a crude draw actually signals.
Last week’s surprise: A Reuters poll expected a crude draw of just 288,000 barrels. The EIA reported 8.6 million.
No reliable consensus forecast was found for the week ending 16 October. Watch distillates (diesel and heating oil) most closely. At 12% below the five-year average, tight stocks support diesel crack spreads, the margin refiners earn turning crude into diesel, which keeps refinery runs high. The EIA’s October outlook expects distillate stocks to stay below the 2021-2025 average.
A crude draw plus a distillate draw would strengthen the scarcity case. A crude or gasoline build would tell you the rally rests mainly on geopolitics.
Rigs and the stretch above the 50-day EMA
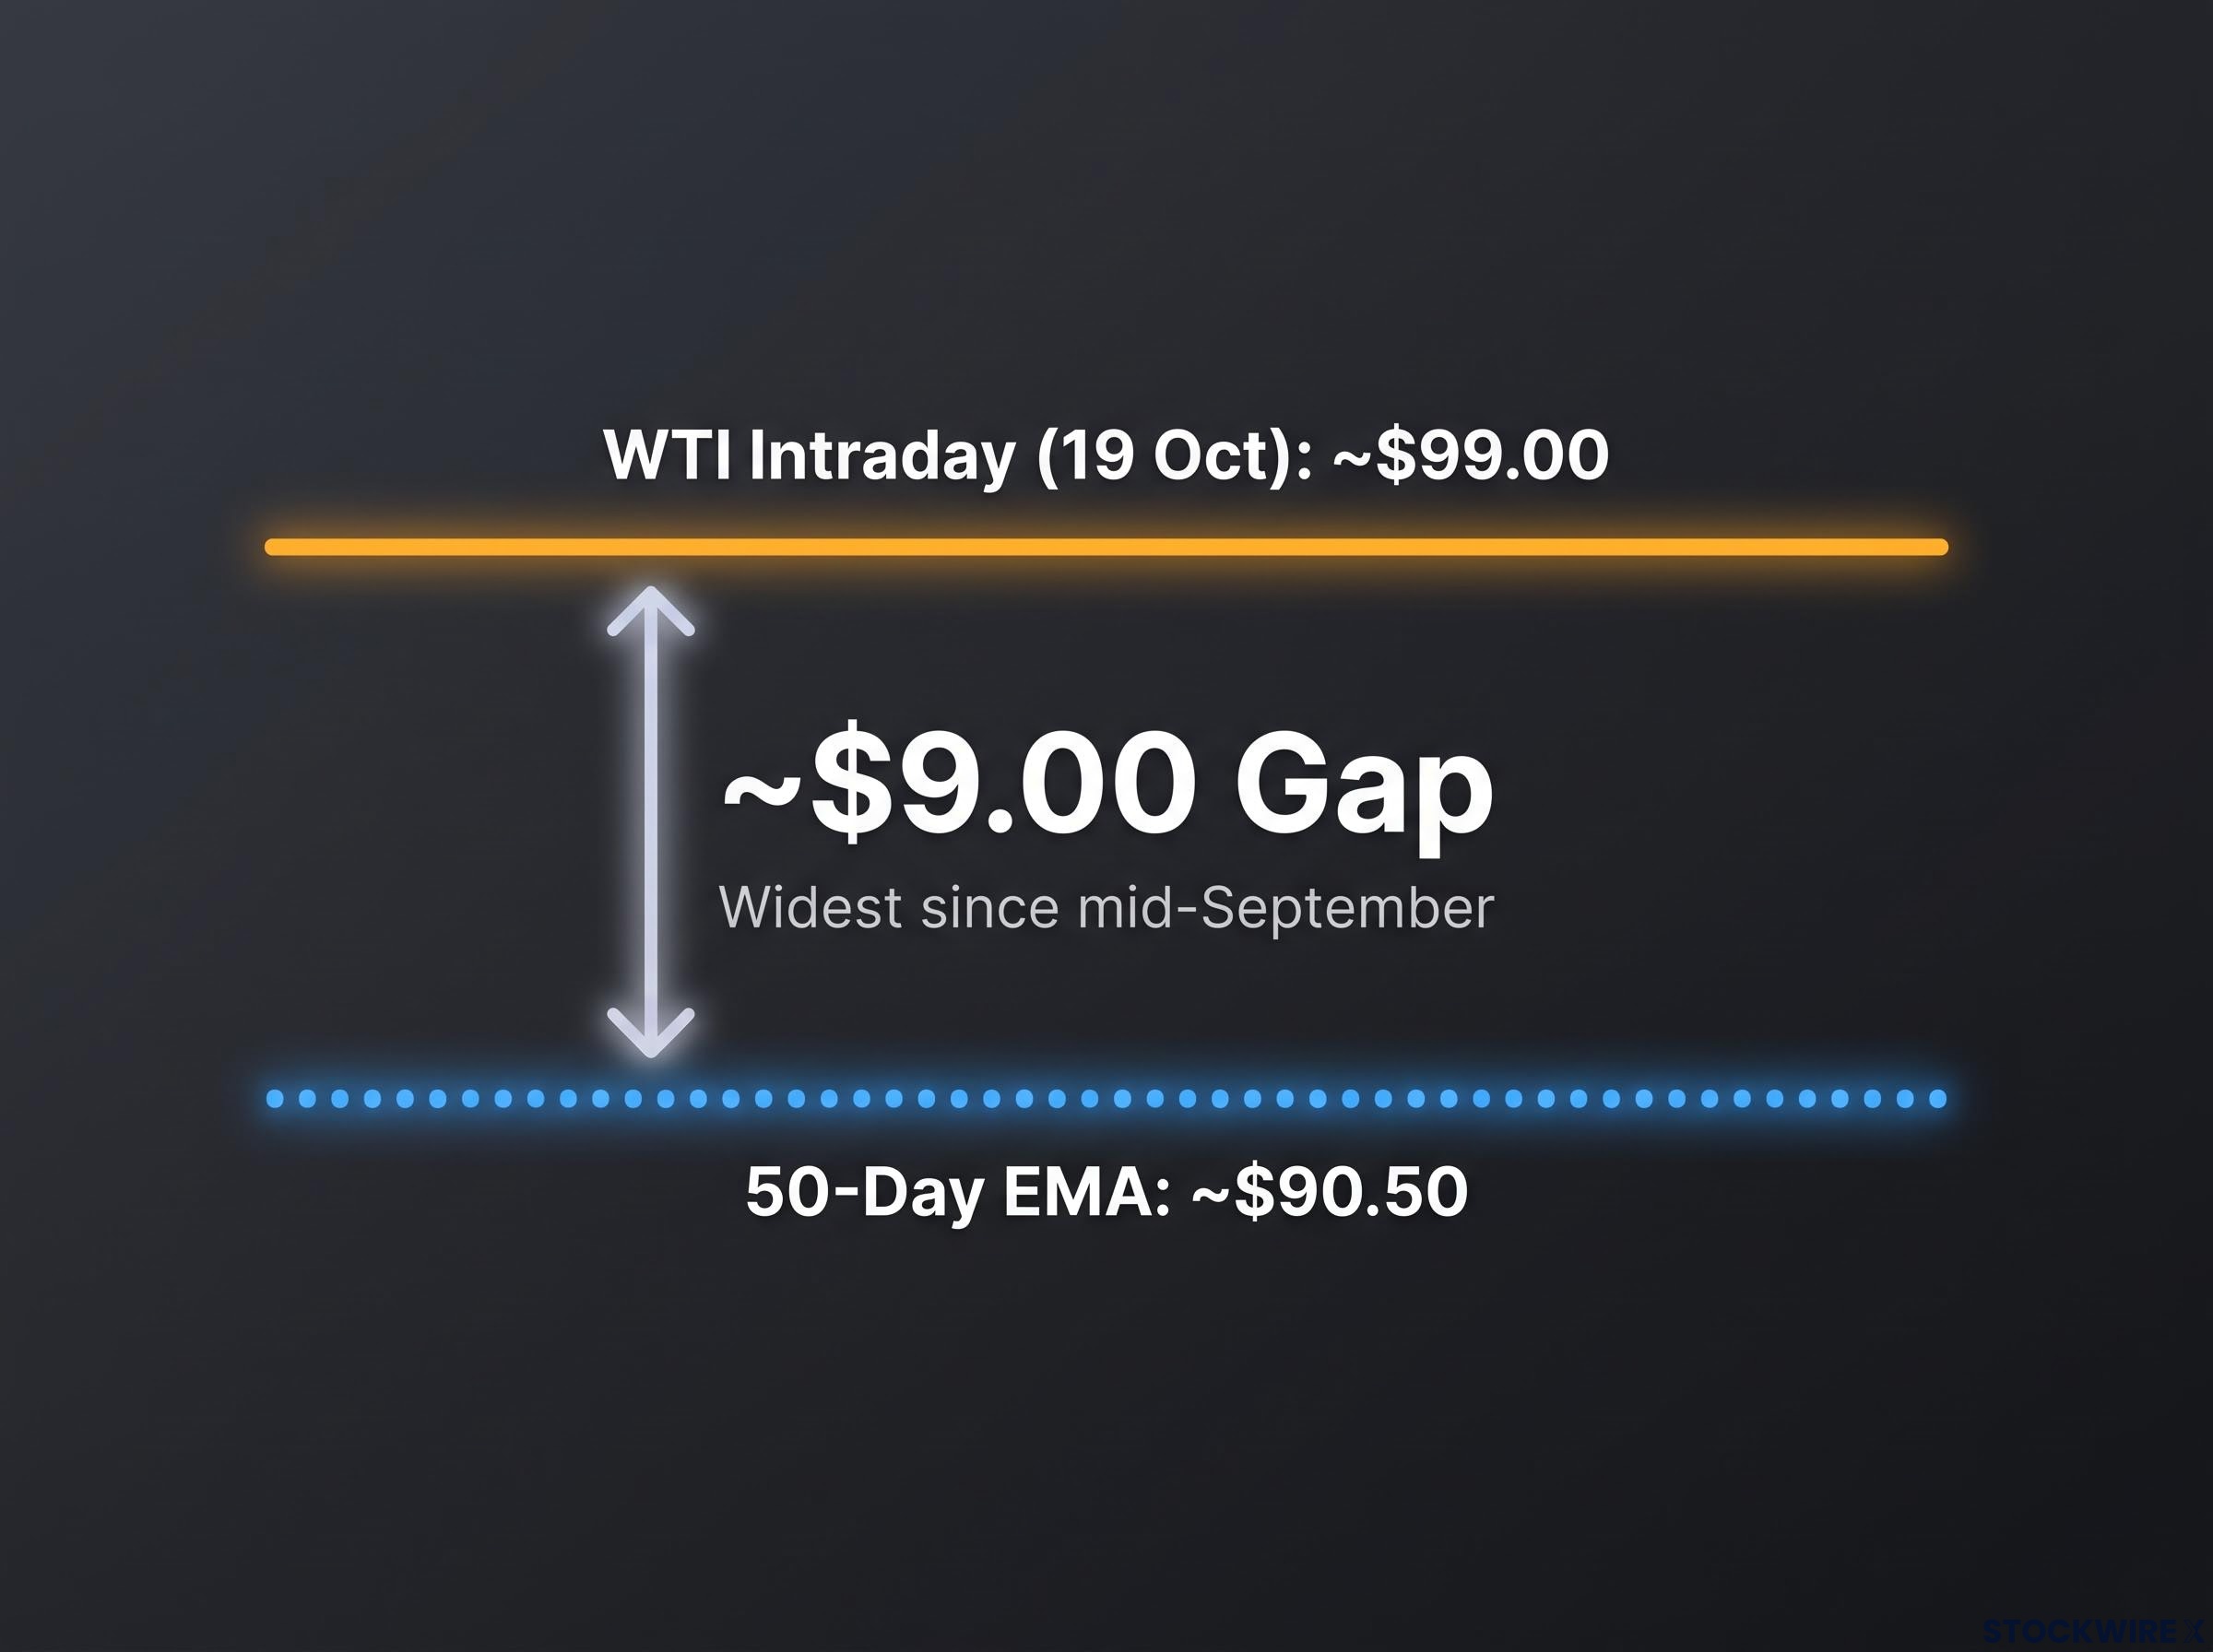
Oil rigs fell by 3 to 459 in the week to 16 October, with the total flat at 603. US drillers are not chasing higher prices. WTI also sits about $9.00 above its 50-day exponential moving average (EMA), a trend line weighted towards recent prices, now just under $90.50. That is the widest gap since mid-September.
What could unwind the rally before the next print
The bullish case has weight: eight straight gains, a climb from the mid-$90s towards $100, and falling crude and distillate stocks. UBS analyst Giovanni Staunovo said on 8 October that renewed vessel strikes beyond Hormuz had revived worries about transit volumes.
Yet the premium has clear exits.
What could remove the premium:
- A denial or collapse of the strike reports
- Profit-taking after overbought momentum
- Recovering Hormuz flows
- A US-Iran agreement, which ING sees as the condition for lasting confidence
- Rapid repairs, as seen in 2019, or strategic reserve releases
What could keep it:
- Confirmed damage to Yanbu or the East-West pipeline bypass
- Limited spare capacity and continued distillate tightness
- A slow rig response
Slower checks also exist. Sustained high prices can curb demand, and a 3.5 million barrel gasoline build shows not every product market is tight. Treat a move towards $100 without confirmed physical loss as vulnerable to a sharp pullback.
Geopolitical oil shocks produce lasting moves only when a physical barrel loss is prolonged, spare capacity is thin and policy signals point to escalation, which is why unconfirmed headlines often fade within a session.
What the next three prints will and will not settle
Right now, WTI is a verdict on route risk. Inventories and rigs decide whether it holds.
Watch for official confirmation or denial of the US strikes and the Saudi claims, Kpler’s Hormuz clearance data, Tuesday’s and Wednesday’s inventory numbers, distillate levels and Friday’s rig count. The data can confirm tightness, but only the geopolitical facts can justify the premium.
Confirmed physical losses would change the picture. A denial or a flow recovery would put the $9.00 gap above the 50-day EMA to the test.
This article is for informational purposes only and should not be considered financial advice. Investors should conduct their own research and consult with financial professionals before making investment decisions. Past performance does not guarantee future results, and forward-looking statements are speculative and subject to change.
—