President Trump says a Democratic win on 3 November means “an economic depression, much like 1929.” The options market, which prices fear in real money, has the Cboe Volatility Index (VIX) sitting near 15.8. Those two numbers cannot both describe the same future, and the gap between them is the most useful signal around the midterm elections and the stock market right now.
The vote is just over two weeks away, so you are weighing two questions at once. What does history say about stocks in a midterm year? And does the depression claim have any footing in what traders are actually paying for protection?
The second question matters more than it first appears. Prediction market Kalshi gives Democrats a 90% chance of winning the House, so the outcome Trump describes is not a remote scenario. It is the market’s base case.
Here is how to separate political rhetoric from what prices are actually saying, and which risks deserve your attention instead.
What does the historical record say about stocks in midterm years?
The pattern shows up quickly once the numbers sit side by side. Midterm years have been the weakest of the four-year presidential cycle, and the 12 months after the vote have been the strongest.
| Measure | Figure | Sample | Source |
|---|---|---|---|
| Average midterm-year return | 4.6% | Since 1954 | LPL Financial |
| Average midterm-year return | 4.7% | Since 1931 | Capital Group |
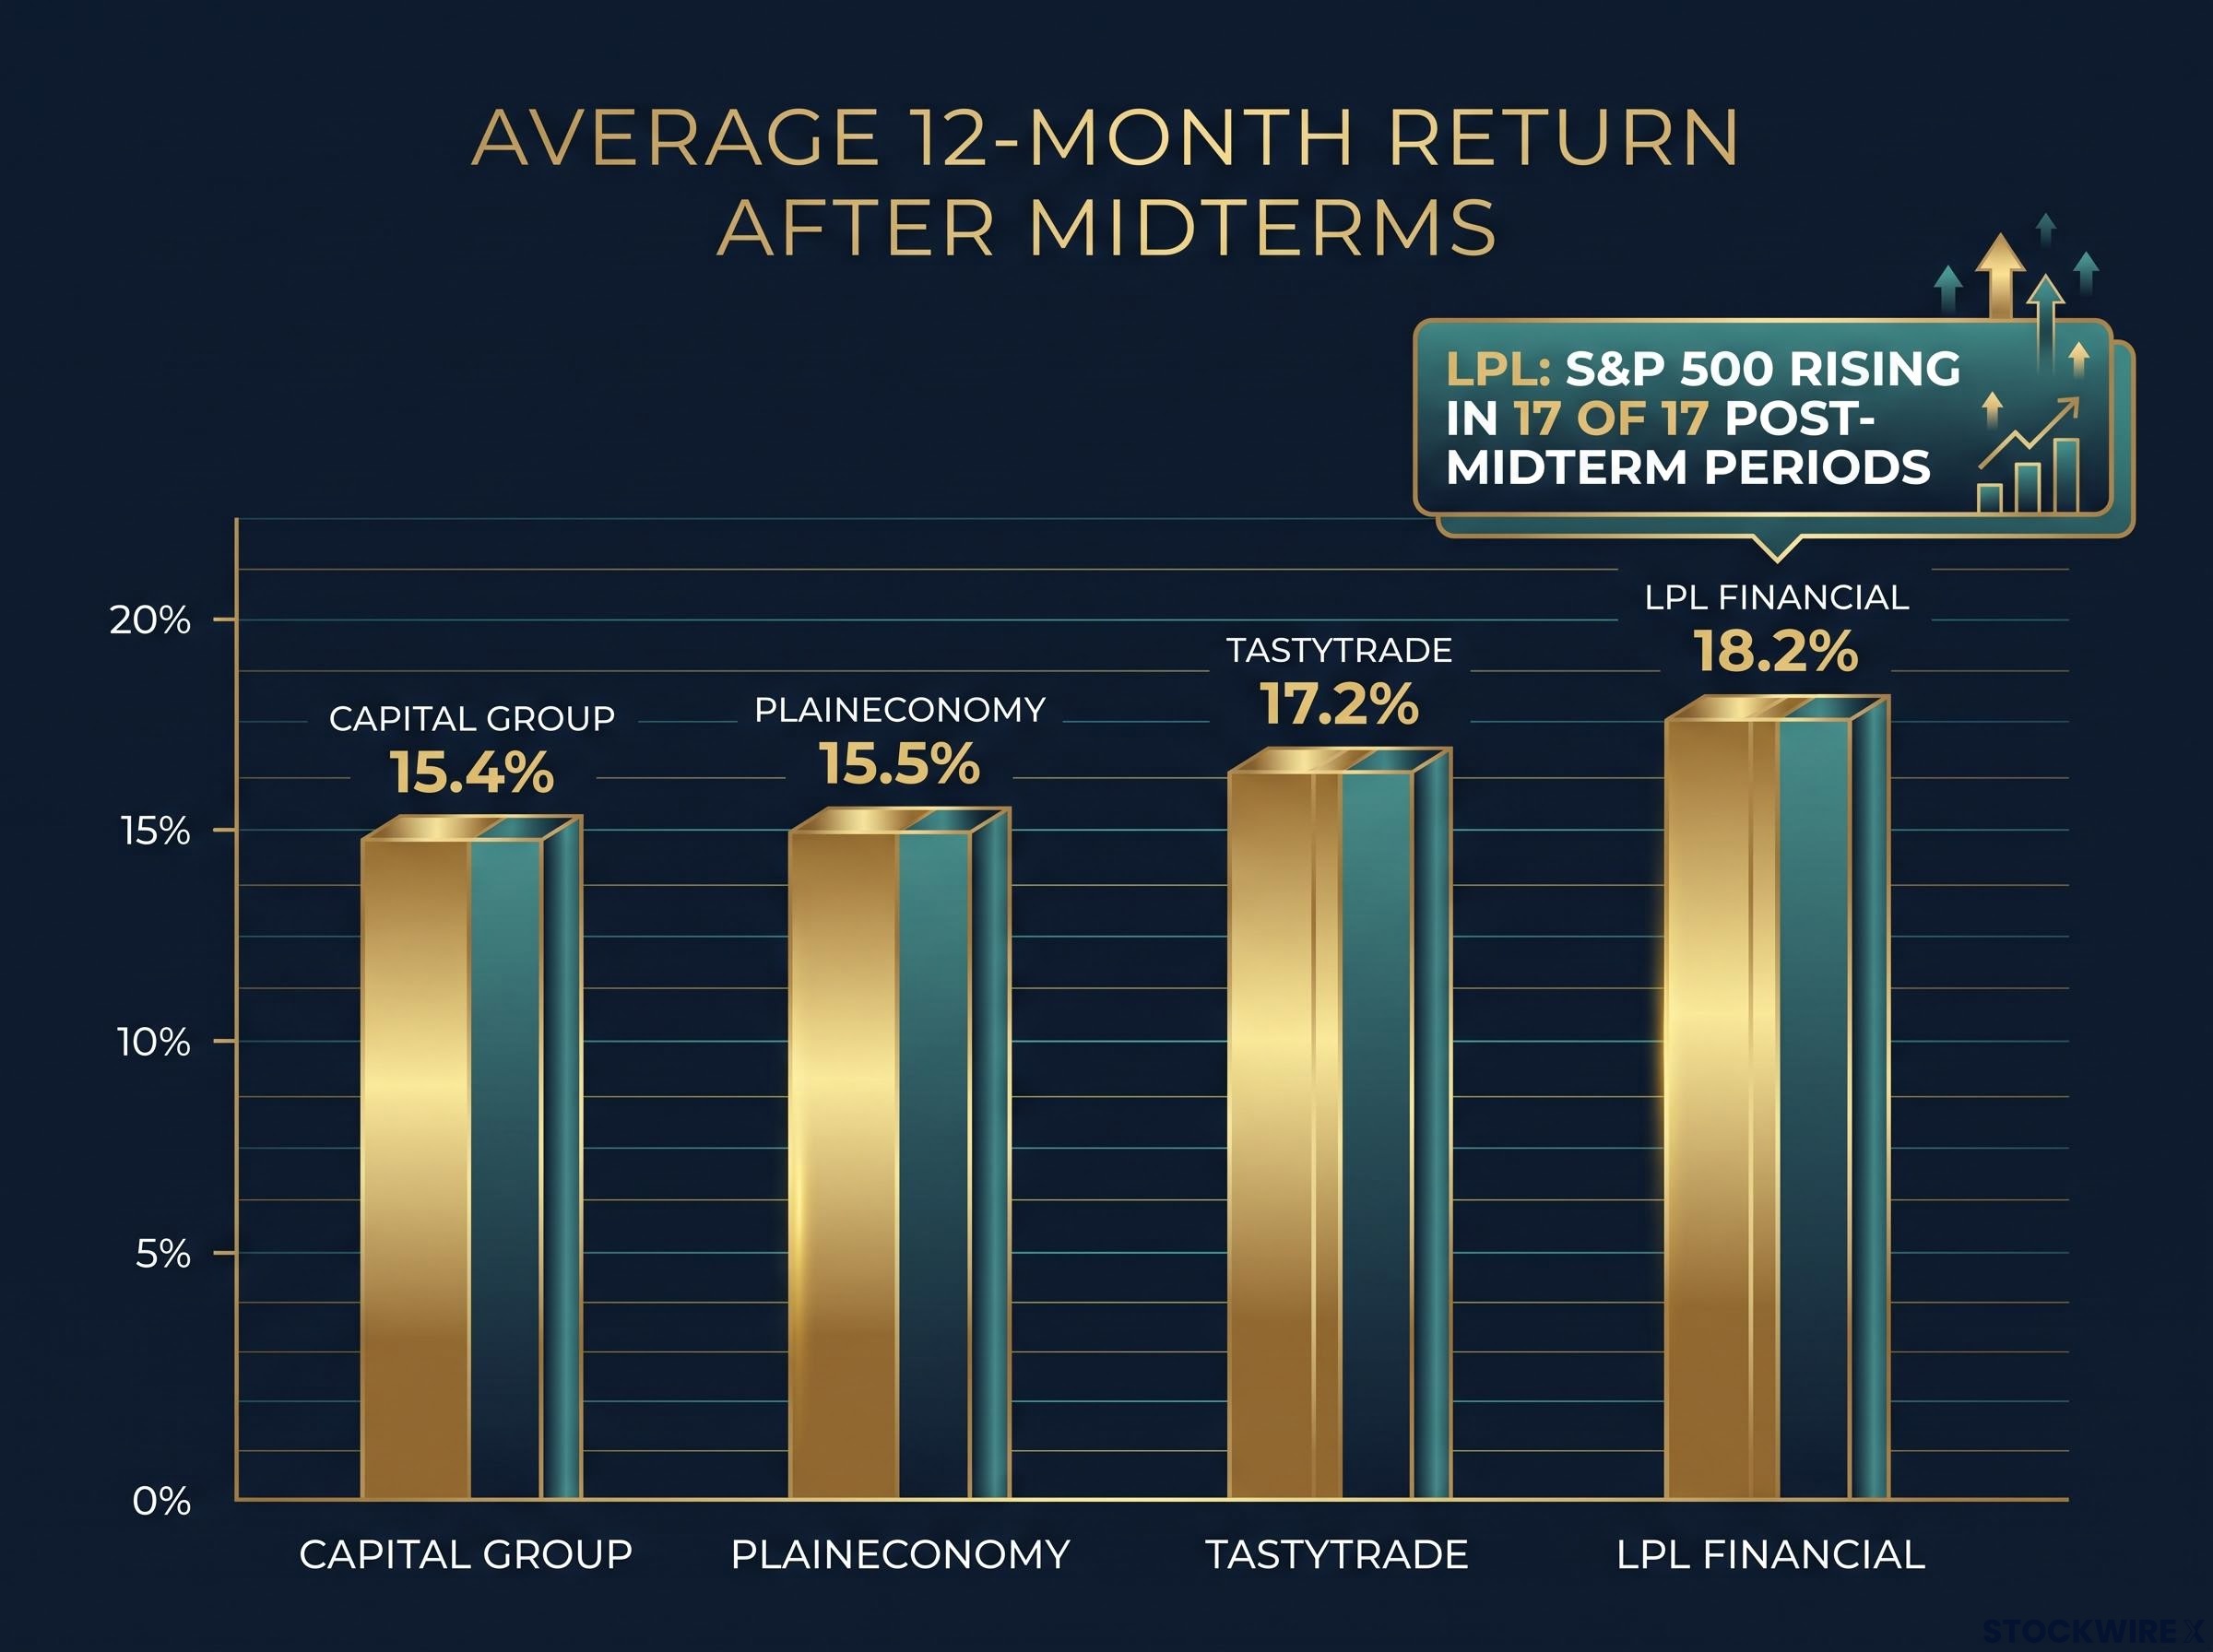
| Average 12-month return after midterms | 15.4% | Since 1950 | Capital Group |
| Average 12-month return after midterms | 18.2% | 17 elections since 1954 | LPL Financial |
| Average 12-month return after midterms | 15.5% | 19 elections since 1950 | PlainEconomy |
LPL’s data shows the S&P 500 rising in all 17 of 17 post-midterm periods, and tastytrade’s analysis puts the full year after a midterm at an average 17.2%, the best of the four cycle years. The figures shift with start date and return method, so treat the result as a range rather than a single number. No median figures were found either, which means a few outsized years could be lifting the averages.
Why the pattern may exist
- Peak uncertainty: investors do not know who will control Congress, and LPL commentary says markets tend to settle as Election Day nears.
- Cycle effect: Fidelity stresses the second-year weakness has not depended on which party wins.
- Policy clarity: once control is known, the odds of tax, spending and regulatory change become easier to judge.
- Fed and macro overlap: rate cuts, cooling inflation or recovering earnings may simply coincide with the rebound.
Why sceptics are not convinced
The sceptical reading holds that elections fall at a recurring point in the economic cycle, so the pattern may be coincidence dressed up as cause. The sample is small, and the two exceptions to midterm-period rallies, 1978 and 2018, were attributed to forces unrelated to the vote.
The three years that broke the midterm rally pattern since 1950 (1978, 2002 and 2018) were all macro stories driven by inflation, rate tightening or economic dislocation, not by the political outcome itself.
What this tells you is that the current stretch has historically been the choppy part of the cycle. It is a tendency worth knowing, not a guarantee worth trading on.
When big ASX news breaks, our subscribers know first
Does gridlock matter more than which party wins Congress?
Most voters assume the winning party sets the direction for stocks. The historical split suggests otherwise.
The weakest combination in tastytrade’s data was a Republican president with a Democratic Congress, producing annual returns below 5%. That figure is likely where the “Democrats hurt stocks” argument comes from, and it happens to match the setup a Democratic House win would create in November.
Yet the strongest two pairings were both divided-Congress setups, one with a Democrat in the White House and the other with a Republican. Since strong returns appeared whichever party held the presidency, party on its own does not account for them. What they share is that neither side could legislate much without the other.
Where the datasets disagree
Capital Group’s analysis since 1933 muddies the picture further. It found double-digit average returns under unified government, a split Congress and a Congress controlled by the president’s opposing party, and it explicitly warns against reading causation into any of it.
That last category directly conflicts with the sub-5% finding. The two studies use different samples and definitions, and the discrepancy remains unresolved.
Several limits explain why the evidence is so slippery:
- Few midterms, and even fewer observations in each control category
- Returns also reflect valuations, earnings, inflation, wars, recessions and Federal Reserve policy
- Causality runs both ways, since the economy shapes elections as much as elections shape it
- A handful of extreme years can dominate an average
The defensible conclusion: Divided government has coincided with favourable returns in some samples. The evidence does not show that it causes them.
For you, this means a bet on the November result alone is a weak foundation for portfolio decisions. The data simply cannot isolate party or gridlock from everything else moving markets.
How does options pricing test the depression claim?
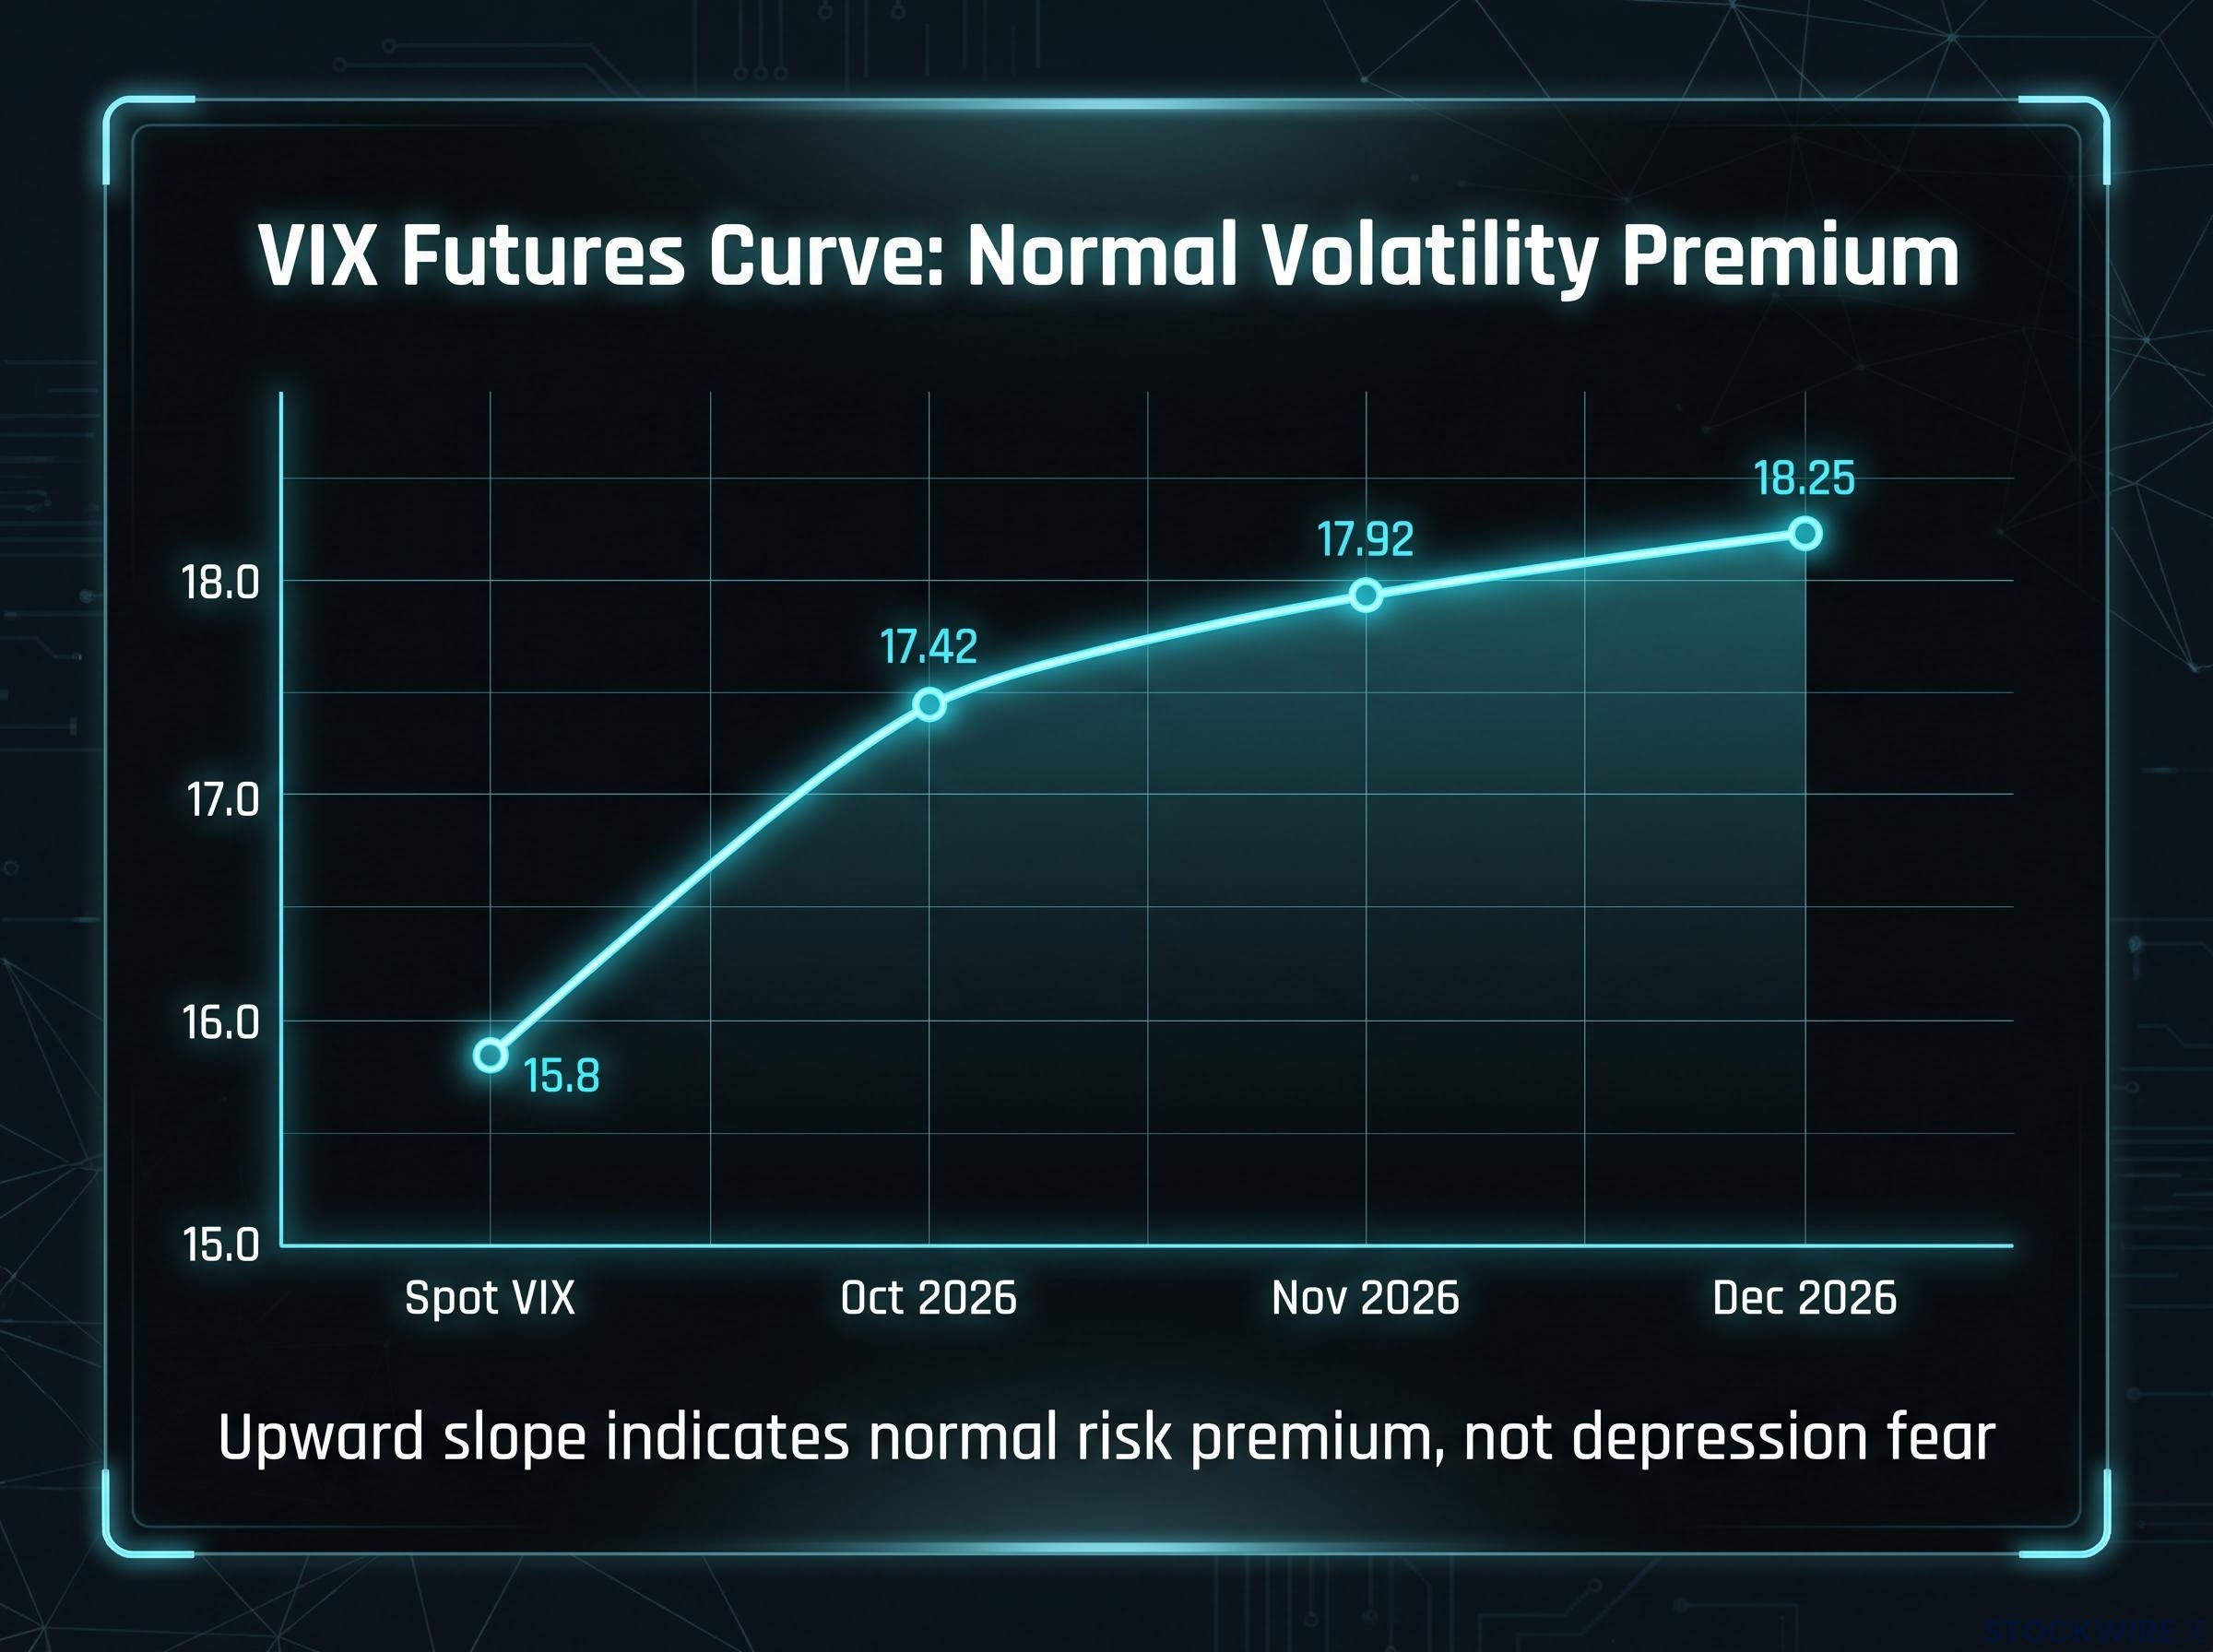
If history cannot settle the question, live prices offer a sharper test. Open a volatility screen today and you would see the VIX near 16 and a futures curve sloping gently upward.
The VIX measures implied volatility, meaning the size of price swings that S&P 500 option prices suggest over roughly the next 30 days. It is calculated on a risk-neutral basis, so it reflects what hedging costs rather than a direct probability of a crash.
Reading the VIX and the curve
| Instrument | Level | Expiry | What it signals |
|---|---|---|---|
| Spot VIX | ~15.8 | Rolling 30 days | Moderate near-term volatility |
| October VIX future | 17.42 | 21 October 2026 | Slightly higher expected volatility |
| November VIX future | 17.92 | 18 November 2026 | Spans the election, no spike |
| December VIX future | 18.25 | 16 December 2026 | Gradual rise, normal risk premium |
That upward slope is called contango, where later contracts price above nearer ones. It usually signals a normal volatility premium, whereas backwardation, with near-term contracts priced highest, tends to appear during an immediate shock. Readings for the October contract vary by source (17.42 per MenthorQ on 15 October, about 16.80 cited by tastytrade, and about 19.91 intraday on 17 October), but the differences reflect timing and do not change the shape.
The shape of the VIX futures curve matters more than the spot number, because contango signals a normal hedging premium while backwardation has marked genuine shocks, with the COVID crash producing roughly 15 points of inversion.
What a 10% or 20% drop would look like
tastytrade defined a depression as a 20% fall in the S&P 500. From its reference level near 7,803:
- A 10% fall is about 780 points, to roughly 7,000
- A 20% fall is about 1,560 points, to roughly 6,200
An expected move is the one-standard-deviation range options imply, calculated as index level × implied volatility × √(days/365). With January implied volatility about 18, that range is about 423 points, a little over 5% either way.
Magnitude, not direction: An expected move tells you how far the market might travel. It does not tell you which way.
A 10% decline toward 7,300 sits at the low end of the January range, so a sizeable pullback is not unusual. A depression-scale move only appears near the 1,200-point expected move for January 2028. Protection is pricey too: a January put near 6,300 costs around $15,000, with breakeven near 6,100.
What options cannot tell you
Options cannot reliably time or size a crash. Put skew, the extra cost of downside protection, reflects dealer positioning as well as fear. Unverified historical accounts suggest volatility was calm before the sudden 1987 collapse.
What the pricing tells you is that professional hedgers see ordinary event risk, not a depression. Use that to sharpen your scepticism, not to replace caution with certainty.
What does Trump’s claim actually rest on, and what are the real market risks?
The claim itself is specific. In a Truth Social video posted on 3 October 2026, Trump warned of a “1929 disaster” under Democratic control and promised $5,000 to every adult citizen if Republicans won both chambers.
Later reporting cited Trump’s own estimate of about $1 trillion for the payments, tied to tariff revenue. No legislation, funding mechanism or payment schedule has been published, and Congress would need to authorise it. Tariffs are also paid first by importers, and revenue could shrink if import volumes fall.
The $5,000 tariff dividend proposal would cost about $1.2 trillion against net retained tariff revenue well under $200 billion, so most of the bill would be deficit-financed rather than paid from receipts.
The claim versus 1929
The Great Depression grew out of financial leverage, bank failures, monetary contraction, collapsing demand and trade disruption. A shift in House control does not operate through any comparable mechanism.
Meanwhile, forecasters already treat a Democratic House as likely:
| Forecaster | House (Democrats) | Senate (Democrats) | Date |
|---|---|---|---|
| Kalshi | 90% | 63% | 16 October |
| Polymarket | 91% | 64% | 9-17 October |
| Poliwave | 83% | 61% | 14-18 October |
| Call the Map | 81% | 55% | 13 October |
Polymarket puts a Democratic sweep at 63%, and the Cook Political Report rates 214 House seats solid, likely or lean Democratic, with 21 toss-ups.
Risks that do not depend on the winner
A market pricing a probable Democratic House while holding volatility near 16 is treating the depression claim as political framing. The risks worth watching cut across party lines:
- Tariffs and retaliation, which could lift input costs and inflation while hitting exports
- Deficits and long-term yields, which could stay elevated under fiscal expansion
- Shutdown or investigation risk under a Democratic House or Senate
- Inflation and borrowing pressure from a large unfunded transfer such as the proposed payments
Economist Peter Schiff has reportedly argued that any downturn could arrive regardless of party, though that view has not been independently confirmed.
What the data supports, and what it does not
Midterm years have been weak and the following year strong, but the sample is small and heavily confounded. Gridlock has coincided with good returns without being shown to cause them. Options show moderate volatility and no priced-in depression, though tail risk never disappears.
Into and after 3 November, three signals are worth watching:
- Whether the VIX curve flattens or flips into backwardation
- How the October contract settles at expiry on 21 October
- New tariff or deficit developments, whichever party wins
The next time a political claim promises boom or bust, check the options screen before acting on it.
Past performance does not guarantee future results. Financial projections are subject to market conditions and various risk factors. These statements are speculative and subject to change based on market developments.
This article is for informational purposes only and should not be considered financial advice. Investors should conduct their own research and consult with financial professionals before making investment decisions.
—