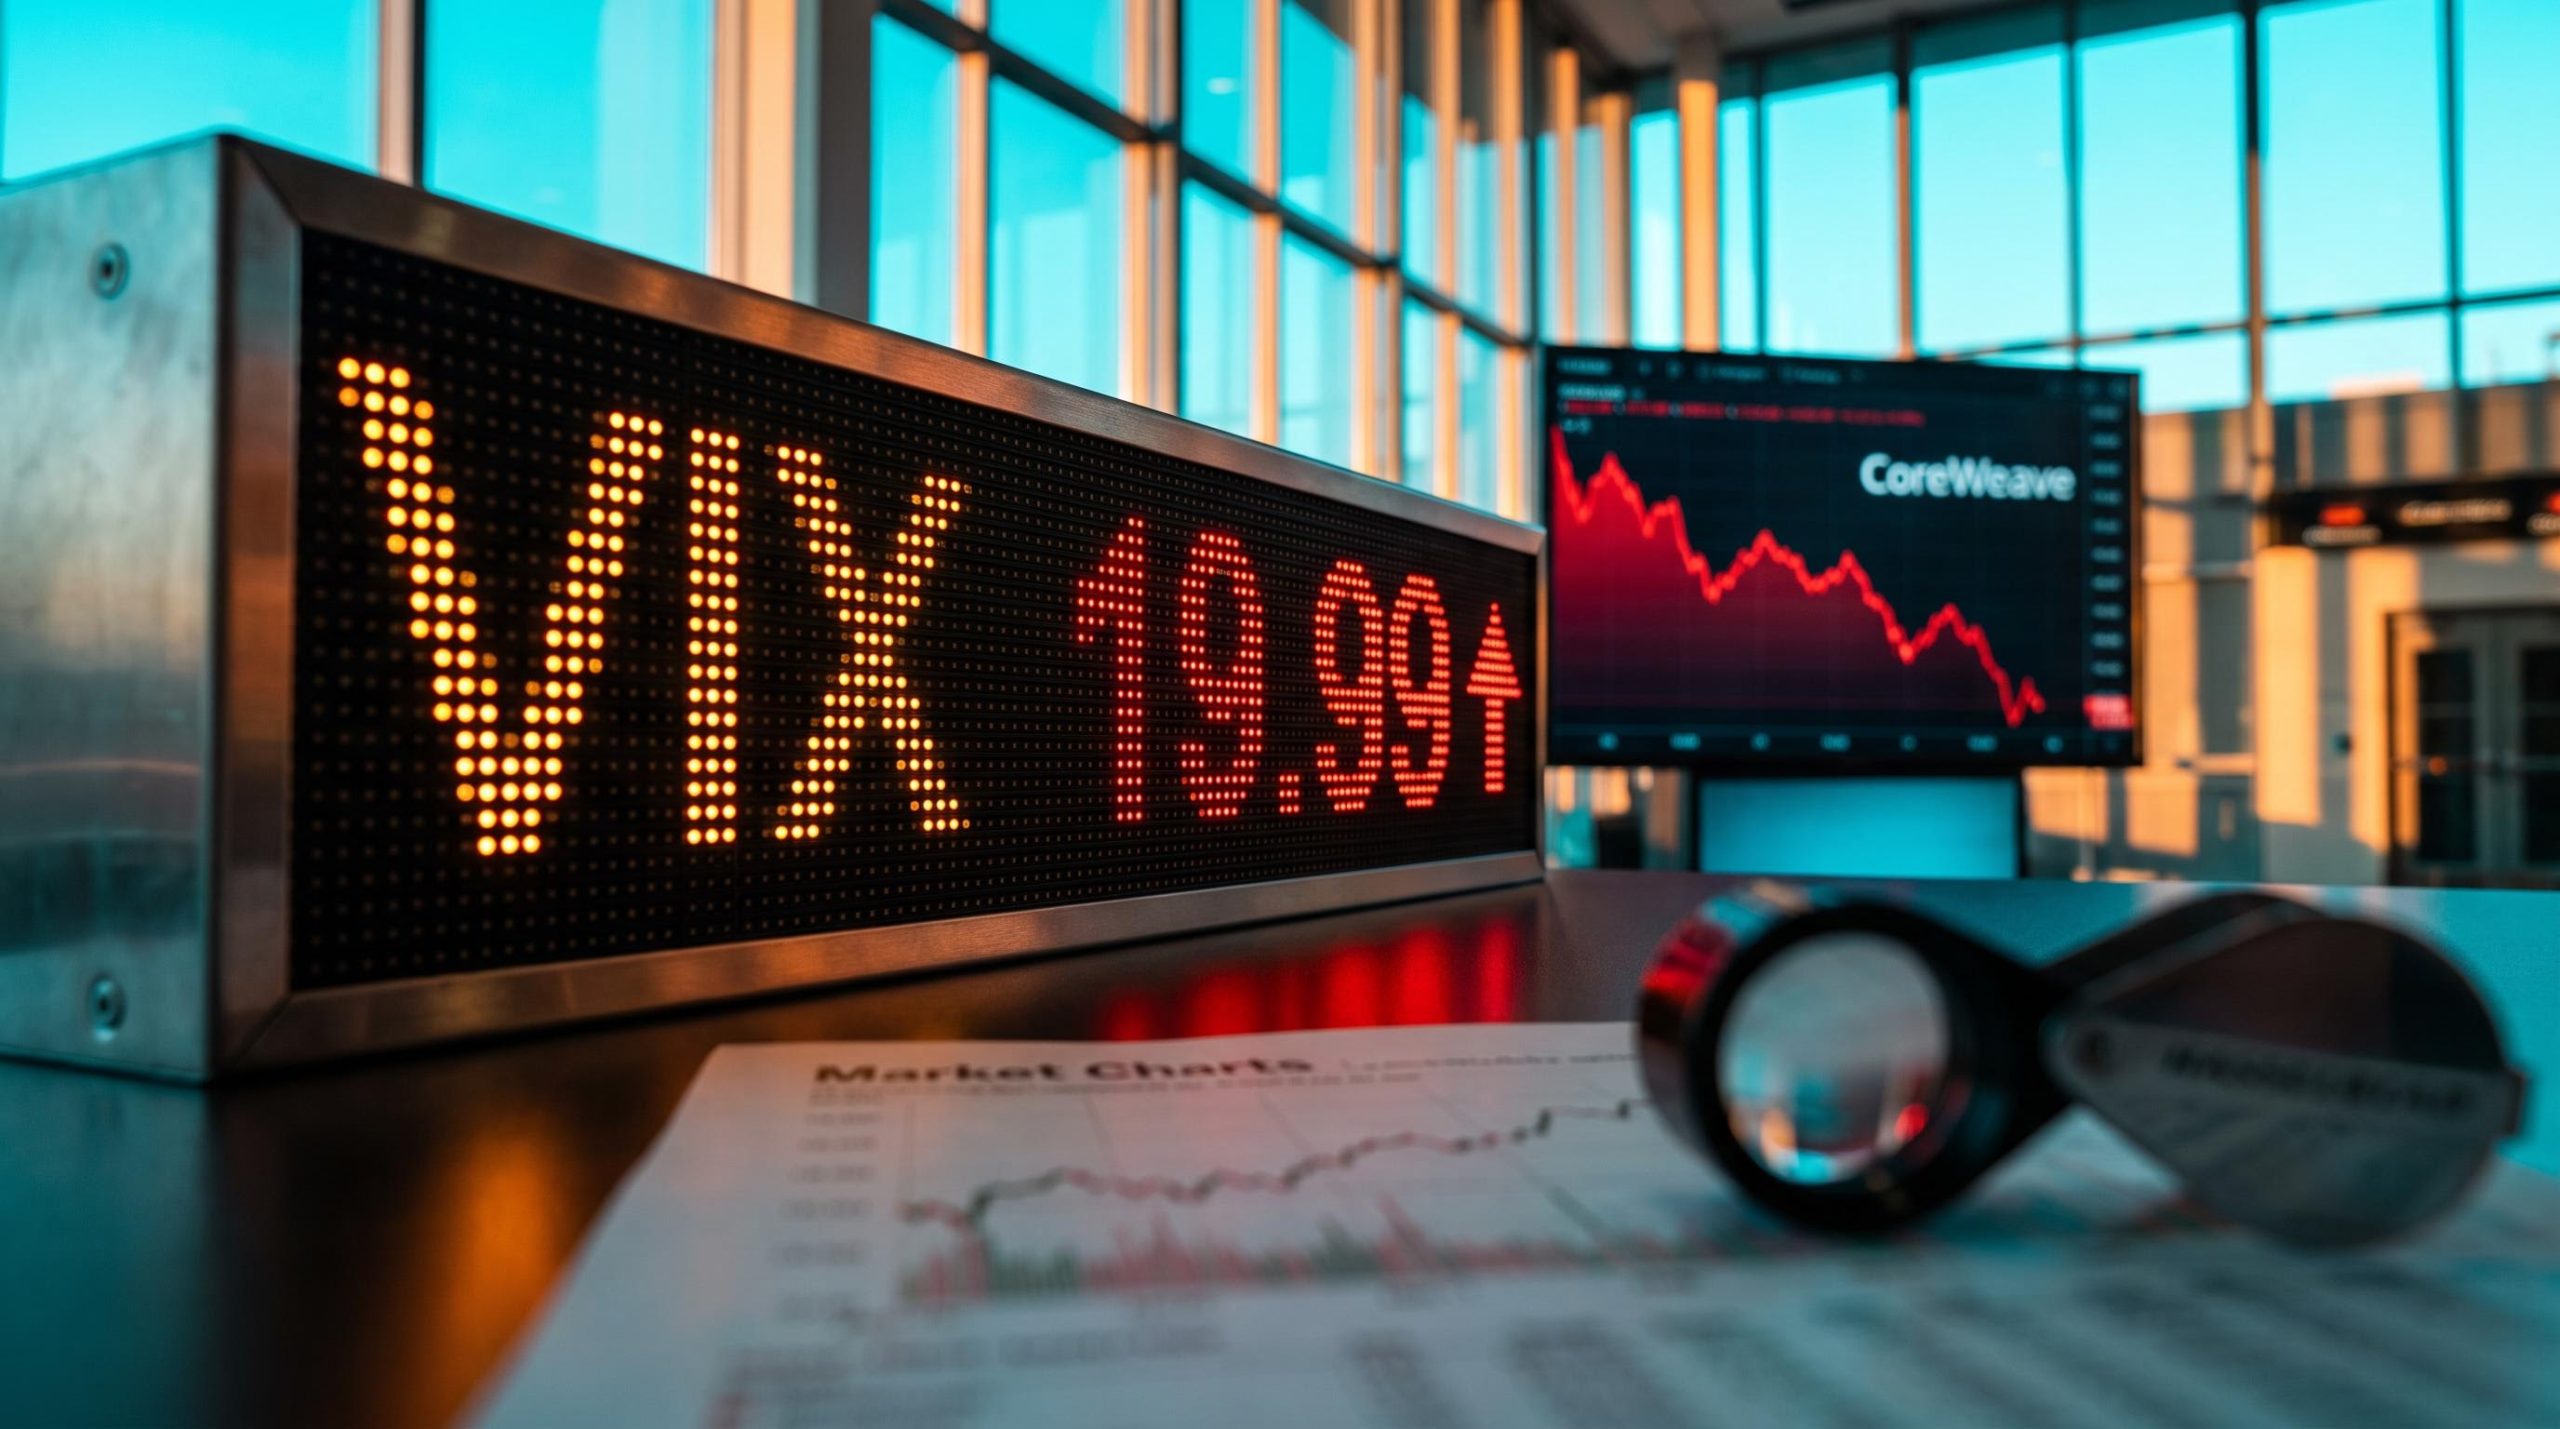
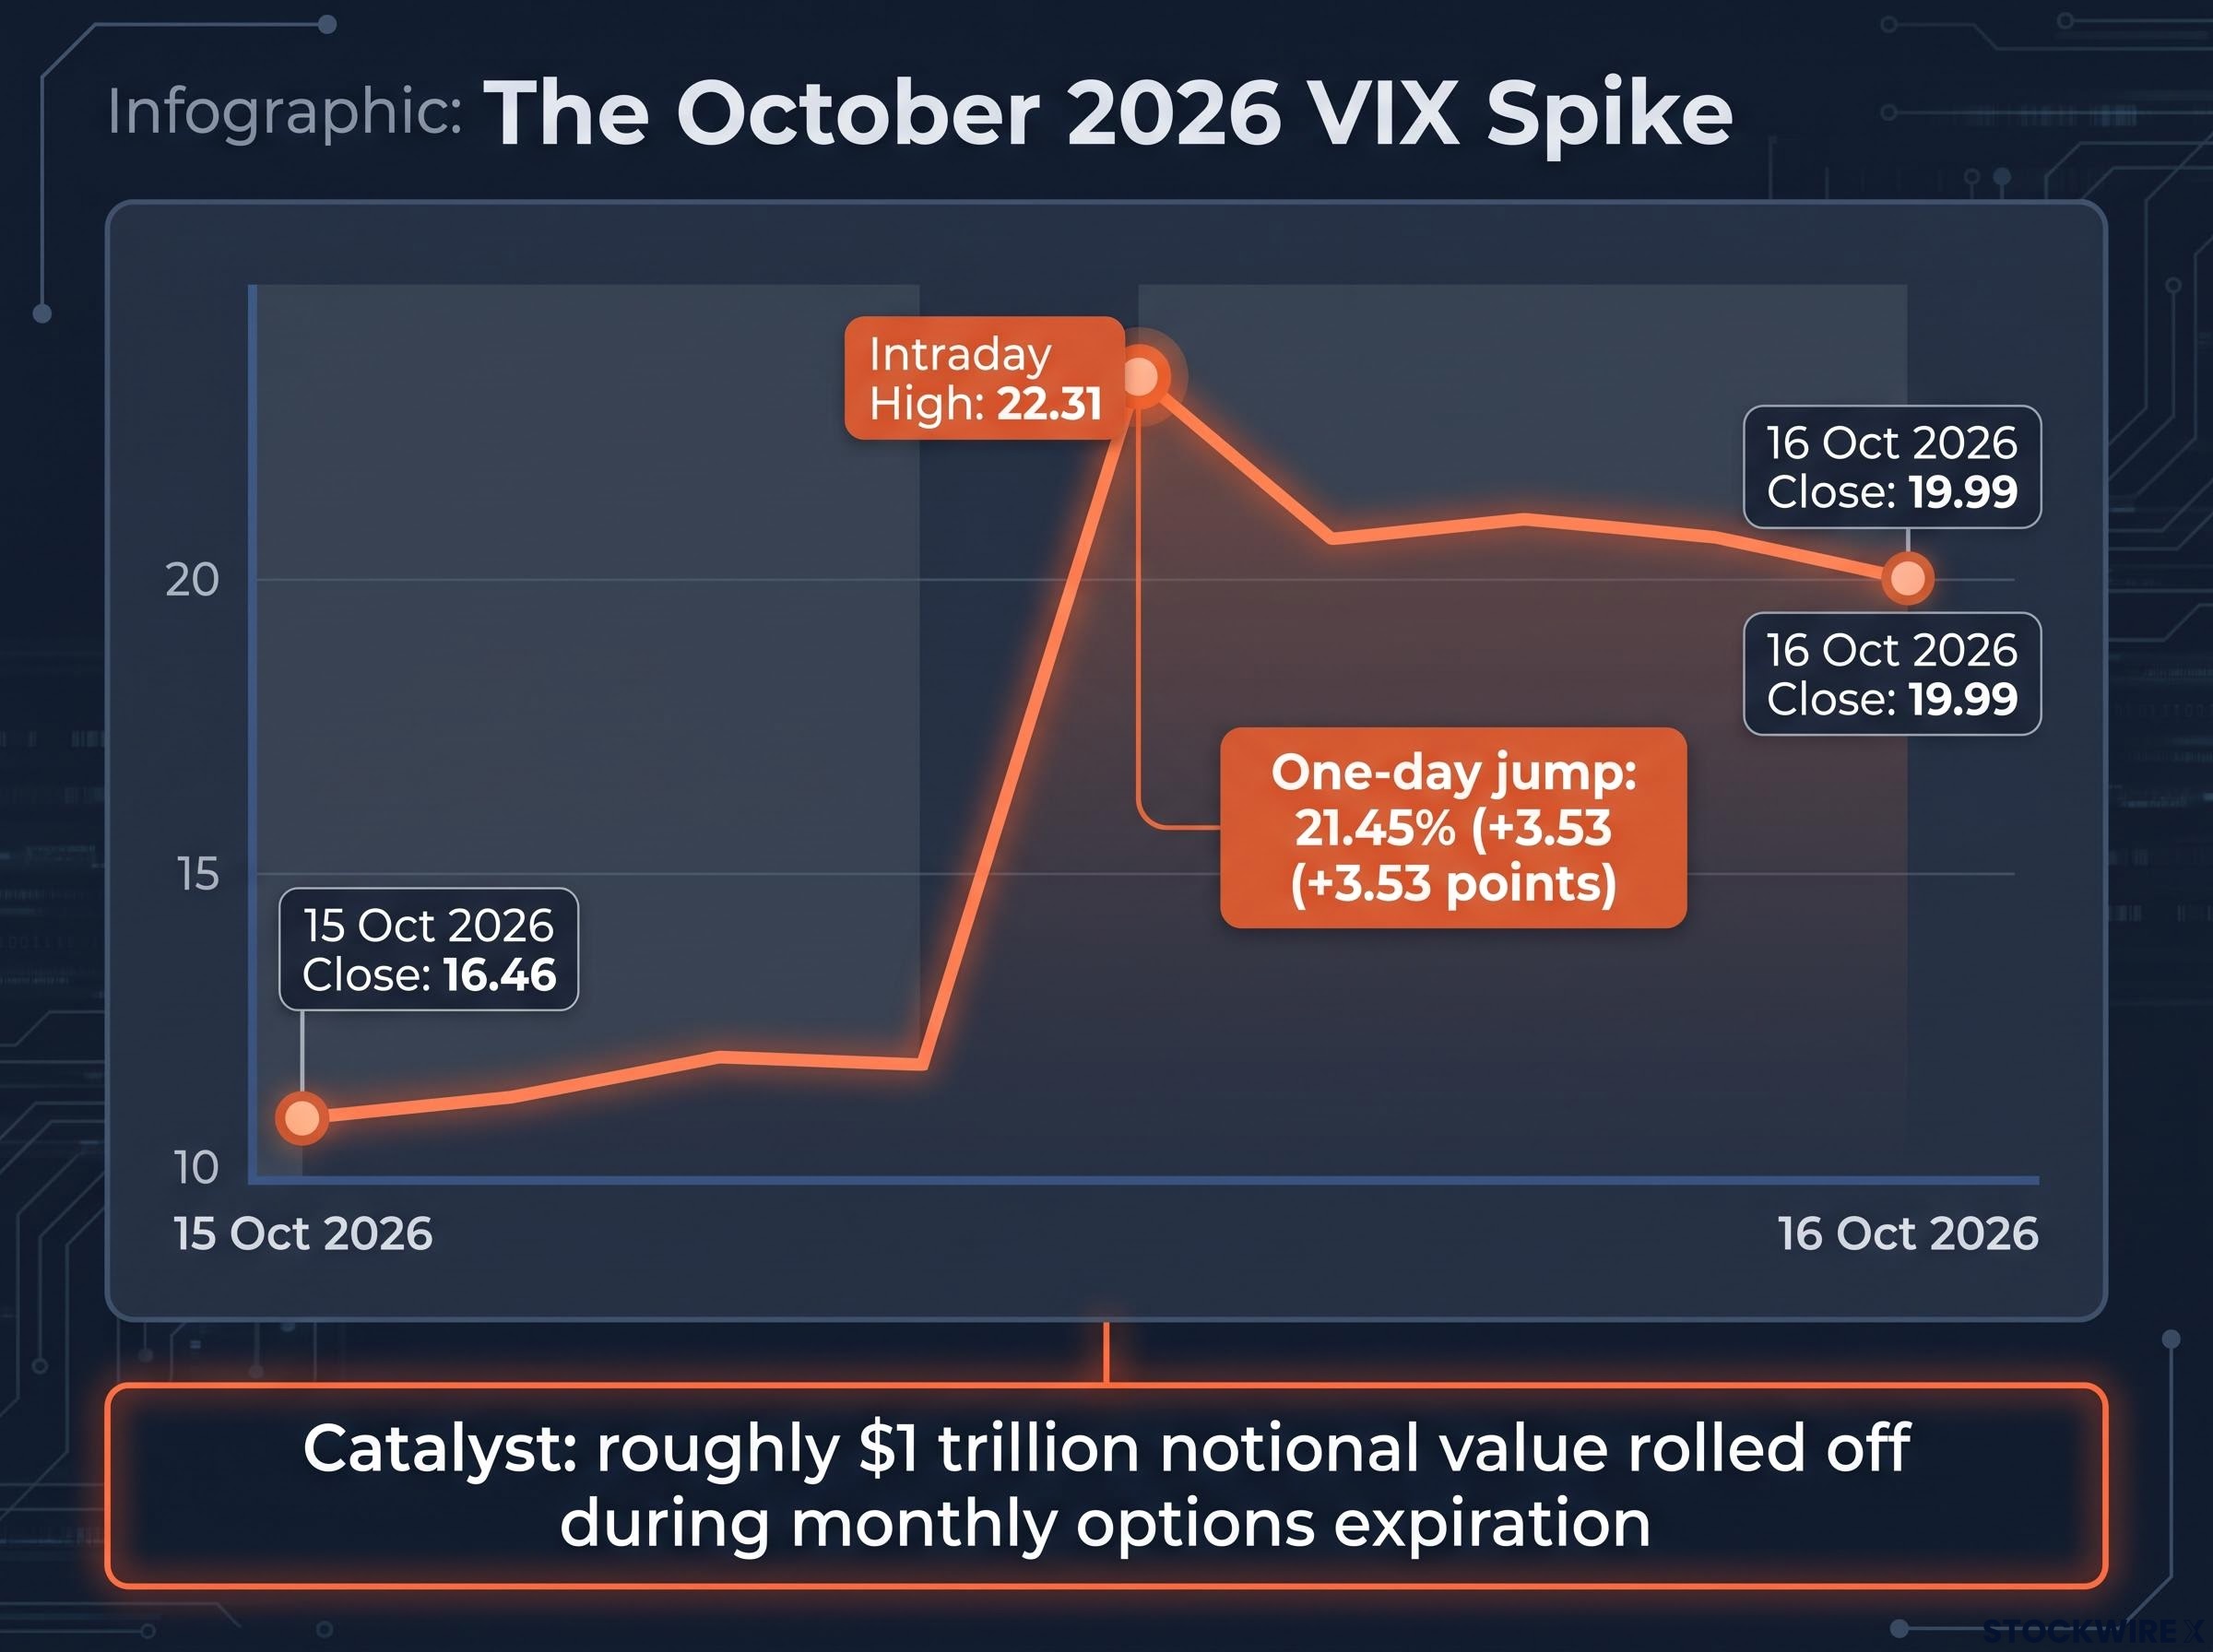
A VIX close of 19.99 does not look like a crisis number. On Friday, though, it arrived after weeks of the volatility index sitting in a compressed 14-16 range, and the one-day jump of 21.45% caught many investors off guard. The intraday high of 22.31 made the headlines. The close told a calmer story.
That VIX spike did not happen alone. In the same week, CoreWeave shares plunged while its credit-default-swap pricing hit a record, and AI-linked chipmakers such as SK Hynix sold off hard in Seoul.
Each reading looks alarming on its own. Read together, they mean something more specific, and reacting to any single headline is how investors end up hedging too late or selling too early.
Here is a way to weigh volatility, credit, and historical frequency side by side, so you can judge whether this week was noise or an early warning.
What actually drove the VIX spike after options expiration?
The number everyone quoted was “20”. The precise figures, from Cboe end-of-day data, look like this:
- Prior close on 15 October 2026: 16.46
- Close on 16 October 2026: 19.99, up 3.53 points
- Intraday high: 22.31, which CNBC described as the first move above 22 in four months
- Call share: nine of the ten most actively bought VIX contracts were calls, with about $27 million in premium
The move came on the day of monthly options expiration, when roughly $1 trillion in notional value rolled off, according to SpotGamma. Before that, one-month realised volatility (how much the index actually moved) was unusually low, and SpotGamma described one-day implied volatility as exceptionally compressed.
The VIX premium over realised volatility is a structural feature of options markets, which helps explain why a quiet tape can still produce a sharp index jump once expiration clears the dealer positioning that suppressed it.
Brent Kochuba, founder of SpotGamma, read the speed of the rise and the concentration in calls as traders cashing in October positions and rolling hedges into November. SpotGamma flagged the expiration as a catalyst for wider trading ranges, not the start of a bear market.
The SpotGamma point Expiration does not mechanically cause a selloff. It removes a stabilising effect, leaving the market more exposed to rates, earnings, and fresh hedging demand.
How dealer gamma works in plain terms
Gamma measures how quickly an options dealer’s hedging needs change as prices move. When dealers are “long gamma”, they hedge by buying when the market falls and selling when it rises, which dampens movement. Heavy short-dated put selling had left dealers in that position before expiration.
Once those contracts expired, the cushion thinned. If the index slips below key levels, dealer hedging can amplify moves rather than absorb them.
It also helps to know what the VIX measures. It tracks roughly 30-day option-implied volatility on the S&P 500, not the odds of recession or default. Spot VIX, VIX futures, VIX options, and exchange-traded products (ETPs) are separate instruments that behave differently.
What this tells you is that a VIX near 20 marks a shift from unusual calm to ordinary caution. Hedging conditions changed. A recession forecast did not.
When big ASX news breaks, our subscribers know first
Is CoreWeave’s credit warning a canary or an outlier?
The volatility move had a mechanical explanation. CoreWeave’s numbers were harder to wave away.
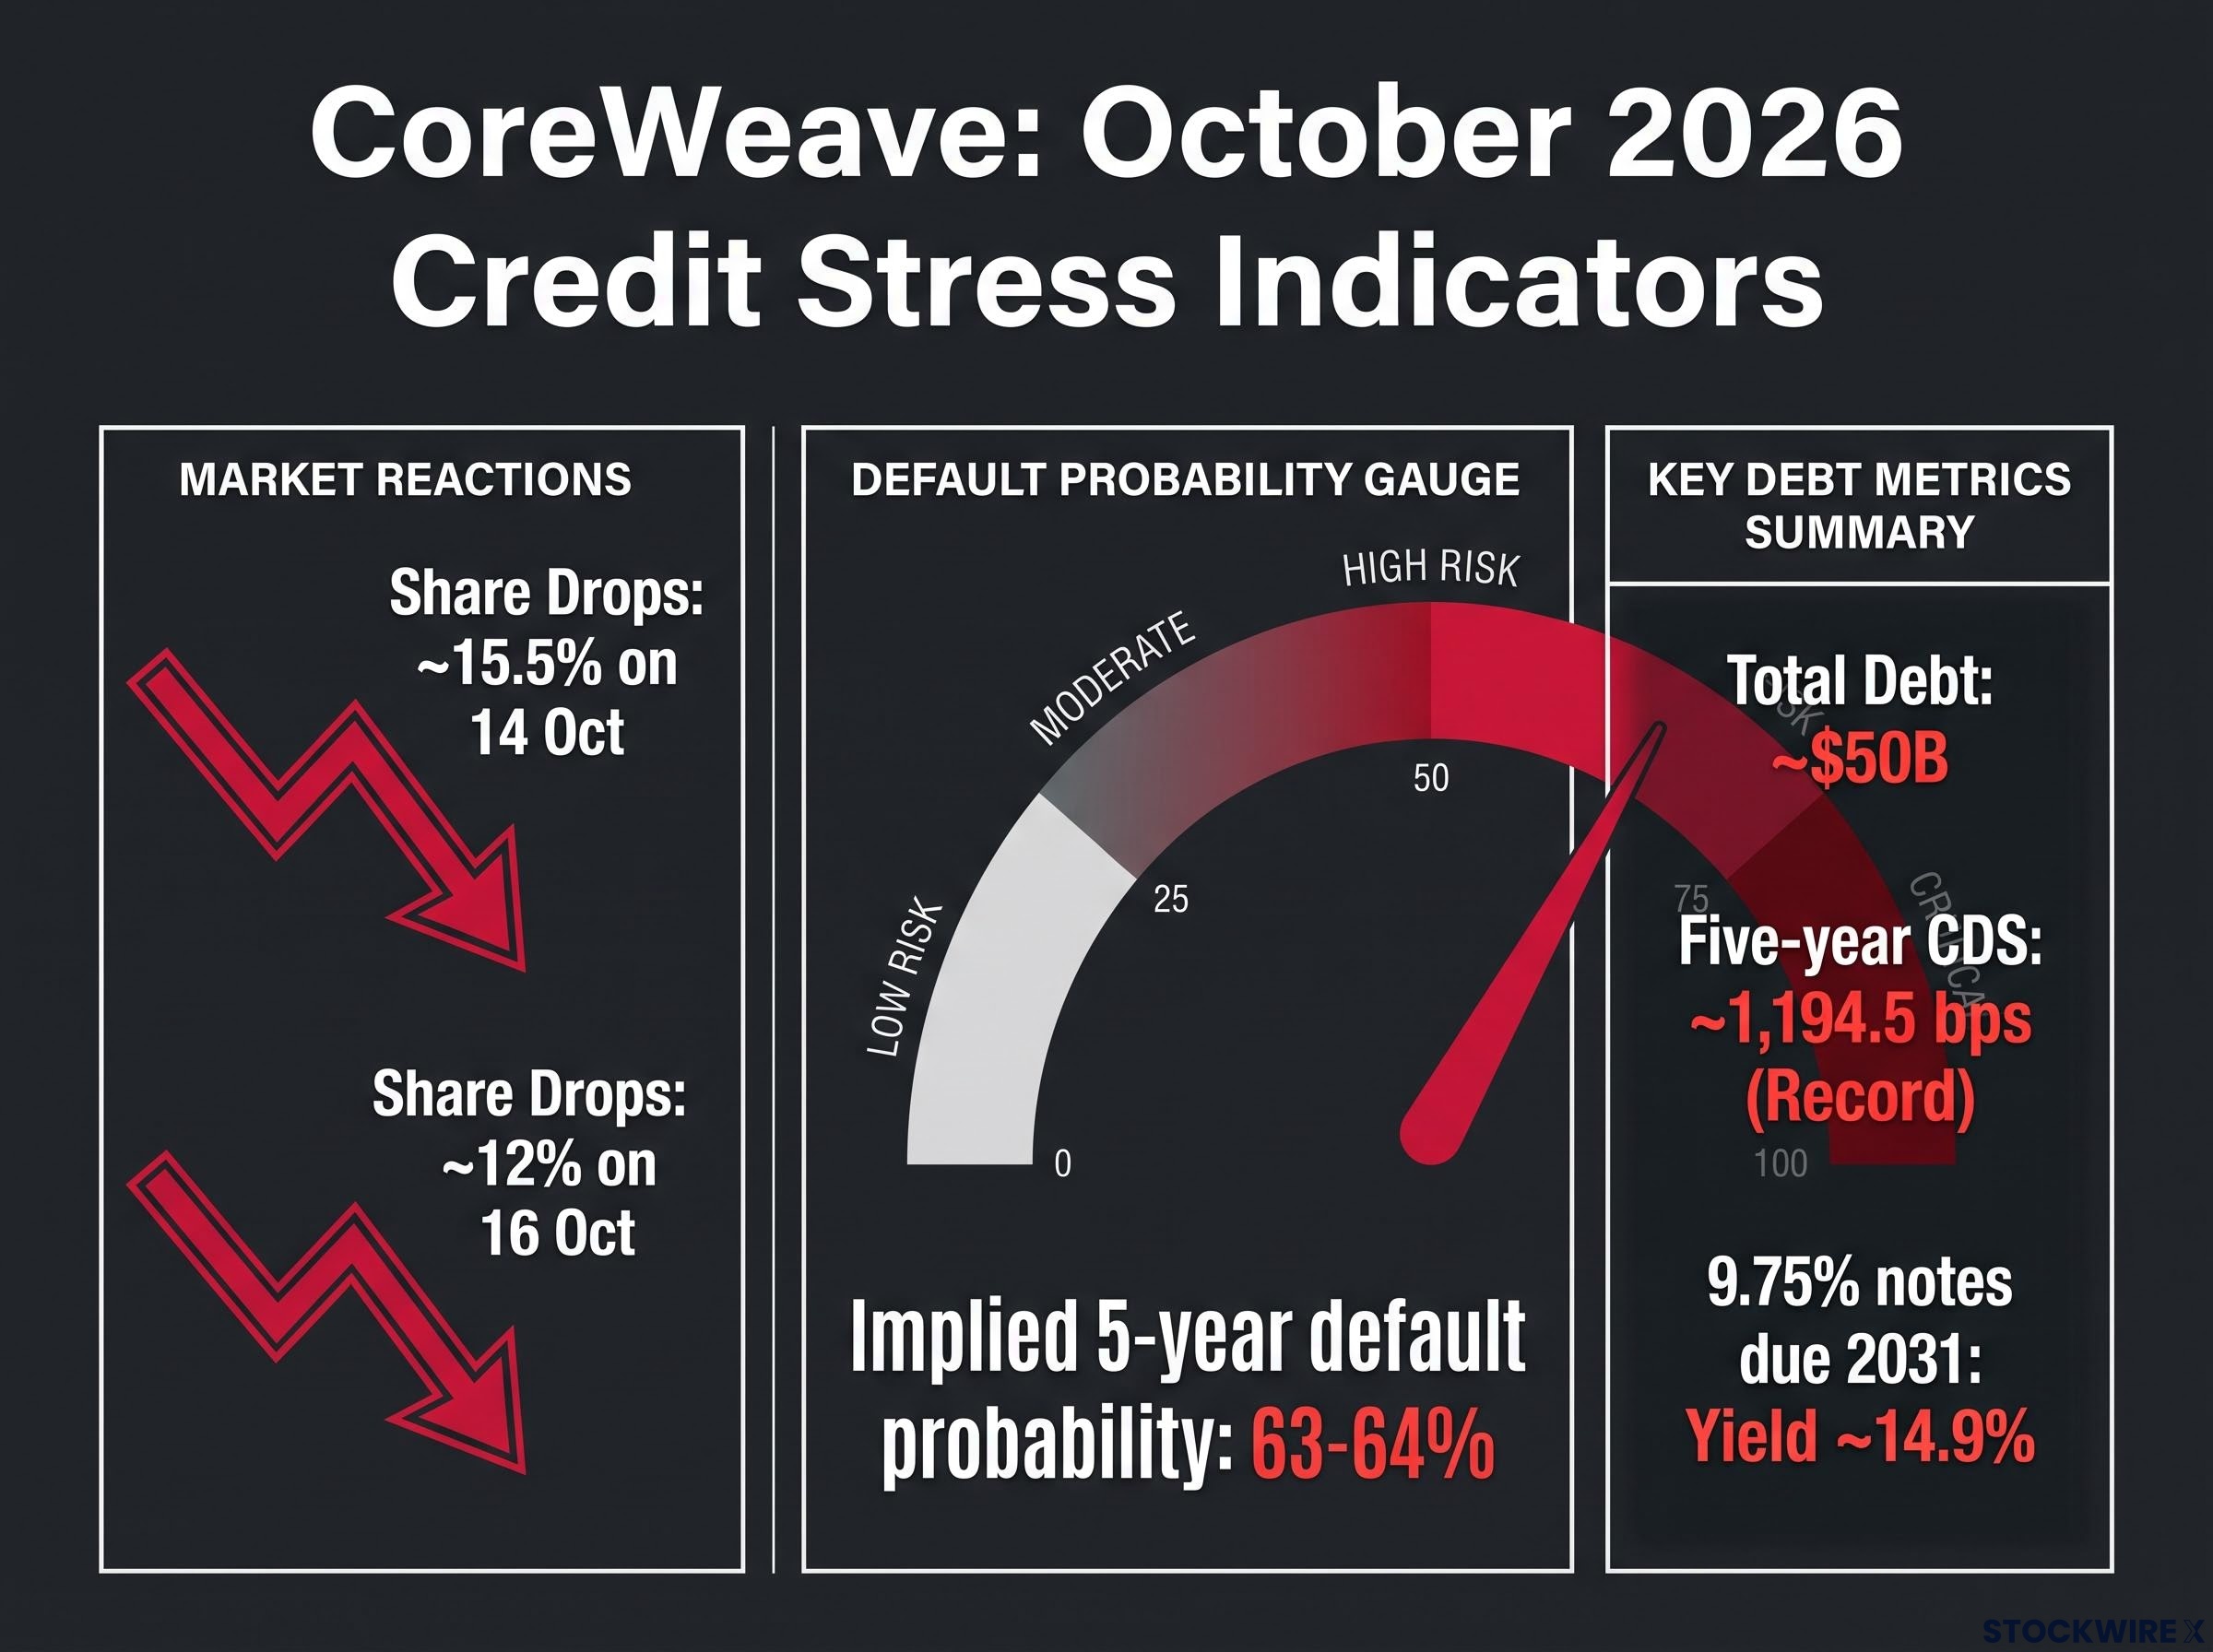
The shares fell about 15.5% on 14 October and nearly 12% on 16 October, losing roughly a quarter of their value in a week. A credit default swap (CDS) is a contract that pays out if a borrower defaults, so its price reflects how risky lenders think the debt is.
| Instrument | Level | Date | Source |
|---|---|---|---|
| 9.625% notes due 2032 | Yield about 14.8% | October 2026 | CNBC |
| 9.75% notes due 2031 | Yield about 14.9% | 14 October 2026 | CNBC |
| Five-year CDS | About 1,194.5 bps intraday (record) | October 2026 | ICE Data Services |
| Implied five-year default probability | 60%+ / about 63-64% | 15-16 October 2026 | Bloomberg / LSEG |
| Total debt | About $50B | October 2026 | LSEG-based reporting |
One basis point (bps) is one-hundredth of a percentage point. The default figure is a market-implied estimate drawn from CDS pricing, shaped by recovery assumptions and liquidity. It is not a company forecast or a guaranteed outcome.
CoreWeave’s bond stress showed up before the equity move, with the 2032 notes trading below 78 cents on the dollar, and a hot inflation print pushing Treasury yields higher added to the funding pressure on leveraged AI borrowers.
Experts split on what it means:
- The canary camp: Gil Luria of D.A. Davidson called CoreWeave the “subprime tranche” of the AI trade. Kathleen Brooks of XTB called it a potential “canary in the coal mine”, since credit stress surfaces before hyperscaler earnings feel it.
- The limited-analogy camp: Dan Greenhaus of Solus Alternative Asset Management argued the distress reflects unusually aggressive financing, not the whole sector. Sam Stovall of CFRA called CoreWeave a proxy for highly leveraged companies and said bankruptcy was not inevitable.
- The company: CEO Mike Intrator said the deal backlog was sufficient to support debt obligations.
Chip weakness added pressure. SK Hynix fell more than 9% in Seoul on 15 October and sat about 31% below its all-time high.
Where the 2007 and dot-com comparisons break down
The 2007 crisis involved securitised mortgages spread through the banking system. CoreWeave is a corporate-credit and infrastructure-financing problem. The dot-com parallel captures real demand alongside uneconomic spending, but AI infrastructure has identifiable customers and physical assets.
The honest conclusion is narrower than either camp offers: demand looks real, while financing may be uneconomic for leveraged operators. For you, that means judging AI exposure by balance-sheet leverage rather than theme. CoreWeave’s stress shows where funding is most fragile, not that Nvidia, Microsoft, or the Nasdaq carry the same default risk.
How often do 6% Nasdaq drops really happen, and what does clustering tell you?
If one company’s credit is a narrow signal, the next question is how unusual sharp index falls really are. The original discussion offered a striking answer.
Unverified statistic The speaker cited 128 Nasdaq declines of 6% or more since 1 January 1987, with 38 during crises, implying about 90 in ordinary markets. Subsequent research could not independently confirm this count from a primary source.
Treat the count as a claim, not a fact. The verified history is thinner but consistent with the direction of it: the April 2025 declines near 6% ranked among the index’s largest daily losses, and 1987 and 2020 each produced double-digit single-day drops.
The more useful evidence comes from clustering research, which reframes the question from “how often” to “how many in a row”:
- Large moves tend to follow large moves, and quiet periods follow quiet ones
- A study of Nasdaq data found large losses cluster more strongly than large gains
- Research using realised volatility found large-volatility clusters can persist for more than 40 days
- Extreme moves are often preceded by elevated movement in the prior few sessions
The implication is practical. One large decline is weak evidence on its own. A sequence of them, alongside a rising VIX and widening credit spreads, carries far more weight because the signals reinforce each other.
If sharp drops are common outside crises, any single one should prompt you to check other signals rather than deliver a verdict.
Can you still trust volatility products in a post-low-rate regime?
The speaker raised a more unsettling argument. VIX futures launched in 2004 and options in 2006, inside roughly 40-50 years of falling rates and low inflation. If that era has ended, the speaker argues, backtests built on it may mislead.
Three arguments suggest behaviour could differ:
- Carry costs more. In contango, when longer-dated futures price above near-term ones, holding VIX futures loses value as positions roll. Higher rates raise the opportunity cost of protection.
- Rates can lift both equity and volatility risk. Hotter inflation and Federal Reserve concerns were cited alongside AI-debt worries in October. Stovall described the episode as primarily a rates event expressed through credit.
- Short-volatility strategies are fragile. A market calmed by put selling can look quiet until hedging demand reverses.
The counterview holds weight too. The products still track 30-day expected S&P 500 volatility, and futures and ETP returns depend on term structure, roll yield, leverage, and daily rebalancing. Kochuba attributed the October move to positioning, not structural change.
| Instrument | What it measures | Main cost or risk |
|---|---|---|
| Spot VIX | 30-day implied S&P 500 volatility | Not directly tradable |
| VIX futures | Expected VIX at a future date | Roll cost in contango |
| VIX options | Bets on future VIX levels | Premium decay |
| Short-vol ETPs | Inverse exposure to futures | Abrupt losses when volatility spikes |
A spot VIX rise does not translate one-for-one into a futures-based fund’s return. The qualified answer is yes, you can still use these tools, provided you know which instrument you hold and what its roll costs you.
Investors exploring volatility products will find our full explainer on VIX futures and contango, which shows why futures trade at a persistent premium to spot VIX.
What this week’s signals confirm, and what they do not
Put the three readings together and the picture is clearer. Volatility jumped from unusual compression after a positioning event. Credit stress is concentrated in one leveraged borrower so far. Frequency data suggests sharp drops are not rare outside crises.
A more serious warning would need cross-asset confirmation: persistent credit deterioration across many issuers, widening funding markets, falling liquidity, forced deleveraging, and worsening earnings expectations. None of that is established yet.
Persistence matters more than a single print, and futures curve shape offers a cleaner read: a flattening or inverting curve alongside sustained index declines separates a genuine regime shift from a one-day scare.
Current evidence does not support treating this as a 2007-style crisis. Watch for repeated VIX closes above 20, credit spreads widening beyond CoreWeave, and a cluster of large Nasdaq declines. If those arrive together, the signal changes.
This article is for informational purposes only and should not be considered financial advice. Investors should conduct their own research and consult with financial professionals before making investment decisions. Past performance does not guarantee future results, and forward-looking views are speculative and subject to change based on market developments.