The bull market that began in October 2022 turned four this week. That sounds old until you check the record: the average S&P 500 bull market since 1946 has run 61 months, so this rally is still younger than a typical one.
It has covered serious ground anyway. The index has gained roughly 120% from its 12 October 2022 closing low, according to CNBC.
The anniversary arrives in a crowded week. September’s consumer price index came in hotter than expected at 3.7% year over year. Q3 earnings season has begun, and markets now see a rate hike at the Federal Reserve’s 27-28 October meeting as close to a coin flip.
That cluster of data makes it easy to overreact. Here is how to tell real warning signs from noise, starting with what actually ends rallies and then testing today’s evidence against that list.
Why do bull markets end if not from old age?
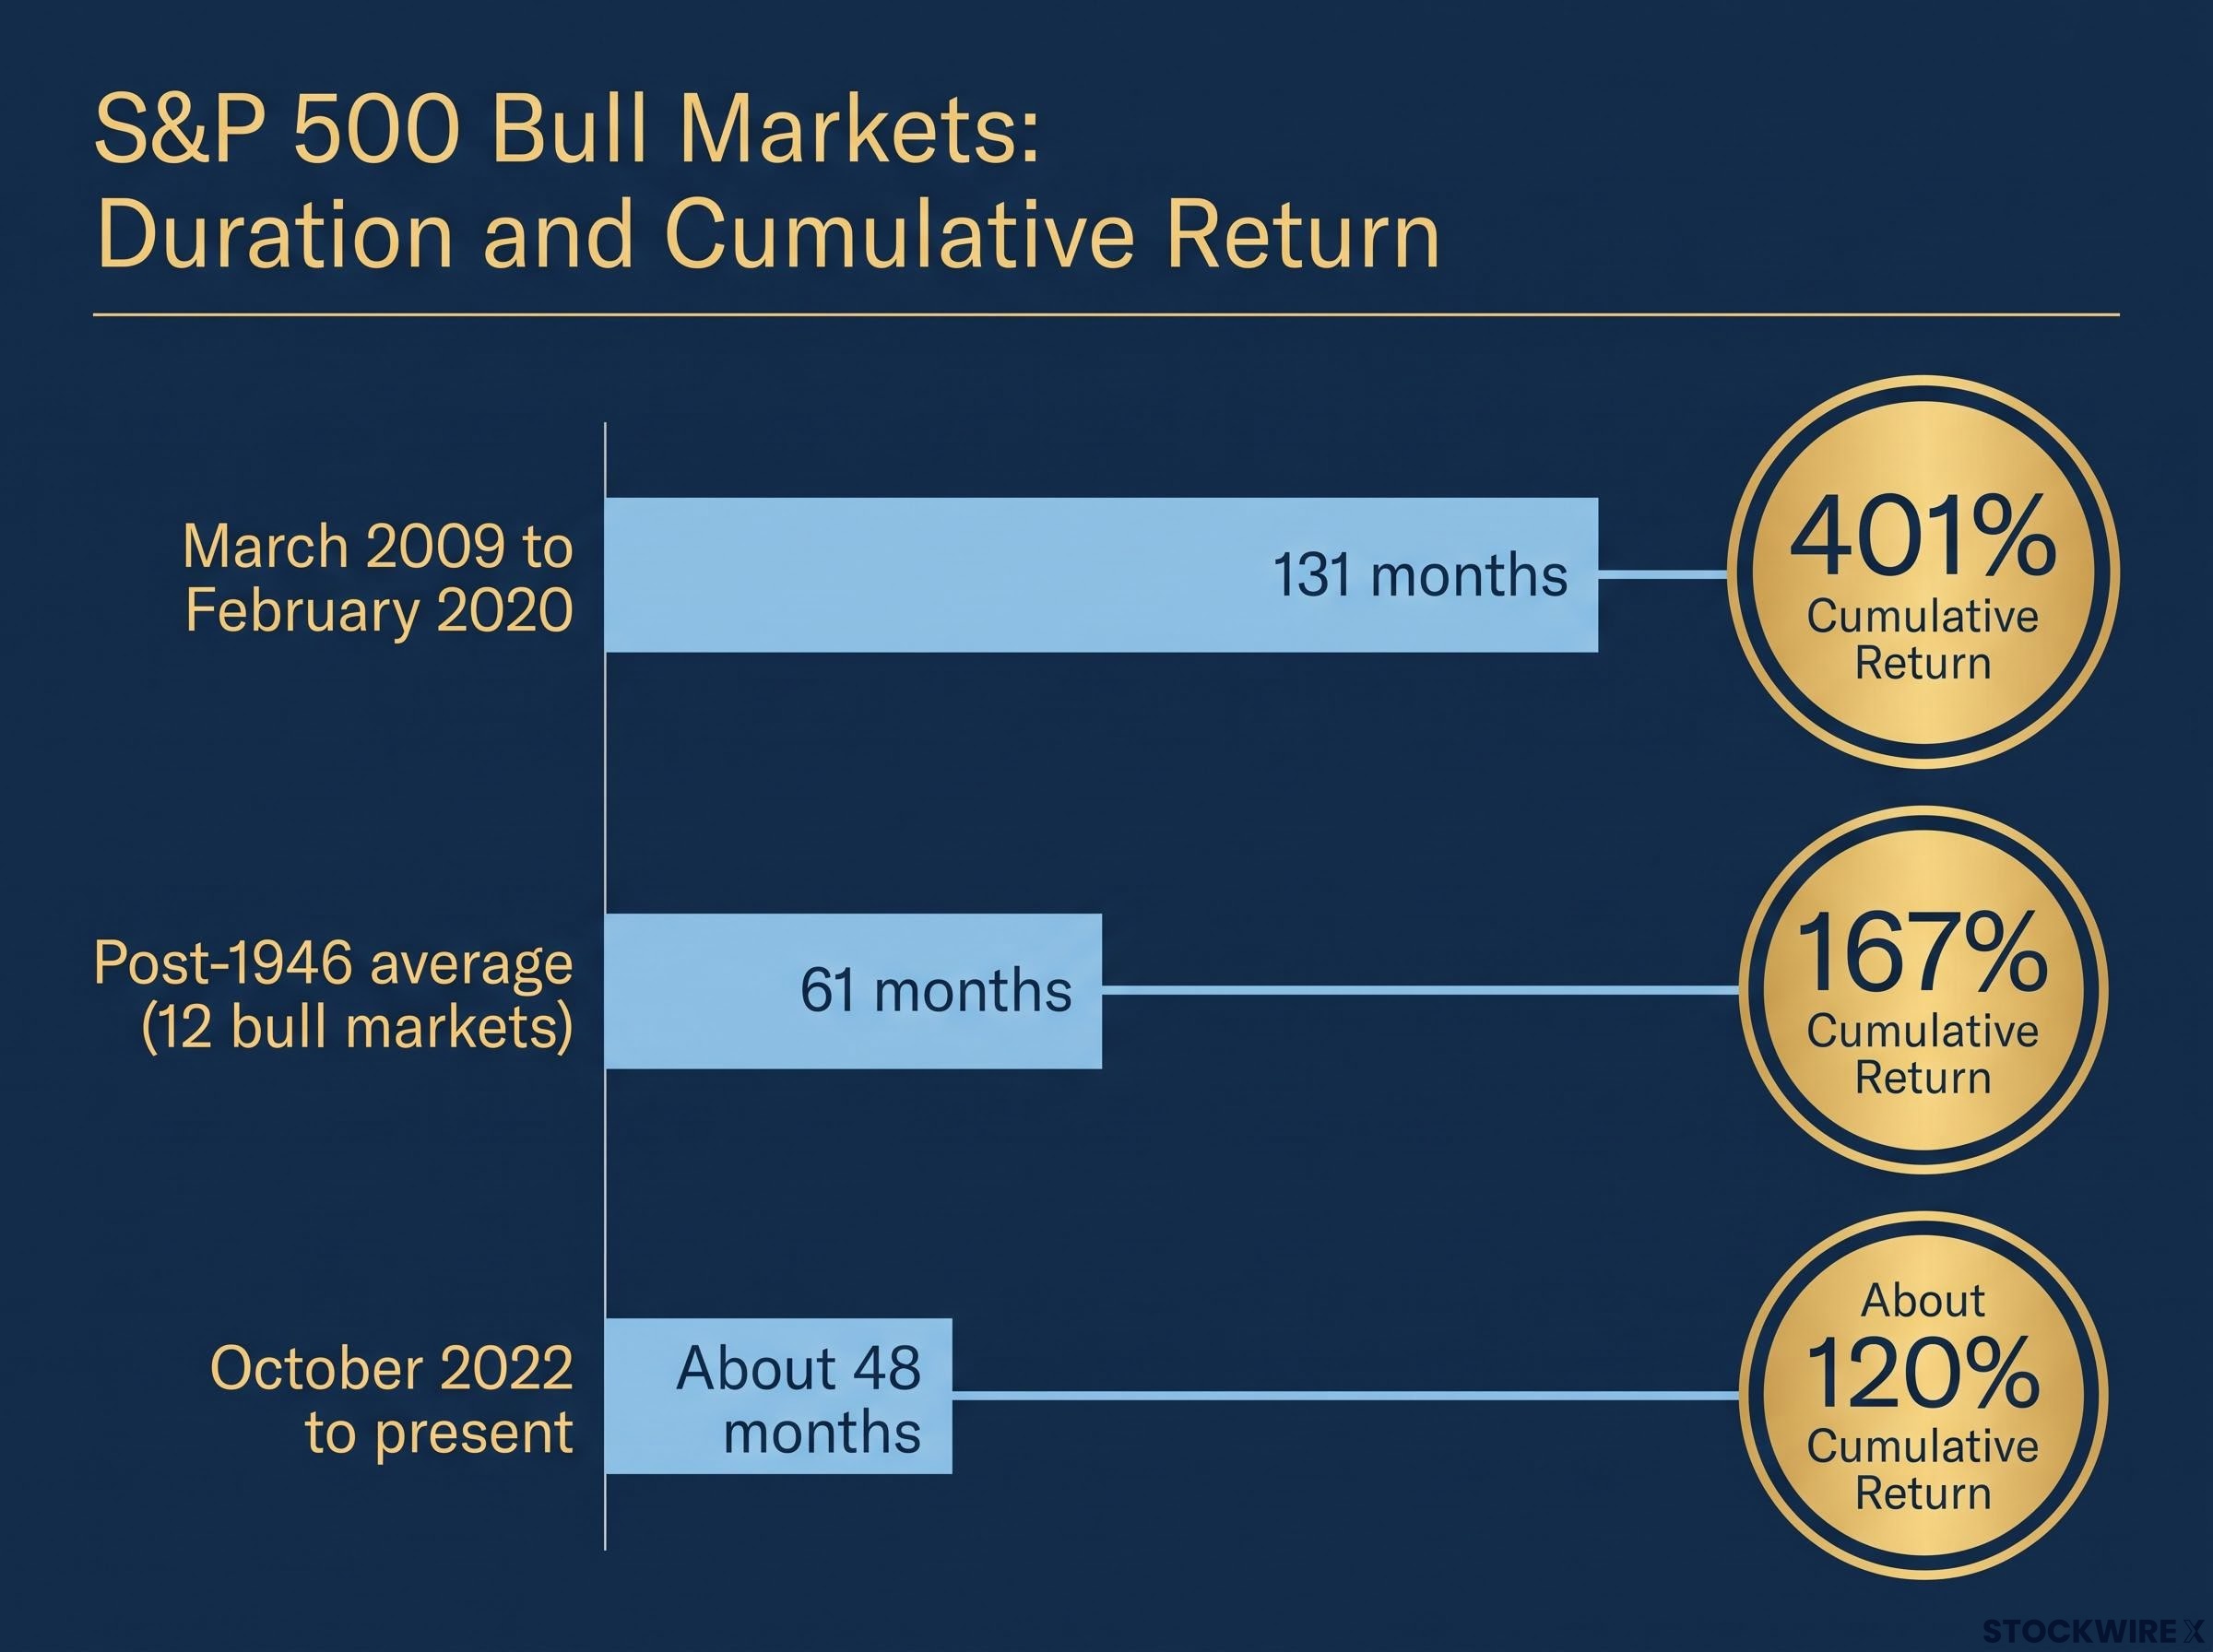
The intuition that four years is “long in the tooth” does not survive the historical record. Fisher Investments calculates that the 12 post-1946 S&P 500 bull markets averaged 61 months and a 167% cumulative price return. The longest ran for more than a decade.
| Bull market | Duration | Cumulative return | Context |
|---|---|---|---|
| Post-1946 average (12 bull markets) | 61 months | 167% | Includes shorter and longer runs |
| March 2009 to February 2020 | 131 months | 401% | Longest on record, more than twice the average |
| October 2022 to present | About 48 months | About 120% | Younger than average |
None of this promises another year of gains. It shows that duration does not trigger endings. Asking how old this bull market is gets you nowhere; asking which cause of death is showing up is the question worth your attention.
Duration cuts both ways: bull markets rarely die of old age, and bear market recovery time has ranged from under six months to roughly 25 years depending on what caused the decline, which is why the cause matters more than any average.
The five usual causes of endings
Fisher’s framework identifies five common endings, and the rest of this analysis tests each one:
- Recession: economic growth deteriorates enough to drag on profits.
- Falling earnings: corporate profits shrink and stop supporting prices.
- Policy or monetary shocks: political decisions or central bank tightening hit demand.
- Large unforeseen events: a shock big enough to remove substantial economic value.
- Euphoria: optimism grows so excessive that investors ignore fundamental risks.
That last cause echoes a line attributed to Sir John Templeton:
The sentiment cycle Bull markets “are born on pessimism, grow on skepticism, mature on optimism and die on euphoria.”
Why shocks are not the same as endings
Investors tend to fear whatever caused the last downturn. Inflation drove the 2022 bear market after peaking near 9% in mid-2022, and that memory lingers. Persistent worry like this forms a “wall of worry,” which keeps expectations low and leaves room for positive surprises.
This year offered a live test. A Middle East conflict that began in February 2026 caused a near-10% global stock decline, yet stocks reached new highs by June 2026. A shock produced a correction, not an ending.
When big ASX news breaks, our subscribers know first
What does the hot September CPI actually tell you?
The headline was uncomfortable. On 14 October, the Bureau of Labor Statistics (BLS) reported that both headline and core inflation ran above consensus. Core CPI strips out volatile food and energy prices to show underlying inflation.
| Measure | September 2026 | August 2026 | Consensus |
|---|---|---|---|
| Headline CPI, YoY | 3.7% | 3.4% | 3.6% |
| Headline CPI, MoM | 0.6% | 0.4% | 0.6% |
| Core CPI, YoY | 2.6% | 2.4% | 2.5% |
| Core CPI, MoM | 0.3% | 0.3% | 0.2% |
The composition of the number tones down the alarm. The energy index jumped 5.2% in a single month, a move tied to the Middle East conflict.
The fuel factor Gasoline rose 9.1% in September and accounted for roughly half of the monthly headline increase.
Shelter, meanwhile, drove about half of the monthly core rise. The 1.1 percentage point gap between 3.7% headline and 2.6% core tells you this is mostly an energy shock so far. The real test is what core prices and wages do over the coming months.
Markets still flinched. Treasury yields rose, rate-sensitive tech stocks weakened, and CME FedWatch pricing for a hike at the next meeting climbed from about 20% before the release to roughly 43.7% afterwards. Other coverage put the chance of a hold near 49%, with the Fed’s target range at 3.75%-4.00% after its September hike.
There is one nuance that stops this being a clean all-clear. Core personal consumption expenditures (PCE), the Fed’s preferred inflation gauge, has held at 3.0% since June. September’s PCE figure lands on 29 October, the day after the Fed decides.
Investors exploring the market reaction in full will find our detailed coverage of the September CPI report, including the producer price surge that signals more cost pressure ahead.
Is Q3 earnings season supporting the rally?
On the surface, the profit picture looks strong. FactSet puts blended S&P 500 Q3 earnings growth at 29.0% as of 16 October, down slightly from 29.4% the prior week and 29.6% on 9 October. A figure near that level would mark a third straight quarter above 25%.
Peel back the first layer and methodology matters. LSEG/IBES showed growth closer to 24% before adjusting for a Meta tax item; after adjustment, both providers sat near 30%.
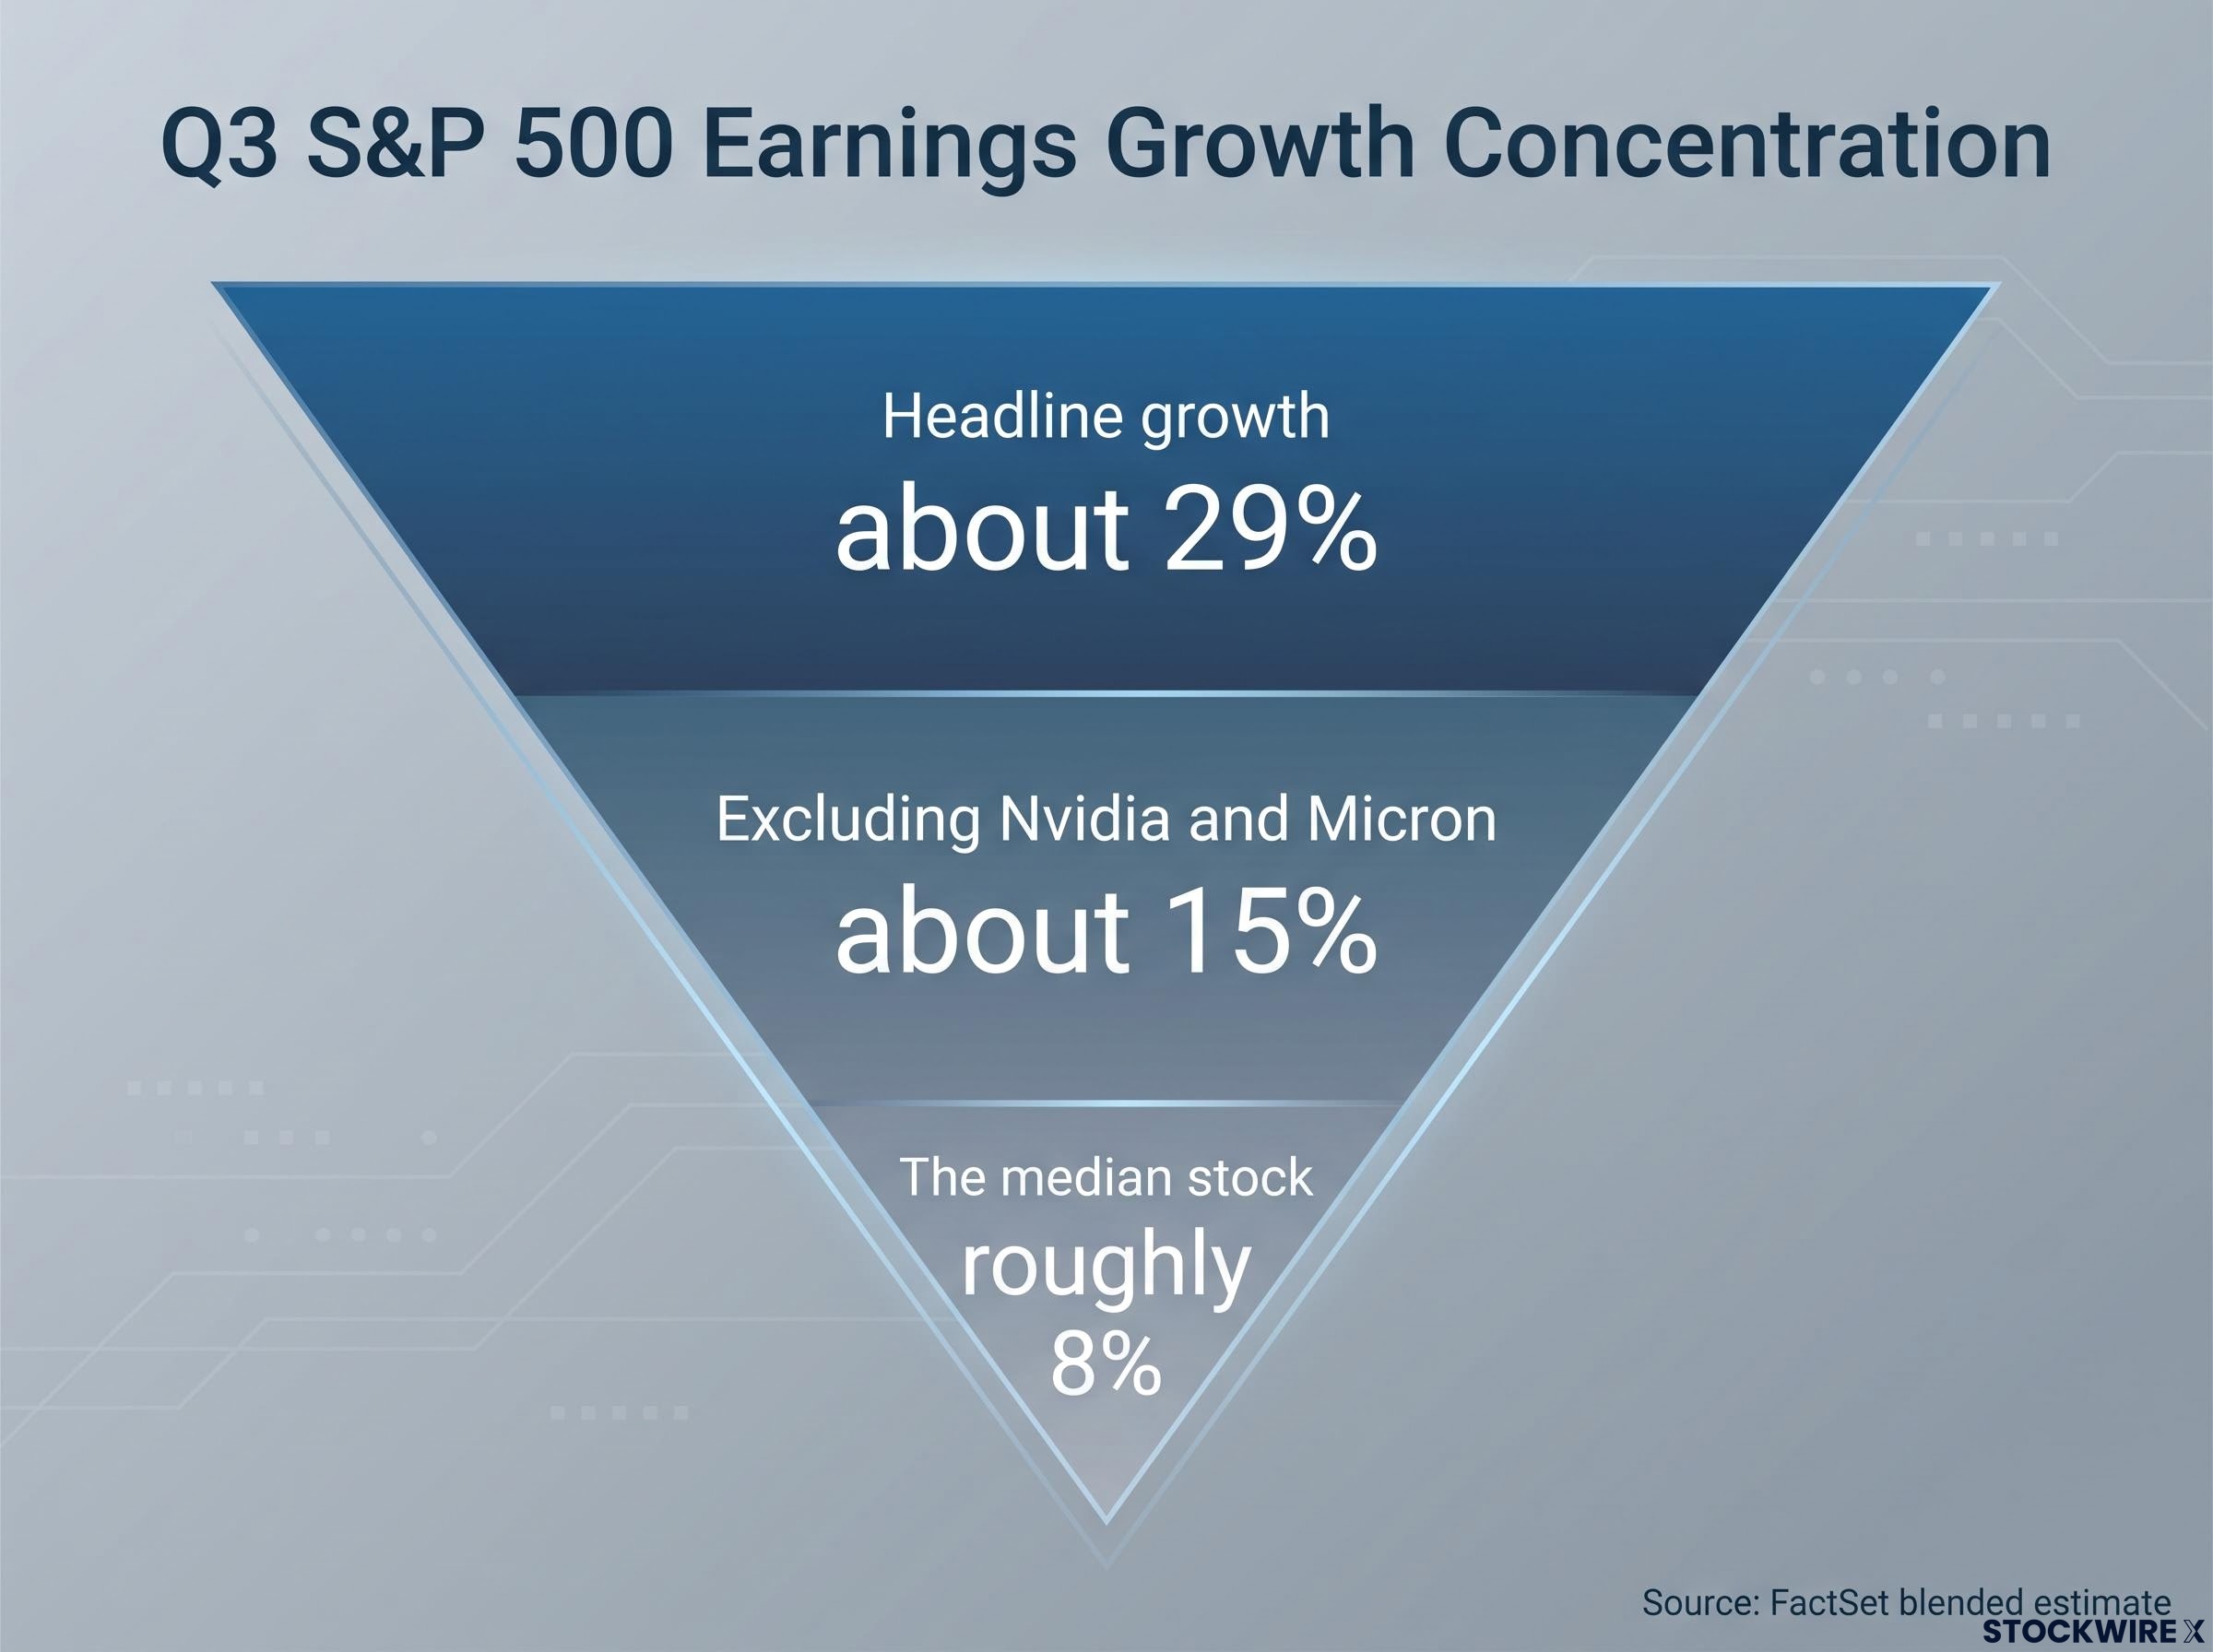
The second layer is concentration, and here the foundation narrows sharply. JPMorgan-related coverage breaks the picture into three tiers:
- Headline growth: about 29% on FactSet’s blended estimate.
- Excluding Nvidia and Micron: growth falls to about 15%.
- The median stock: growth of roughly 8%.
Early reporters added a third layer of mixed signals.
| Reporter | Result | Expectation |
|---|---|---|
| UnitedHealth | Adjusted EPS $4.69 | $4.14 (LSEG consensus) |
| Bank of America | EPS $0.91 ($1.08 adjusted for a regulatory penalty) | $1.10 |
| S&P 500 financials sector | Expected growth 3.3% | Versus 21.9% in Q2 |
The bar is also rising. State Street notes consensus 2026 earnings per share (EPS) estimates have climbed 15.6% since February, and expectations for tech sales growth now exceed industry estimates, which makes upside surprises harder to deliver. Natixis found 85% of strategists rate AI concentration risk as medium or high.
For you, the strong aggregate confirms the “falling earnings” ending has not arrived. But with leadership this narrow, your own exposure to a handful of AI names matters more than the headline figure.
How should you read one data point without overreacting?
Institutional commentary offers a practical filter. Before acting on any release, ask which of these four situations you are actually looking at:
- A one-month energy headline shock that lifts headline inflation without spreading.
- Sustained core and wage acceleration that shows inflation broadening.
- A policy response that materially tightens financial conditions.
- Real deterioration in earnings or economic growth.
September’s CPI sits firmly in the first category. The open question is whether it migrates into the second.
Two readings of energy-driven inflation
The transitory case rests on arithmetic and labour markets. Zurich‘s inflation analysis suggested that if oil held near prevailing levels, the energy contribution could fade quickly and even turn negative, with weak labour markets limiting wage pass-through. Reuters reported in September that European Central Bank officials had not yet seen a significant wage response.
The persistent case argues timing, not absence. The Bank for International Settlements (BIS) warns that second-round effects through wages may emerge later, likely in 2027-28 under adverse scenarios. Royal London Asset Management puts typical wage pass-through at three to six quarters after a shock.
The evidence genuinely conflicts, so neither reading deserves blind confidence. Only 27% of strategists surveyed by Natixis thought the geopolitical shock alone was likely to end the rally. The bearish case needs earnings disappointment and Fed tightening arriving together.
War-driven energy costs can also leak into core measures through airfares and delivery charges, which means the clean split between an energy shock and broad inflation may be less tidy than the headline-versus-core gap implies.
What would change the picture
| Signal | What it would look like | Where it stands now |
|---|---|---|
| Core inflation | Repeated hot monthly core prints | One modest miss; core PCE steady at 3.0% |
| Wages | Clear acceleration in pay growth | Limited evidence of second-round effects so far |
| Fed policy | Further hikes tightening financial conditions | October hike roughly a coin flip |
| Earnings | Falling profits beyond the AI leaders | Strong headline, narrow breadth |
Context helps here. Earlier 2026 oil shocks brought choppy trading and higher tightening expectations without ending the advance. The S&P 500 is about 13% higher this year; reports differ on the timing of its latest record, with one source dating the peak close to roughly 7,818.93 on 6 October and mid-October closes reported in the 7,600-7,744 range.
Your plan should change on persistence, not on a single release. Watch for hot core prints, rising wages, tightening and falling earnings showing up at the same time.
What the anniversary changes, and what it does not
Turning four changes nothing on its own, because age has never caused a bull market to end. Run the five-cause checklist and the picture is mixed but intact: earnings remain supportive though narrow, inflation is the live risk, and the Fed is the near-term swing factor.
Institutions remain split on how far the rally has to run, with several large asset managers holding overweight equity stances while others maintain a cautious late-cycle view and warn that a 10-20% drawdown would not be surprising.
The next fortnight will test that reading. The Fed meets on 27-28 October, September PCE follows on 29 October, and the bulk of Q3 reports are still to come. Each is a moment to apply the four-step filter rather than react to a headline.
Bull markets tend to be resilient, but they are rarely smooth. Volatility is part of the ride, and the signal that matters is persistence across several measures at once.
This article is for informational purposes only and should not be considered financial advice. Investors should conduct their own research and consult with financial professionals before making investment decisions. Past performance does not guarantee future results. Financial projections are subject to market conditions and various risk factors.