
US consumer prices rose 3.7% in the year to September, an inflation reading hot enough to revive talk of further Federal Reserve tightening. Over the following sessions, gold climbed about 1.5%, the Australian dollar fell and Bitcoin edged higher. One inflation shock produced four different moves, and a simple risk-on, risk-off reading of the market cannot explain all of them.
Three catalysts arrived close together. Fed Chair Kevin Warsh said the Fed would “deliver price stability” but would not prejudge upcoming meetings. A senior US Treasury official warned that disorderly currency moves could unsettle markets. TD Securities trimmed its September inflation forecast while still expecting a December rate hike.
Each catalyst pulled sentiment in a slightly different direction. That is why the usual split between optimism and caution gets you only part of the way to understanding what happened.
Here you will find a working method for translating inflation data and official commentary into likely moves across the Australian dollar, the Japanese yen, gold and Bitcoin. You will also see where that method stops being reliable.
What does risk on risk off actually mean, and why does it matter for inflation news?
Markets swing between two moods. When investors feel optimistic, they buy riskier assets in search of higher returns, and traders call that “risk-on”. When they grow wary, they rotate toward steadier holdings that prioritise protecting capital over chasing gains, and traders label that shift “risk-off”.
According to educational material from FXStreet, risk-on periods typically lift stocks, most commodities (gold is the exception), the currencies of commodity-exporting countries, and crypto. Risk-off periods tend to favour bonds, gold and safe-haven currencies.
Inflation and central bank news can push investors from one mood to the other. Hotter prices raise the chance of higher interest rates, and higher rates make risky assets less attractive. You should treat the framework as a lens for reading sentiment, not a rule that predicts every price.
| Asset class | Typical risk-on behaviour | Typical risk-off behaviour | Why |
|---|---|---|---|
| Stocks | Rise | Fall | Investors seek growth when confident |
| Commodities (ex gold) | Rise | Fall | Linked to demand from economic activity |
| Bonds and gold | Lag | Rise | Seen as stores of safety |
| AUD, CAD, NZD | Rise | Fall | Economies depend on commodity exports |
| USD, JPY, CHF | Lag | Rise | Treated as safe-haven currencies |
| Crypto | Rise | Fall | Behaves as a high-risk asset |
Which currencies are the usual safe havens, and why?
Each safe-haven currency earns its status for a different reason. The US dollar (USD) gains support from its role as the world’s reserve currency and from the broad perception that US government debt is a secure place to park money. The Japanese yen (JPY) is underpinned by steady appetite for Japanese government bonds, a large share of which sit with domestic holders. The Swiss franc (CHF) benefits from Swiss banking laws that are seen as protecting capital.
On the other side sit the Australian, Canadian and New Zealand dollars. Their economies lean heavily on commodity exports, so they tend to rise when global demand looks healthy.
Knowing where each asset normally sits gives you a baseline to test against. When an asset breaks from that baseline, it tells you something else is driving the move.
For readers wanting the wider picture, our full explainer on risk-on and risk-off cross-asset behaviour shows how the yen, gold and Treasuries moved together during the 5 August 2024 selloff.
When big ASX news breaks, our subscribers know first
How sticky inflation and Fed signals set the mood
That baseline gets tested when the signals arrive in a confusing order, and in mid-October they did. The inputs did not add up to a clear tilt toward caution. Instead, they produced an ambiguous mood.
The inflation data
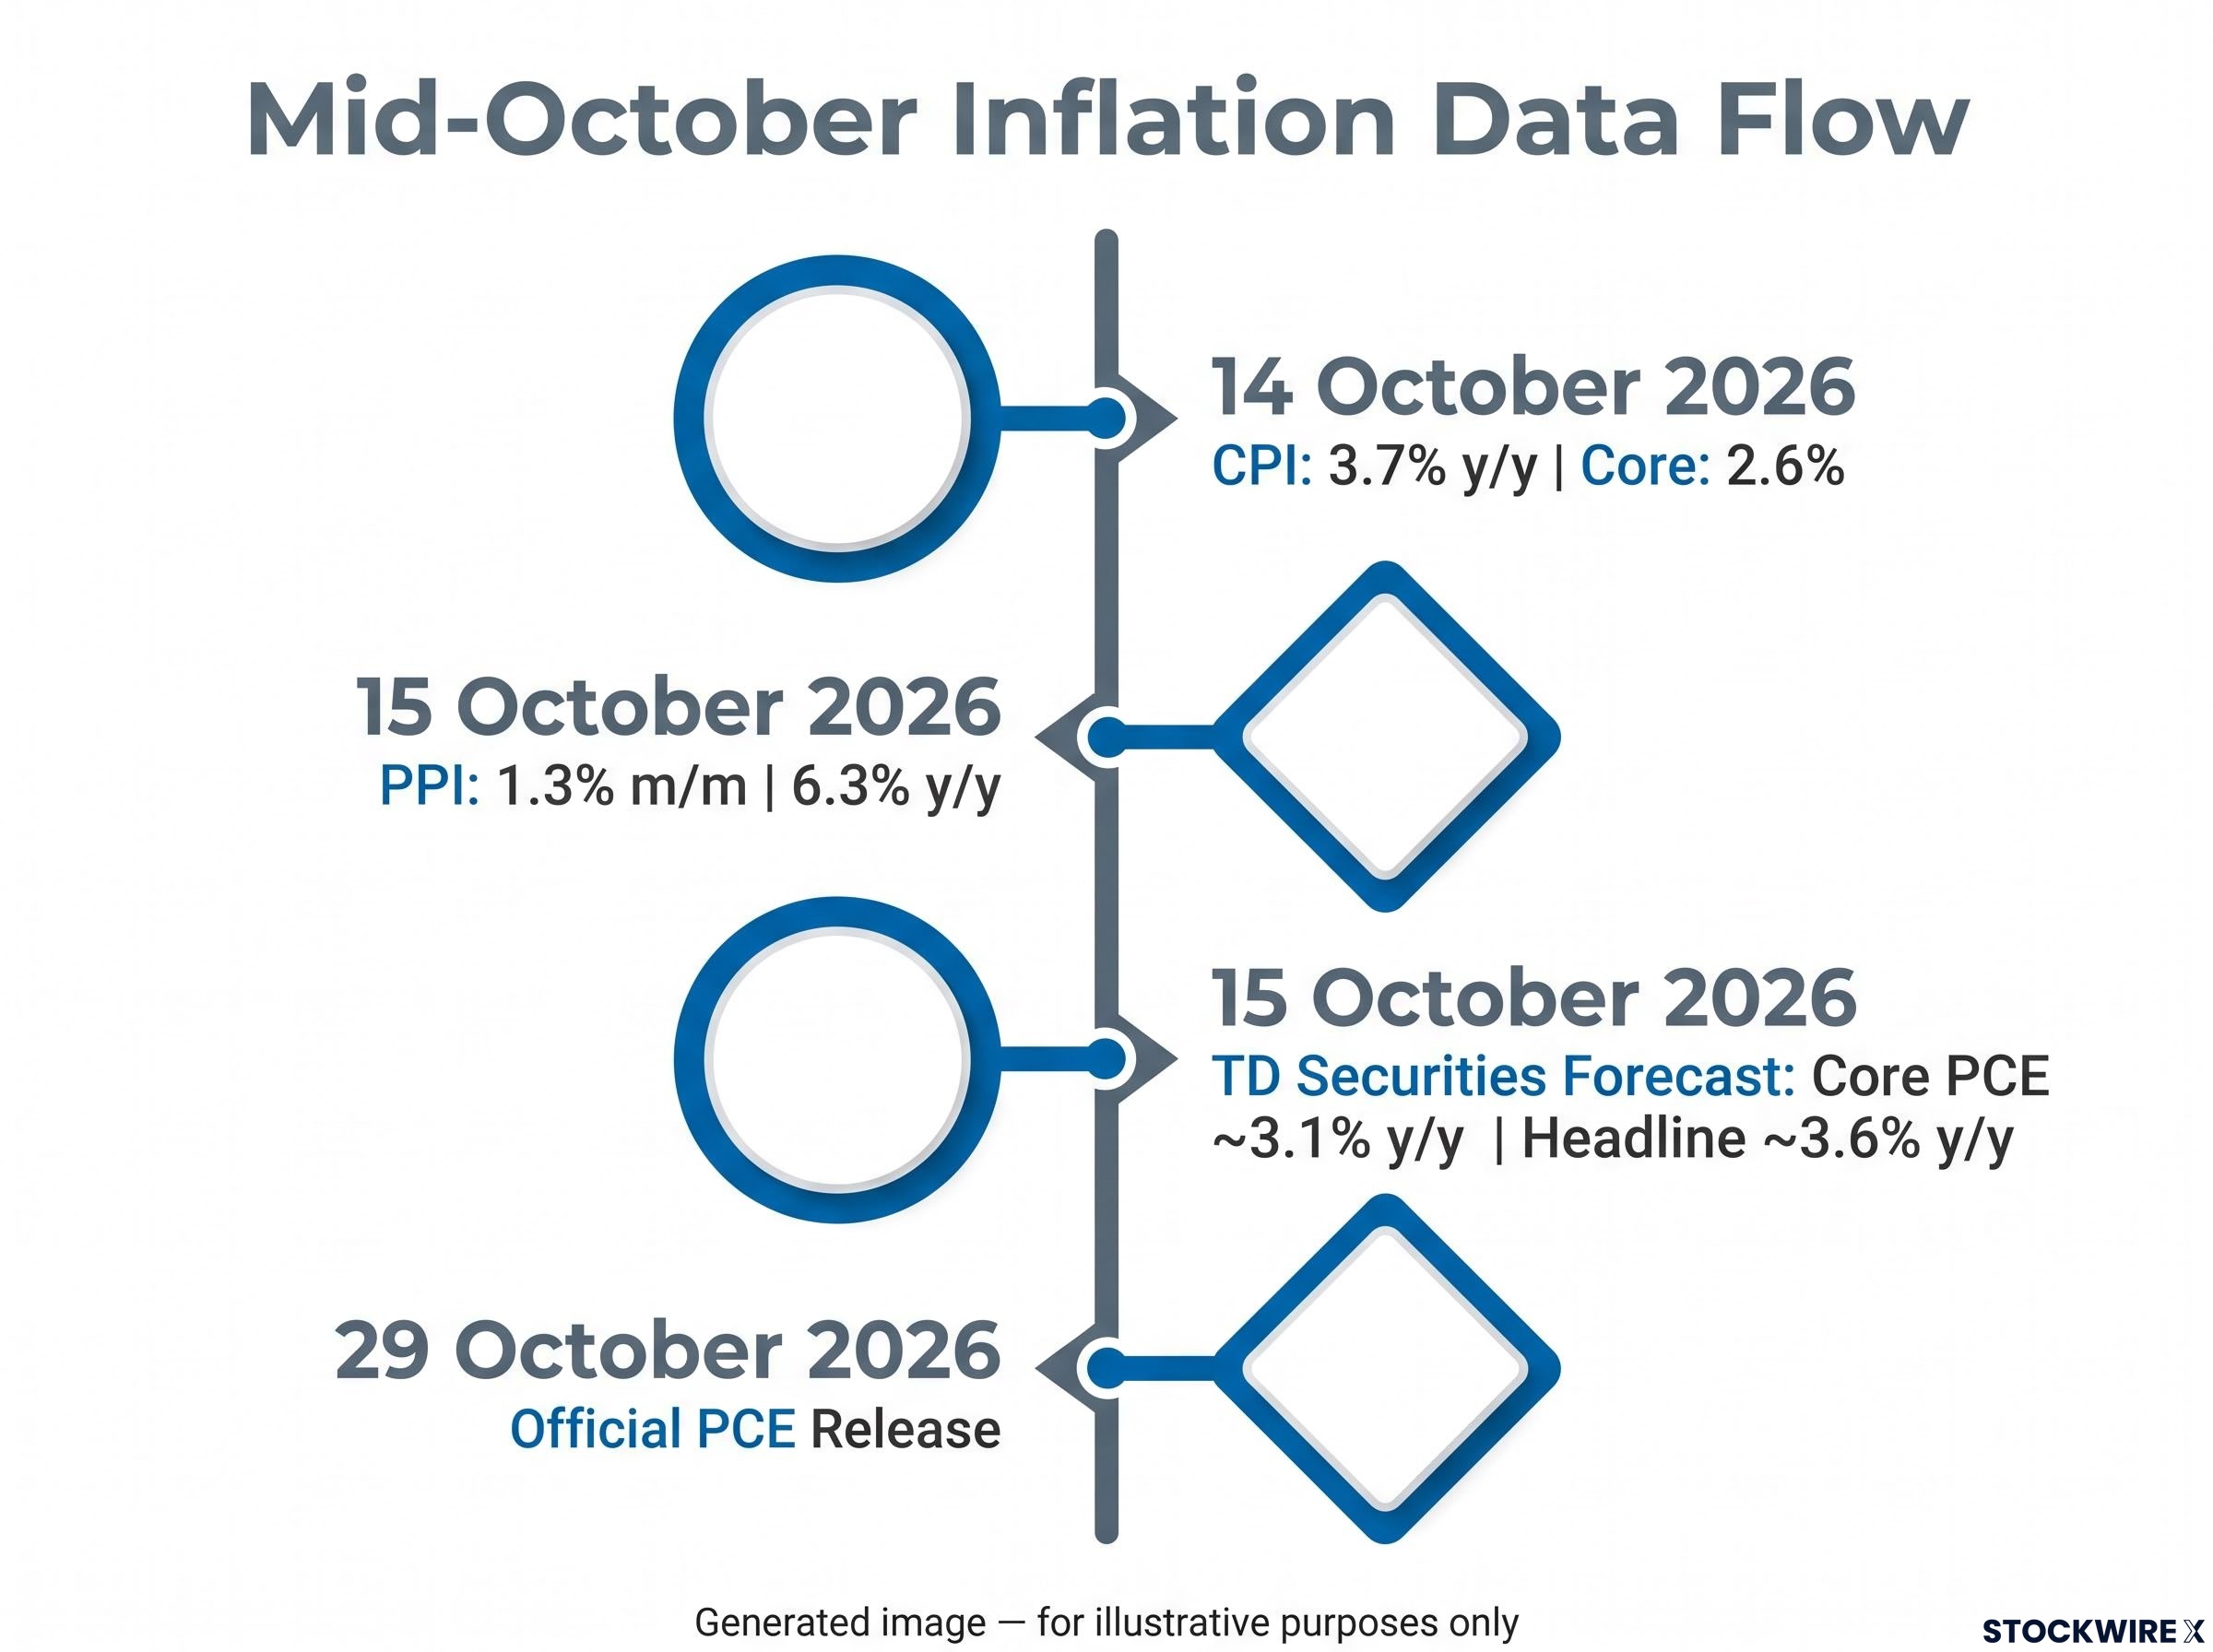
The first readings were hot. On 14 October, the Bureau of Labor Statistics reported September’s Consumer Price Index (CPI), a measure of the prices households pay, up 0.6% for the month and 3.7% year on year. Core CPI, which strips out volatile food and energy, rose 2.6%. A day later, the Producer Price Index (PPI), which tracks prices businesses receive, jumped 1.3% for the month and 6.3% over the year.
Then came a softer note. TD economists Eli Nir and Oscar Munoz lowered their September forecast for Personal Consumption Expenditures (PCE), the Fed’s preferred inflation gauge, because the relevant PPI components came in weaker than expected.
| Indicator | Latest figure | Source/date | Status |
|---|---|---|---|
| CPI (September) | 3.7% y/y, core 2.6% | BLS, 14 October 2026 | Official |
| PPI (September) | 1.3% m/m, 6.3% y/y | BLS, 15 October 2026 | Official |
| Core PCE (September) | 0.32% m/m, about 3.1% y/y | TD Securities, 15 October 2026 | Forecast |
| Headline PCE (September) | 0.49% m/m, about 3.6% y/y | TD Securities, 15 October 2026 | Forecast |
The official September PCE figure is not due until 29 October. Until it arrives, markets may be trading on TD’s estimate rather than confirmed data, so you should keep the two categories apart.
What the officials said
The Fed funds rate sits at 3.75%-4.00% after September’s hike, which Warsh described as removing “a dose of accommodation”. Speaking with IMF Managing Director Kristalina Georgieva in Bangkok, he also named AI investment as a major upward force in the global economy.
Warsh has removed forward guidance and withheld his own rate projection, so single speeches and inflation prints now carry more repricing risk between meetings than they did under previous chairs.
Kevin Warsh, Fed Chair The Fed will “deliver price stability”, Warsh said, while declining to prejudge upcoming meetings.
Erin Browne, US Treasury Undersecretary for International Affairs, warned that disorderly currency swings could force investors to unwind positions, raise cross-market volatility and lift financing costs. She also said Japan is no longer deflationary, a hint that the yen’s level should adjust.
TD expects the Fed to skip October and hike in December. Market pricing points the same way: CME-based reporting put December hike odds near 89.8% on 14-15 October, while Polymarket showed about 80% on 15 October, a gap that reflects venue and timing. The IMF sees US inflation near 3.6% in 2026, with core not back to 2% until mid-2028, and Bank of America expects two more 25 basis point hikes in 2026.
An October pause would not be a dovish signal. You should read “no move now” as patience with tightening still on the table, which keeps a bias in the dollar’s favour even on days it dips.
Why AUD, yen, gold and Bitcoin reacted differently
With that ambiguous mood in place, each asset found its own path. All figures below are snapshots as of around 16 October 2026.
| Asset | Recent move | Main driver | Counter-force |
|---|---|---|---|
| AUD/USD | About 0.6918, down 0.7-0.8% | Weak Australian jobs data, lower RBA hike odds | Softer US dollar after Warsh |
| USD/JPY | About 158.10-158.13 | US-Japan rate differential and carry | Intervention risk |
| Gold | About US$4,167-$4,170/oz, up 1.5-1.6% | Falling dollar and Treasury yields | Hawkish Fed pricing |
| Bitcoin | About US$82,346-$82,400, up 0.8% | Dollar weakness, hedge demand | Higher real yields, tighter liquidity |
AUD and the yen: rates and carry
The Australian dollar slid to about 0.6918-0.6919 after weak Australian employment data. That fall was partly local: the jobs report reduced expectations of a near-term Reserve Bank of Australia (RBA) hike, which amplified pressure from higher US yields. The currency then recovered toward about 0.6945 after Warsh spoke and the dollar softened.
The yen stayed weak, with USD/JPY near 158.10. A hawkish Fed widens the gap between US and Japanese interest rates, which encourages carry trades. A carry trade means borrowing in a low-yielding currency to invest in a higher-yielding one. That keeps the yen soft even when sentiment is nervous, although Browne’s warning raises the risk of official intervention.
Gold and Bitcoin: the dollar and the hedge question
Gold pays no interest, so higher real yields and a stronger dollar usually weigh on it. Real yields are bond yields after subtracting inflation. Gold rose this time because the dollar and Treasury yields fell after Warsh’s comments, and that drop is the hinge of the whole episode.
Bitcoin straddles two identities. It trades partly as a high-risk asset, hurt by higher yields and tighter liquidity, and partly as a hedge against inflation and currency debasement. Its correlations are unstable, which helps explain why it held above US$82,000 while the yen and AUD weakened.
When you see inflation news, ask first what it does to the dollar and real yields. That second step, not the headline itself, usually decides how gold, AUD and Bitcoin trade.
Where the risk on risk off framework breaks down
That two-step check works well, until it does not. The October episode had every ingredient for a clean risk-off move, yet gold rose, AUD fell, the yen stayed weak and Bitcoin held firm. Here are the conditions under which the model tends to fail:
- Correlations are conditional. AUD tracks China and commodities, Bitcoin tracks crypto flows and ETF demand, and gold can rise in risk-on periods if real yields fall.
- The dollar can rise for different reasons. A global funding squeeze can lift it even while US yields fall.
- The yen’s safe-haven role can fail. Low yields and carry positioning can keep it weak under stress.
- Intervention and communication shift prices. Official comments can move expectations without any policy change, and intervention risk creates abrupt two-way yen moves.
- Data is pending or revised. September PCE is still outstanding, and CPI, PPI and PCE all get revised.
- Inflation composition matters. Energy-led spikes may fade, while services and wage pressure can stick. The IMF has warned that energy and technology-investment shocks could create second-round effects, meaning initial price rises feed into wages and further price increases.
Erin Browne, US Treasury Undersecretary for International Affairs Browne warned that sharp, disorderly currency movements could force investors to unwind positions, raise volatility across markets and push up financing costs.
Several catalysts could test the framework again soon: the 29 October PCE release, the next Federal Open Market Committee (FOMC) meeting, any Japanese intervention signals and the Bank of Japan’s December outlook. Franklin Templeton sees a December BoJ hike as plausible given resilient wages.
Energy-led spikes can fade quickly, as gasoline prices falling about 11.5% from their peak showed earlier this year, while services and wage pressure tend to stick around much longer.
Treat the framework as a first read of sentiment, then check each asset’s specific drivers before you act. The exceptions are often where the real information sits.
What the mixed signals mean, and what to watch before the next Fed decision
Inflation data and official commentary shape sentiment mainly through the dollar and yields, and each asset then layers on its own local driver. Before the next Fed decision, four variables deserve your attention:
- The official September PCE release on 29 October
- Fed commentary around the next meeting
- December hike pricing across CME-based and prediction-market venues
- Any signals of Japanese currency intervention
Every figure here is a snapshot as of around 16 October 2026 and may already have moved. If the official PCE number confirms TD’s softer estimate, the read on December may shift quickly.
Past performance does not guarantee future results. Financial projections are subject to market conditions and various risk factors. These statements are speculative and subject to change based on market developments.
This article is for informational purposes only and should not be considered financial advice. Investors should conduct their own research and consult with financial professionals before making investment decisions.
—