The US dollar index had every reason to rally this week. Consumer prices, retail sales and producer prices all ran hotter than expected within three days. Yet by Asian trading on Friday, the DXY had slipped to around 101.90, just under the lower edge of the ascending channel it had climbed for weeks.
That sequence trips up a lot of dollar watchers, because strong data is supposed to mean a stronger currency. This time, it did not.
The timing matters. The index had gained more than 3% since early September and touched an 18-month high on 14 October, so a pullback now affects anyone holding dollar assets, trading major pairs or planning a currency conversion. The Federal Reserve meets on 27-28 October, and Fed Chair Kevin Warsh spoke today without tipping his hand.
Here is how to weigh the technical levels against the macro data and Fed signals, and which levels will decide whether this is a pause or the start of a reversal. This is informational analysis, not investment advice.
Why did the dollar slip when inflation data ran hot?
The puzzle is simple to state. Three major US releases beat forecasts, and the currency that should have benefited ended the week softer.
What the data showed
| Indicator (September data) | Actual | Consensus |
|---|---|---|
| Headline CPI | +0.6% m/m; +3.7% y/y | +0.6% m/m; +3.6% y/y |
| Core CPI | +0.3% m/m; +2.6% y/y | +0.2% m/m; +2.5% y/y |
| Retail sales | +0.8% m/m | +0.3% m/m |
| Headline PPI | +1.3% m/m; +6.3% y/y | +0.6% m/m; +5.5% y/y |
The producer price index (PPI), which tracks prices businesses receive for their output, delivered the biggest shock. Its 1.3% monthly rise was the largest since March 2022, driven heavily by goods and energy, while core PPI rose 0.7%. August retail sales were also revised up from 1.1% to 1.3%.
Commerzbank’s Thu Lan Nguyen read the sequence as evidence of increasingly broad-based price pressures. On paper, that is a hawkish case for the dollar.
Why the dollar did not hold
The gains faded for several layered reasons:
- Hawkishness was already priced. Markets had anticipated much of this.
- Fed officials signalled patience. Michelle Bowman and Mary Daly suggested the Fed could wait for clearer evidence before October.
- Treasury yields fell. Bonds rallied after the initial reaction, removing a key prop for the dollar.
- The AI trade wobbled. CNBC linked part of the move to a shakeout in AI-related data-centre securities, which dented flows into US assets.
- Strategists stayed sceptical. A Reuters poll on 2 October found strategists expected the dollar to surrender most of its rally over the following year.
Already in the price LMAX strategist Joel Kruger said the hot PPI added to CPI-driven inflation worries, but much of the resulting Fed hawkishness was already embedded in yields and the dollar, leaving limited room to climb.
The final layer is timing. October hike odds briefly rose to around 50% after CPI, then CNBC reported a 72% probability of no October change once Bowman and Daly spoke. Traders read the data as support for a December move, not an immediate one.
The muted reaction to a hot print reflects CPI surprise asymmetry: when hike odds are already elevated in Fed funds futures, upside for the dollar is capped while disappointments carry more downside.
The lesson for you: a data beat only moves a currency when it shifts expectations. This week’s numbers mostly confirmed what yields had already discounted, so chasing the headline reaction would have meant buying a move that was already over.
When big ASX news breaks, our subscribers know first
How to read DXY technical signals alongside macro data
If the data explains why the dollar should move, the chart shows whether it actually is. Reading both together gives you a far clearer picture than either alone.
The indicators explained
An ascending channel is a pair of rising parallel lines drawn along a price’s higher lows and higher highs. Trading inside it suggests an orderly uptrend.
An exponential moving average (EMA) is an average of recent closing prices that gives more weight to the latest days. The 9-day EMA tracks very short-term momentum, while the 50-day EMA tracks the medium-term trend.
The 14-day Relative Strength Index (RSI) measures the speed of recent gains and losses on a 0-100 scale. Readings above 70 are usually considered overbought.
| Indicator | Current reading | What it measures | What it suggests now |
|---|---|---|---|
| Ascending channel | Lower edge slightly breached near 101.90 | Structure of the uptrend | Momentum fading, not confirmed broken |
| 9-day EMA | About 102.07 | Short-term momentum | Immediate resistance being probed |
| 50-day EMA | About 100.87 | Medium-term trend | Price still above, bias still bullish |
| 14-day RSI | 57.40 | Momentum strength | Positive, not overbought |
What the current readings say together
Put together, the readings are mixed rather than decisive. EBC Financial Group had the index at 101.99 on 15 October, while Reuters recorded 102.06, and the recent high varies between about 102.55 and 102.95 depending on the source and data feed. Above sits the upper wedge boundary at 103.70; below, the five-month low of 98.56 set on 20 August.
A marginal break below a channel can mislead. Keep these caveats in mind:
- The break is slight and could reverse within sessions.
- It may be a liquidity hunt, where price dips to trigger stop-loss orders clustered below support before recovering.
- Data revisions, like August’s retail sales upgrade, can change the macro story underneath the chart.
A marginal channel break with RSI at 57 tells you momentum is pausing, not that the trend has failed. Treat it as a prompt to watch for confirmation rather than as a trading signal. Technicals describe momentum; the Fed explains why it shifts.
For readers wanting to build the chart skills used here, our full explainer on DXY technical analysis shows how EMA and RSI readings tie back to Fed policy.
What Warsh’s restraint and the hawkish policy tone signal for the dollar
That brings the focus to the Fed. With inflation running hot, many expected Warsh to lean hawkish at the IMF meeting in Bangkok today.
What Warsh said, and what he did not
He did the opposite of adding fuel. Warsh said he would not prejudge the 27-28 October decision, avoided committing on December and reiterated the Fed’s duty to deliver price stability. He described himself as “over-scarred” by the global financial crisis, signalling a bias towards risk management.
Warsh’s refusal to prejudge October is easier to interpret once you understand the Fed communication tools behind it: the dual mandate, voting structure and forward guidance all shape how much weight a single speech deserves.
Warsh on policy and AI Warsh declined to prejudge the October decision. On artificial intelligence, he called it potentially the most consequential economic change of his lifetime, while warning the transition would be “very bumpy.”
AI muddies the inflation outlook because it could boost productivity over time while affecting demand before supply in the near term. FXStreet’s Speechtracker scored the remarks 5.6/10, below the 6.1/10 historical average. Bloomberg reported the comments reinforced expectations of an October hold, and the dollar weakened against the Australian dollar and yen afterwards.
Reading the sentiment gauge
The FXS Fed Sentiment Index, which scores how hawkish Fed communication sounds, sits unchanged at 127.51. That is hawkish territory and supportive for the dollar, though it has cooled from earlier highs.
Market pricing tells the same story of patience:
- Odds now favour no change in October, after briefly nearing 50% for a hike.
- A 25 basis point December hike is priced as the more likely next move.
- OCBC, Commerzbank and ING share a base case of an October hold followed by a largely priced December hike.
Because the Fed chair declined to add hawkish guidance, the policy support for the dollar is already in the price. Further upside for you would require new information, not repeated rhetoric.
How the dollar fared against major currencies, and what could change the outlook
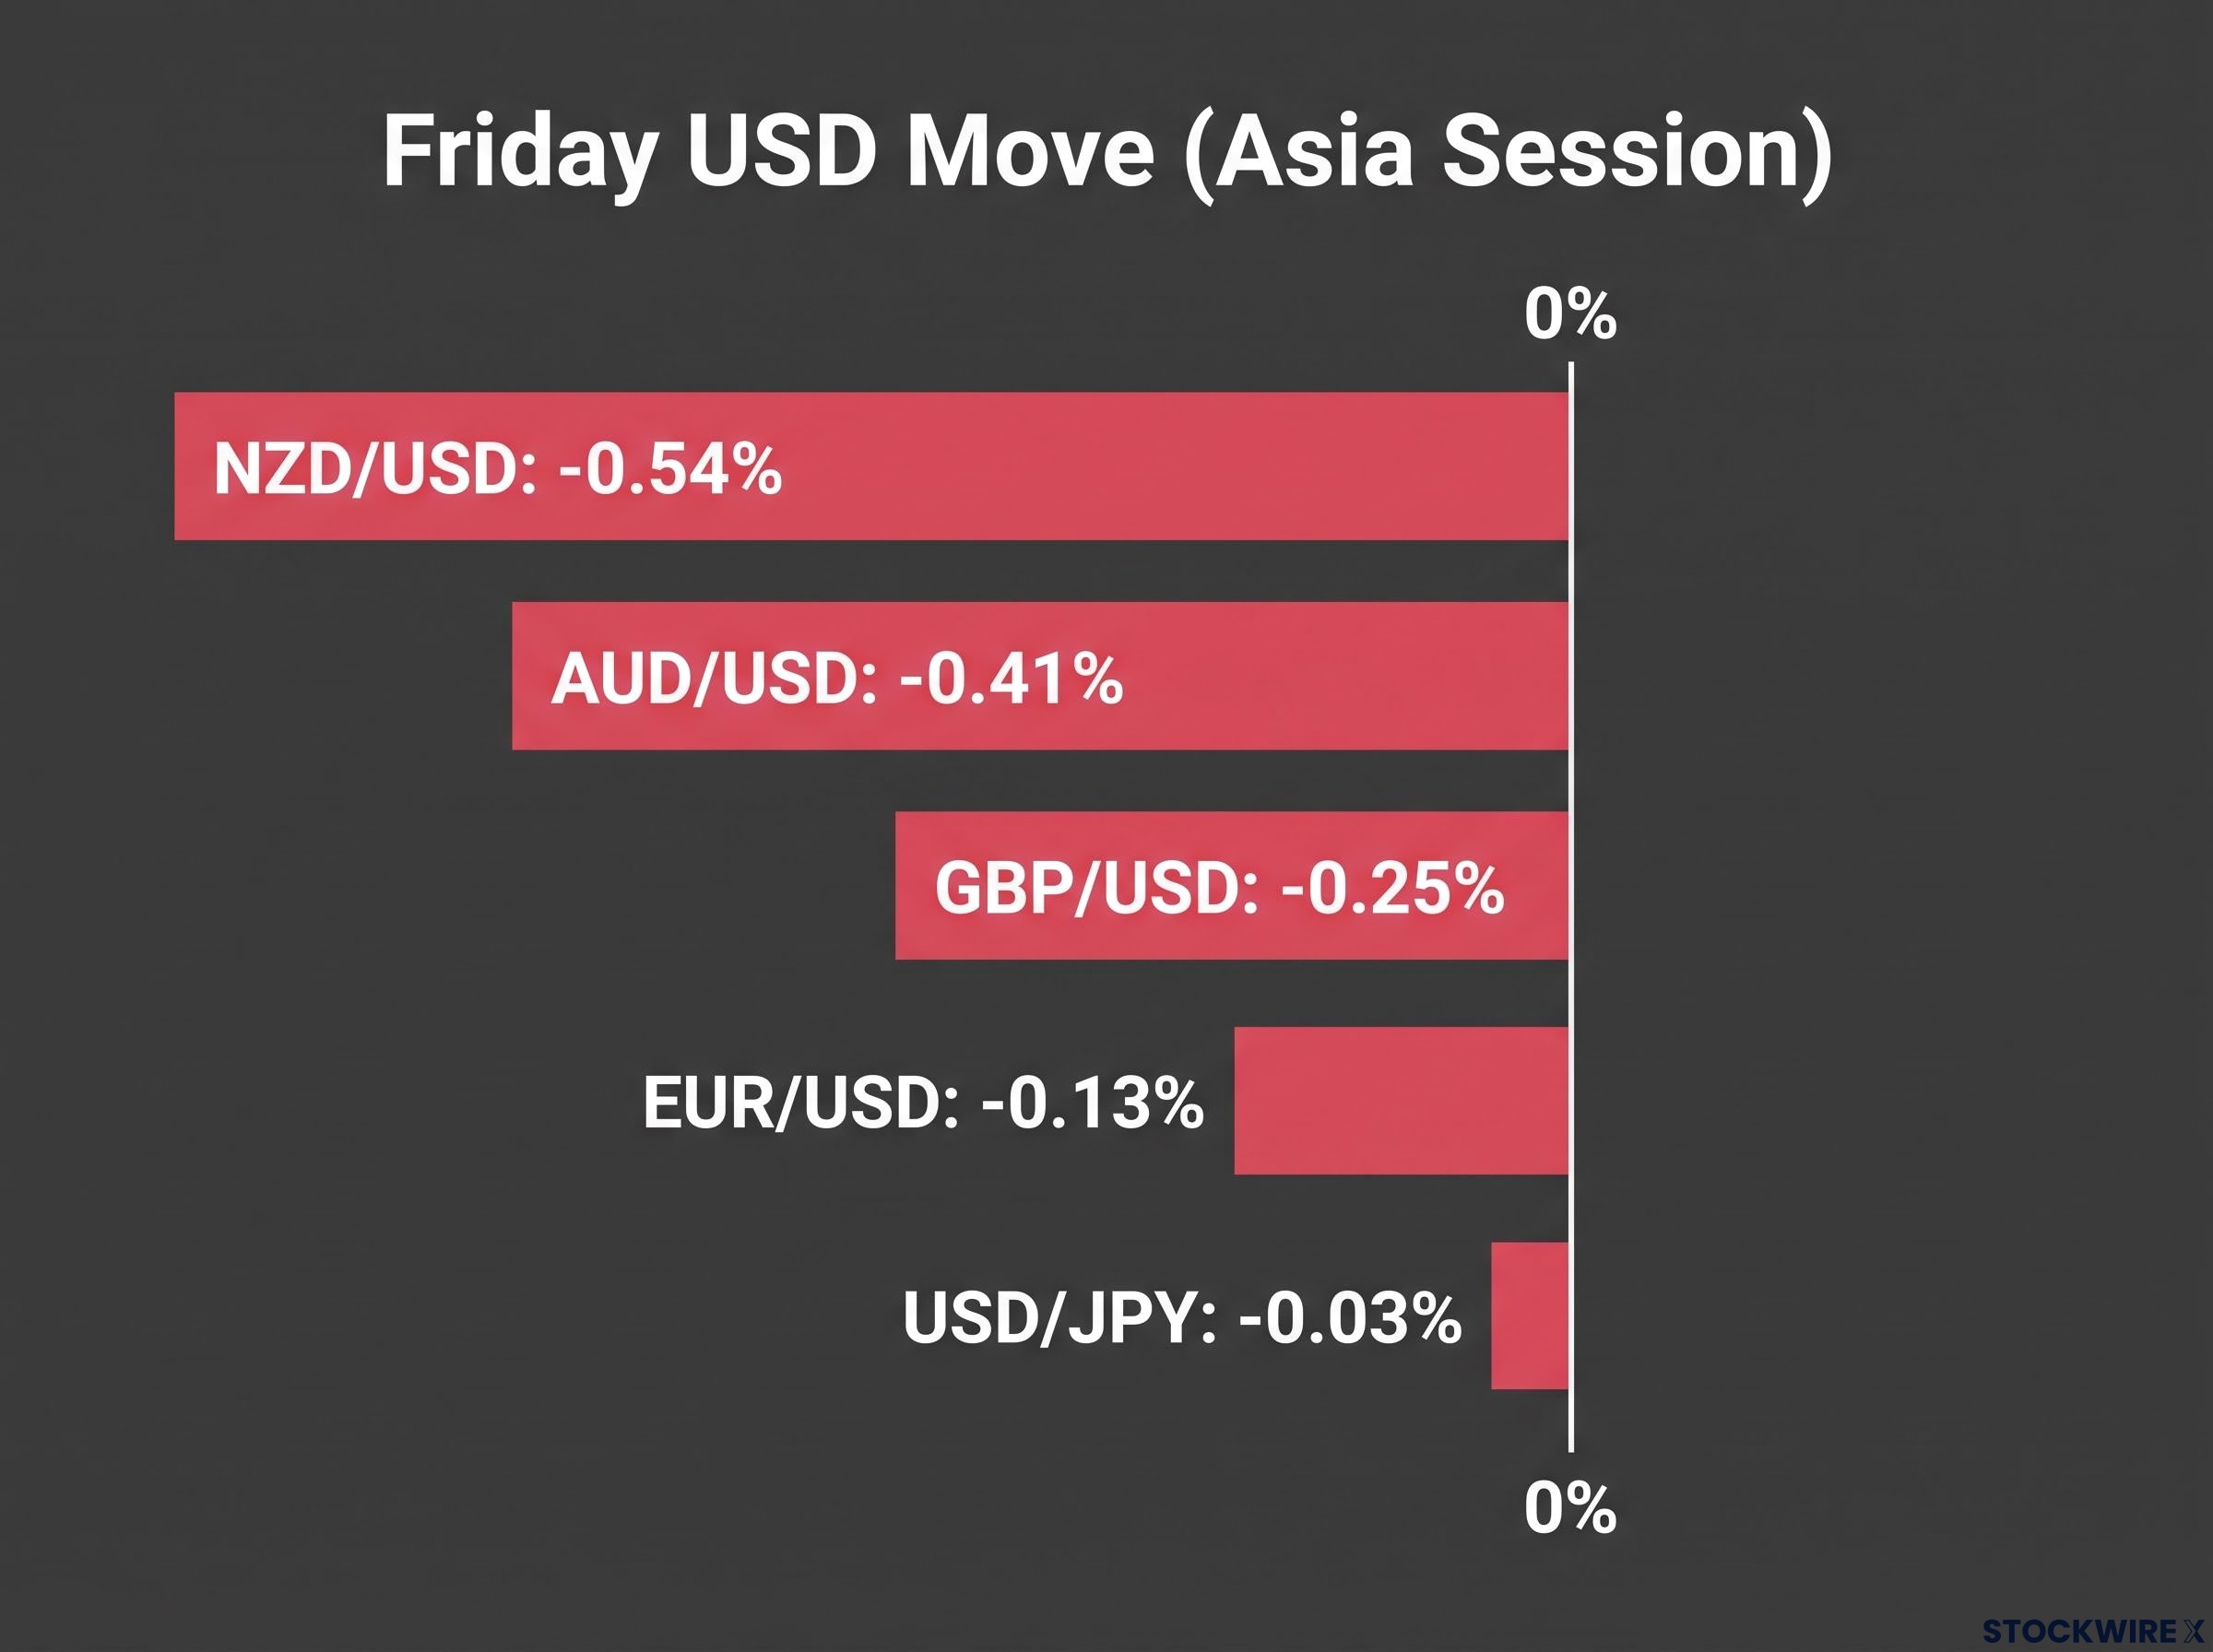
The softness showed up across the board on Friday, but not evenly.
Cross-currency picture
| Pair | Level (CNBC, Asia session) | Friday USD move | Note |
|---|---|---|---|
| EUR/USD | ~1.1210 | -0.13% vs EUR | Modest dollar slip |
| USD/JPY | ~158.13 | -0.03% vs JPY | Near flat |
| GBP/USD | ~1.3270 | -0.25% vs GBP | Sterling up on the week |
| AUD/USD | ~0.6921 | -0.41% vs AUD | Strong Friday rebound |
| NZD/USD | ~0.5621 | -0.54% vs NZD | Dollar’s weakest pair |
FXStreet data also showed the dollar down 0.07% against the Canadian dollar and 0.06% against the Swiss franc. Levels vary by publication time.
The DXY is a weighted basket, so yields can support the dollar overall while currencies with improving domestic outlooks, such as sterling and the antipodean dollars, still outperform it.
Scenarios and levels to watch
The bullish case needs a rebound into the channel and a close above the 9-day EMA. The bearish case needs a failure there, followed by breaks of support. Key levels, from nearest resistance to deepest support:
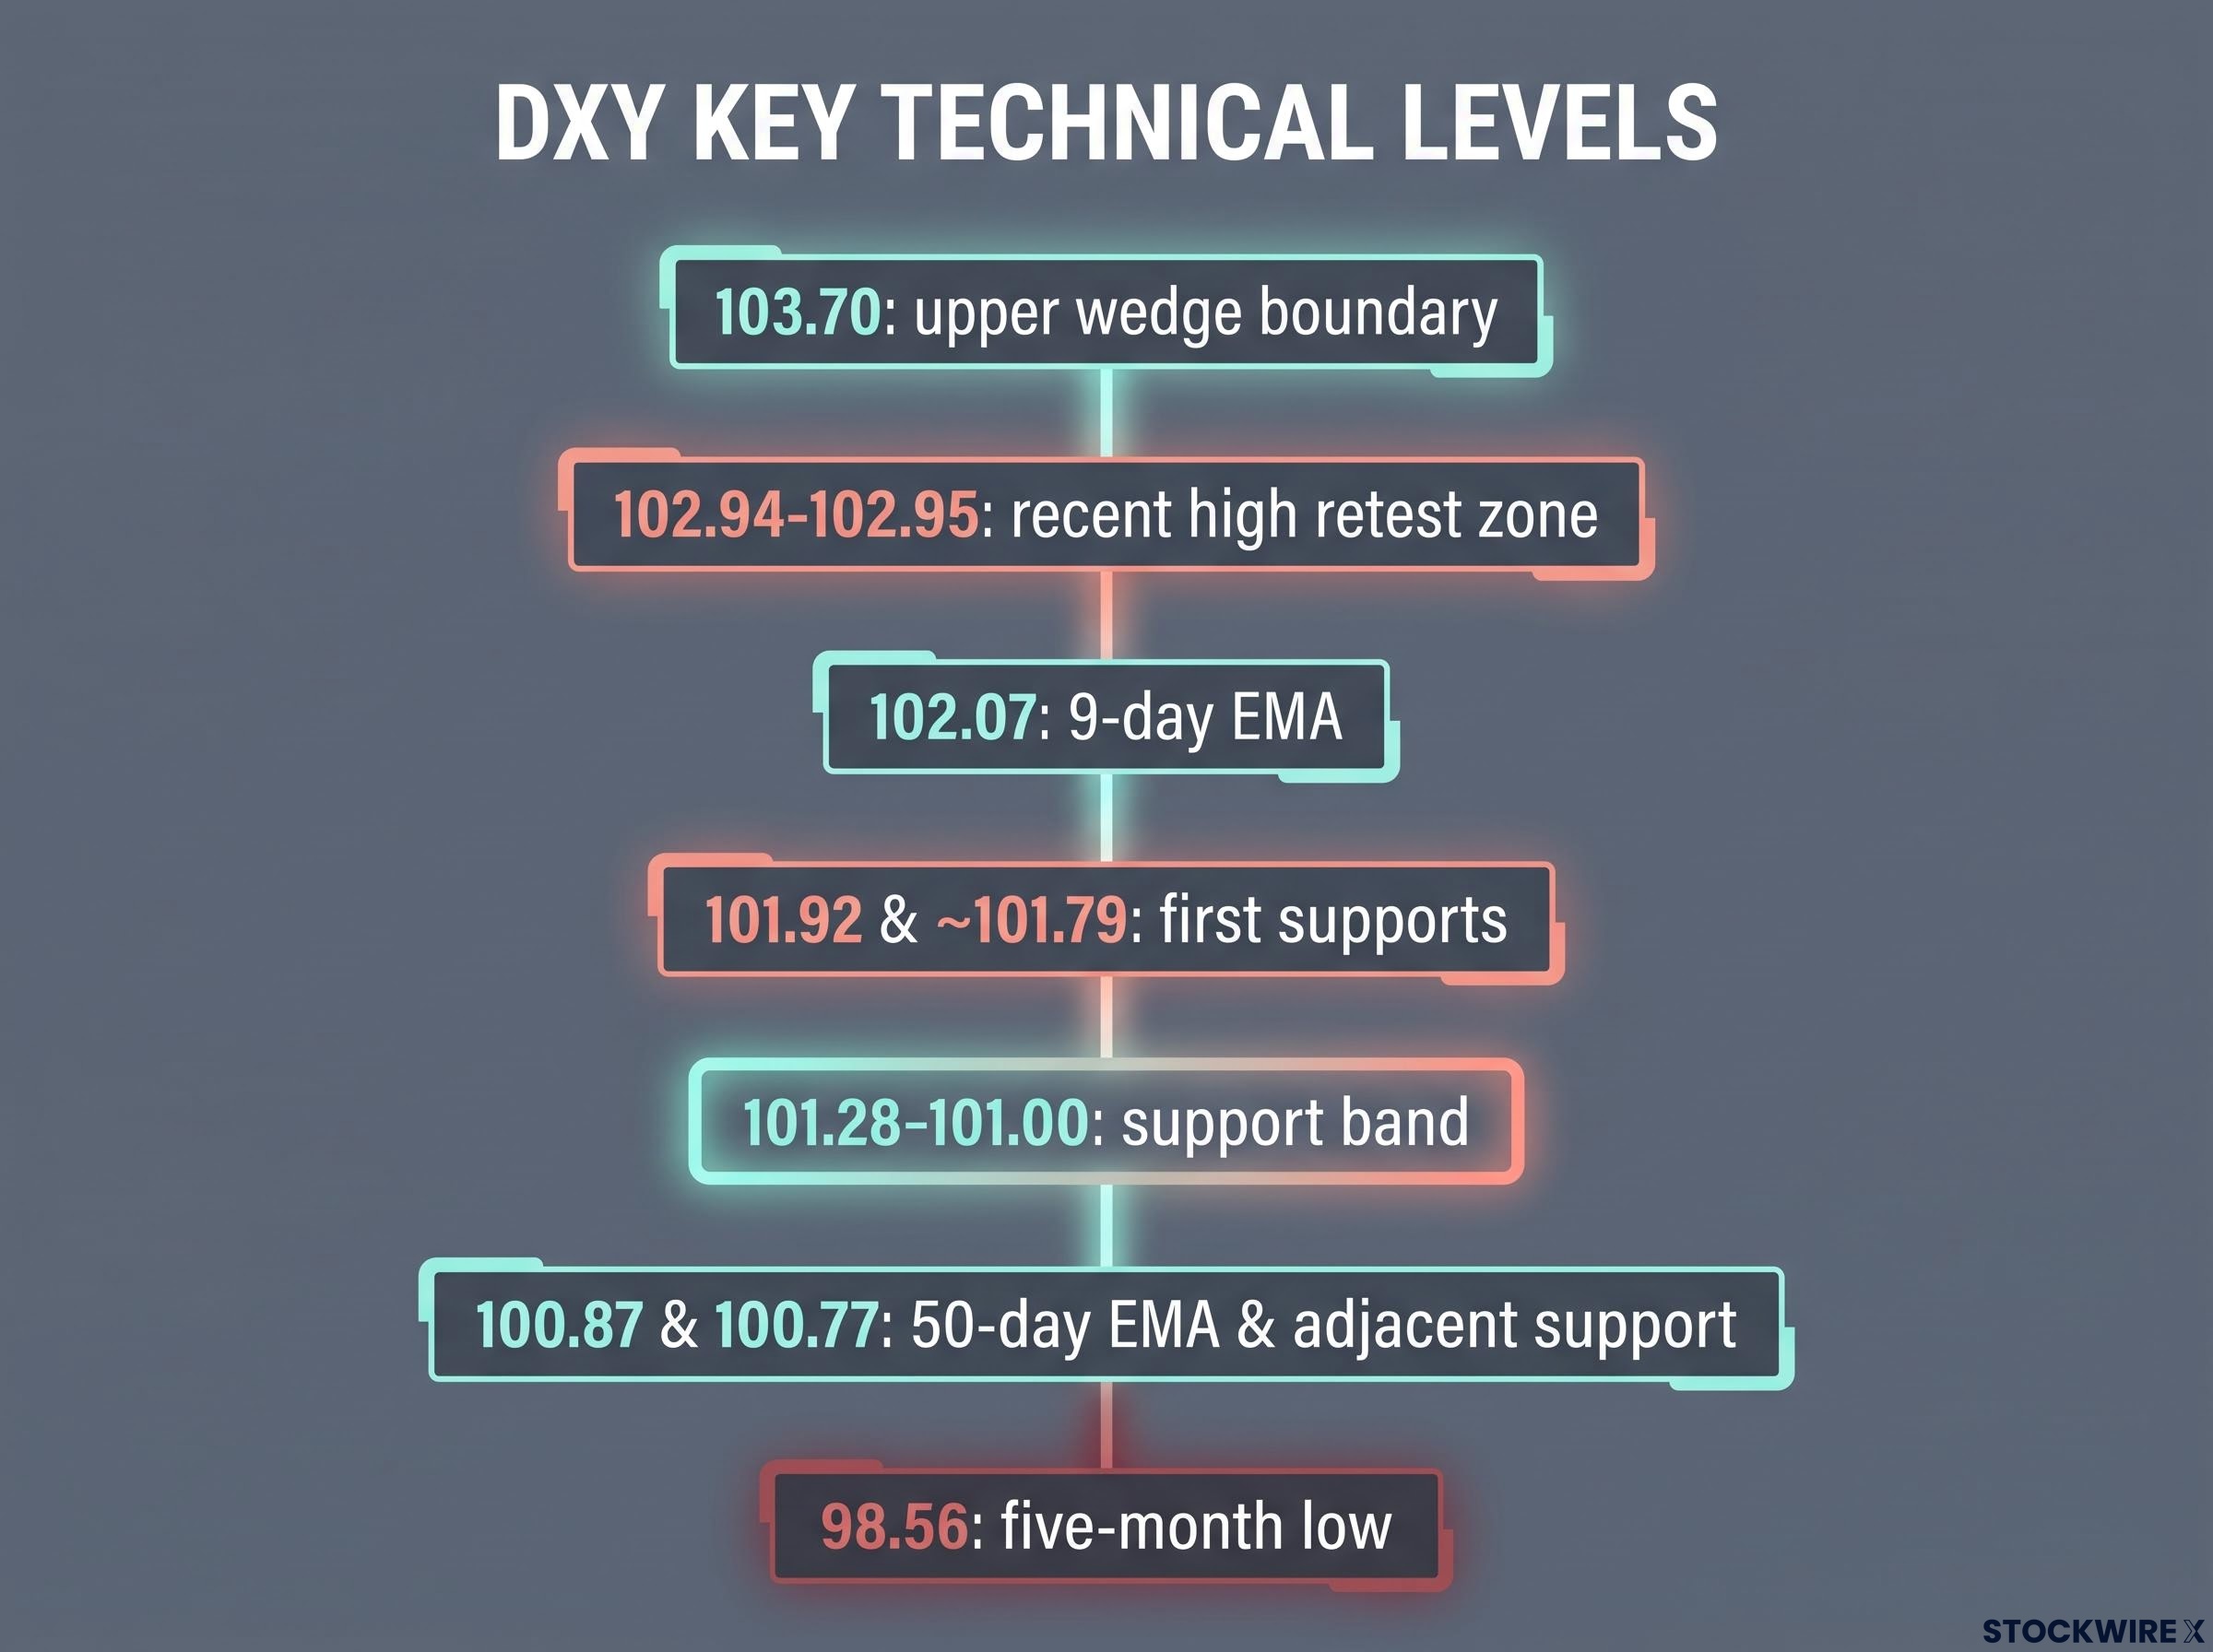
- 103.70: upper wedge boundary
- 102.94-102.95: recent high retest zone
- 102.07: 9-day EMA
- 101.92 and ~101.79: first supports
- 101.28-101.00: support band
- 100.87 and 100.77: 50-day EMA and adjacent support
- 98.56: five-month low
The main risks to either path:
- A false channel break that reverses quickly
- Unwinding of long-dollar positions built since September
- Tariff or energy-driven inflation without durable real-rate support
- Fiscal and Treasury-supply worries reducing foreign demand
- AI-related volatility in equities and yields
Hot data or hawkish talk lifting a currency briefly, then fading once priced, is a recurring pattern, though this October is the best verified recent example. For you, the dividing lines are the 9-day EMA, 101.00 support and the October FOMC decision. These are conditional scenarios, not predictions, and past price behaviour does not guarantee future results.
What the pullback changes, and what it does not
The hot data was largely priced before it landed. The Fed is signalling patience rather than fresh hawkishness, and the chart shows a pause above the 50-day EMA, not a confirmed reversal. The evidence is mixed.
What has changed is the burden of proof. Bulls now need a reclaim of the 9-day EMA, while bears need a decisive break through the 101.00-100.77 zone. The 27-28 October FOMC meeting is the next event that could tip either way.
Apply the same data-plus-technicals lens to your own dollar exposure: ask whether new information has shifted expectations, then check whether the chart confirms it. This analysis reflects conditions as of 16 October 2026.
Because December hike pricing is already embedded, rate-sensitive portfolio positioning matters more than any single headline reaction, and the Fed’s recent hawkish shift shows how quickly expectations can be repriced.
This article is for informational purposes only and should not be considered financial advice. Investors should conduct their own research and consult with financial professionals before making investment decisions. Forward-looking statements are speculative and subject to change based on market developments.