Somebody spent roughly $13.4 million on Tesla calls near the close on Tuesday, 13 October. The order covered about 4,877 contracts of Tesla April 2027 call options at the $430 strike, where only about 40 contracts of open interest existed beforehand.
That is a loud print. The harder question is whether it is a signal worth following or simply a large number that sounds like one.
The timing gives it weight. Tesla is the only Magnificent Seven stock in negative territory this year, the long-delayed Roadster event was scheduled for 15 October, and third-quarter earnings arrive after the close on 21 October. The trade details come from a single presenter’s reading of the options tape on Tasty Live and had not been confirmed in a named publication as of 16 October.
Here is a working method for telling conviction apart from noise when big options trades make headlines, with this trade as the worked example.
What does a $13.4 million call purchase on Tesla actually tell you?
At first glance, the trade reads as a giant bullish bet. Look closer and it becomes something more precise: a position with a known price hurdle, a fixed deadline and a cost that is already sunk.
A call option gives the buyer the right, but not the obligation, to buy shares at a set price (the strike) before a set date (the expiry). Here the strike is $430 and the expiry is April 2027.
| Metric | Figure |
|---|---|
| Contracts bought | 4,877 |
| Premium paid | $13.4M |
| Strike price | $430 |
| Break-even at expiry | $457.45 |
| Required gain | 24.6% |
| Prior open interest | About 40 contracts |
Why the position looks new
Open interest is the number of contracts still outstanding at a given strike. With roughly 40 before the trade and volume about 122 times that, the position appears to have been built almost from scratch rather than shuffled between existing holders.
That suggests fresh exposure. It does not establish why the buyer wanted it.
The hurdle in context
Break-even is the share price at expiry where the call covers its cost. At $457.45, Tesla needs a 24.6% rise, yet that level still sits below the stock’s 52-week high of $498.883.
The break-even gap is what separates similar-sized prints: two roughly $15 million call purchases can require a 4.8% rise in one stock and a 25.6% rise in another.
Signal versus noise The Tasty Live presenter framed the signal as conviction shown through a sizeable new position, and the noise as the steep hurdle of a roughly 25% rally.
The roughly six-month window spans two earnings reports, the Roadster event, delivery figures, margin updates and autonomy developments. The buyer is not paying for a quick pop; they are paying for a sustained re-rating. For you, the read is that a 25% move is demanding but not unprecedented for a stock that has traded far higher within the past year.
When big ASX news breaks, our subscribers know first
How does the October 23 $395 call compare with the April bet?
The same tape showed a second bullish trade. About $1.07 million went into the 23 October $395 call, which covers the Roadster event and the earnings report and expires two days after results.
| Attribute | April 2027 $430 | Oct 23 $395 |
|---|---|---|
| Premium | $13.4M | $1.07M |
| Strike | $430 | $395 |
| Expiry | April 2027 | 23 October 2026 |
| Catalysts covered | Two earnings reports, Roadster, deliveries, margins, autonomy | Roadster event, Q3 earnings |
| Primary risk | Gradual failure to re-rate | Rapid time decay after a weak reaction |
Two risks dominate the short-dated contract. Time decay is the value an option loses each day as expiry approaches, and gamma measures how sharply an option’s sensitivity to the share price changes as the stock moves. Near expiry, both are intense: a strong reaction can multiply the contract’s value quickly, while a stumble can wipe it out within days.
Options currently price an earnings move of about 6.2%, a range of roughly $339 to $384, although other sources cite about 5.3% or 7.5% depending on method. Tesla’s record shows why that estimate is a poor ceiling:
- EPS missed in seven of the last eight reports, according to the original source
- Five of those eight produced moves smaller than priced, averaging about 3.5%
- The other three averaged about 15% in a single session
- The October 2024 beat was followed by a 22% next-day gain per the original source (a secondary source cites about 18.6%, unverified and likely a measurement difference)
- In July 2026, shares reportedly fell about 19.3% (unverified)
The Roadster adds its own uncertainty. It has been delayed five times and anticipated for almost a decade, and no confirmed post-event account was available as of 16 October.
A comparable wave of event-driven Tesla calls a year earlier was timed around a Roadster reveal that never happened, a reminder that short-dated buyers carry date risk on top of direction risk.
If you weigh a short-dated call, price in both outcomes: outsized upside and rapid total loss. The April position fails slowly; the October one can fail overnight.
Does Tesla’s valuation support a 25% rally?
On relative performance alone, a catch-up trade sounds reasonable. Tesla is down about 19.4% since the start of 2026, according to a 16 October MarketBeat update. Earlier readings of 14.6% (original source) and 17.6% (247WallSt, 15 October) reflect different measurement dates.
The catch-up case
The rest of the group has moved the other way:
- Apple: up about 25%
- Nvidia: up 23%
- Amazon: up 13%
- Microsoft and Alphabet: up about 11%
- Meta: up about 9%
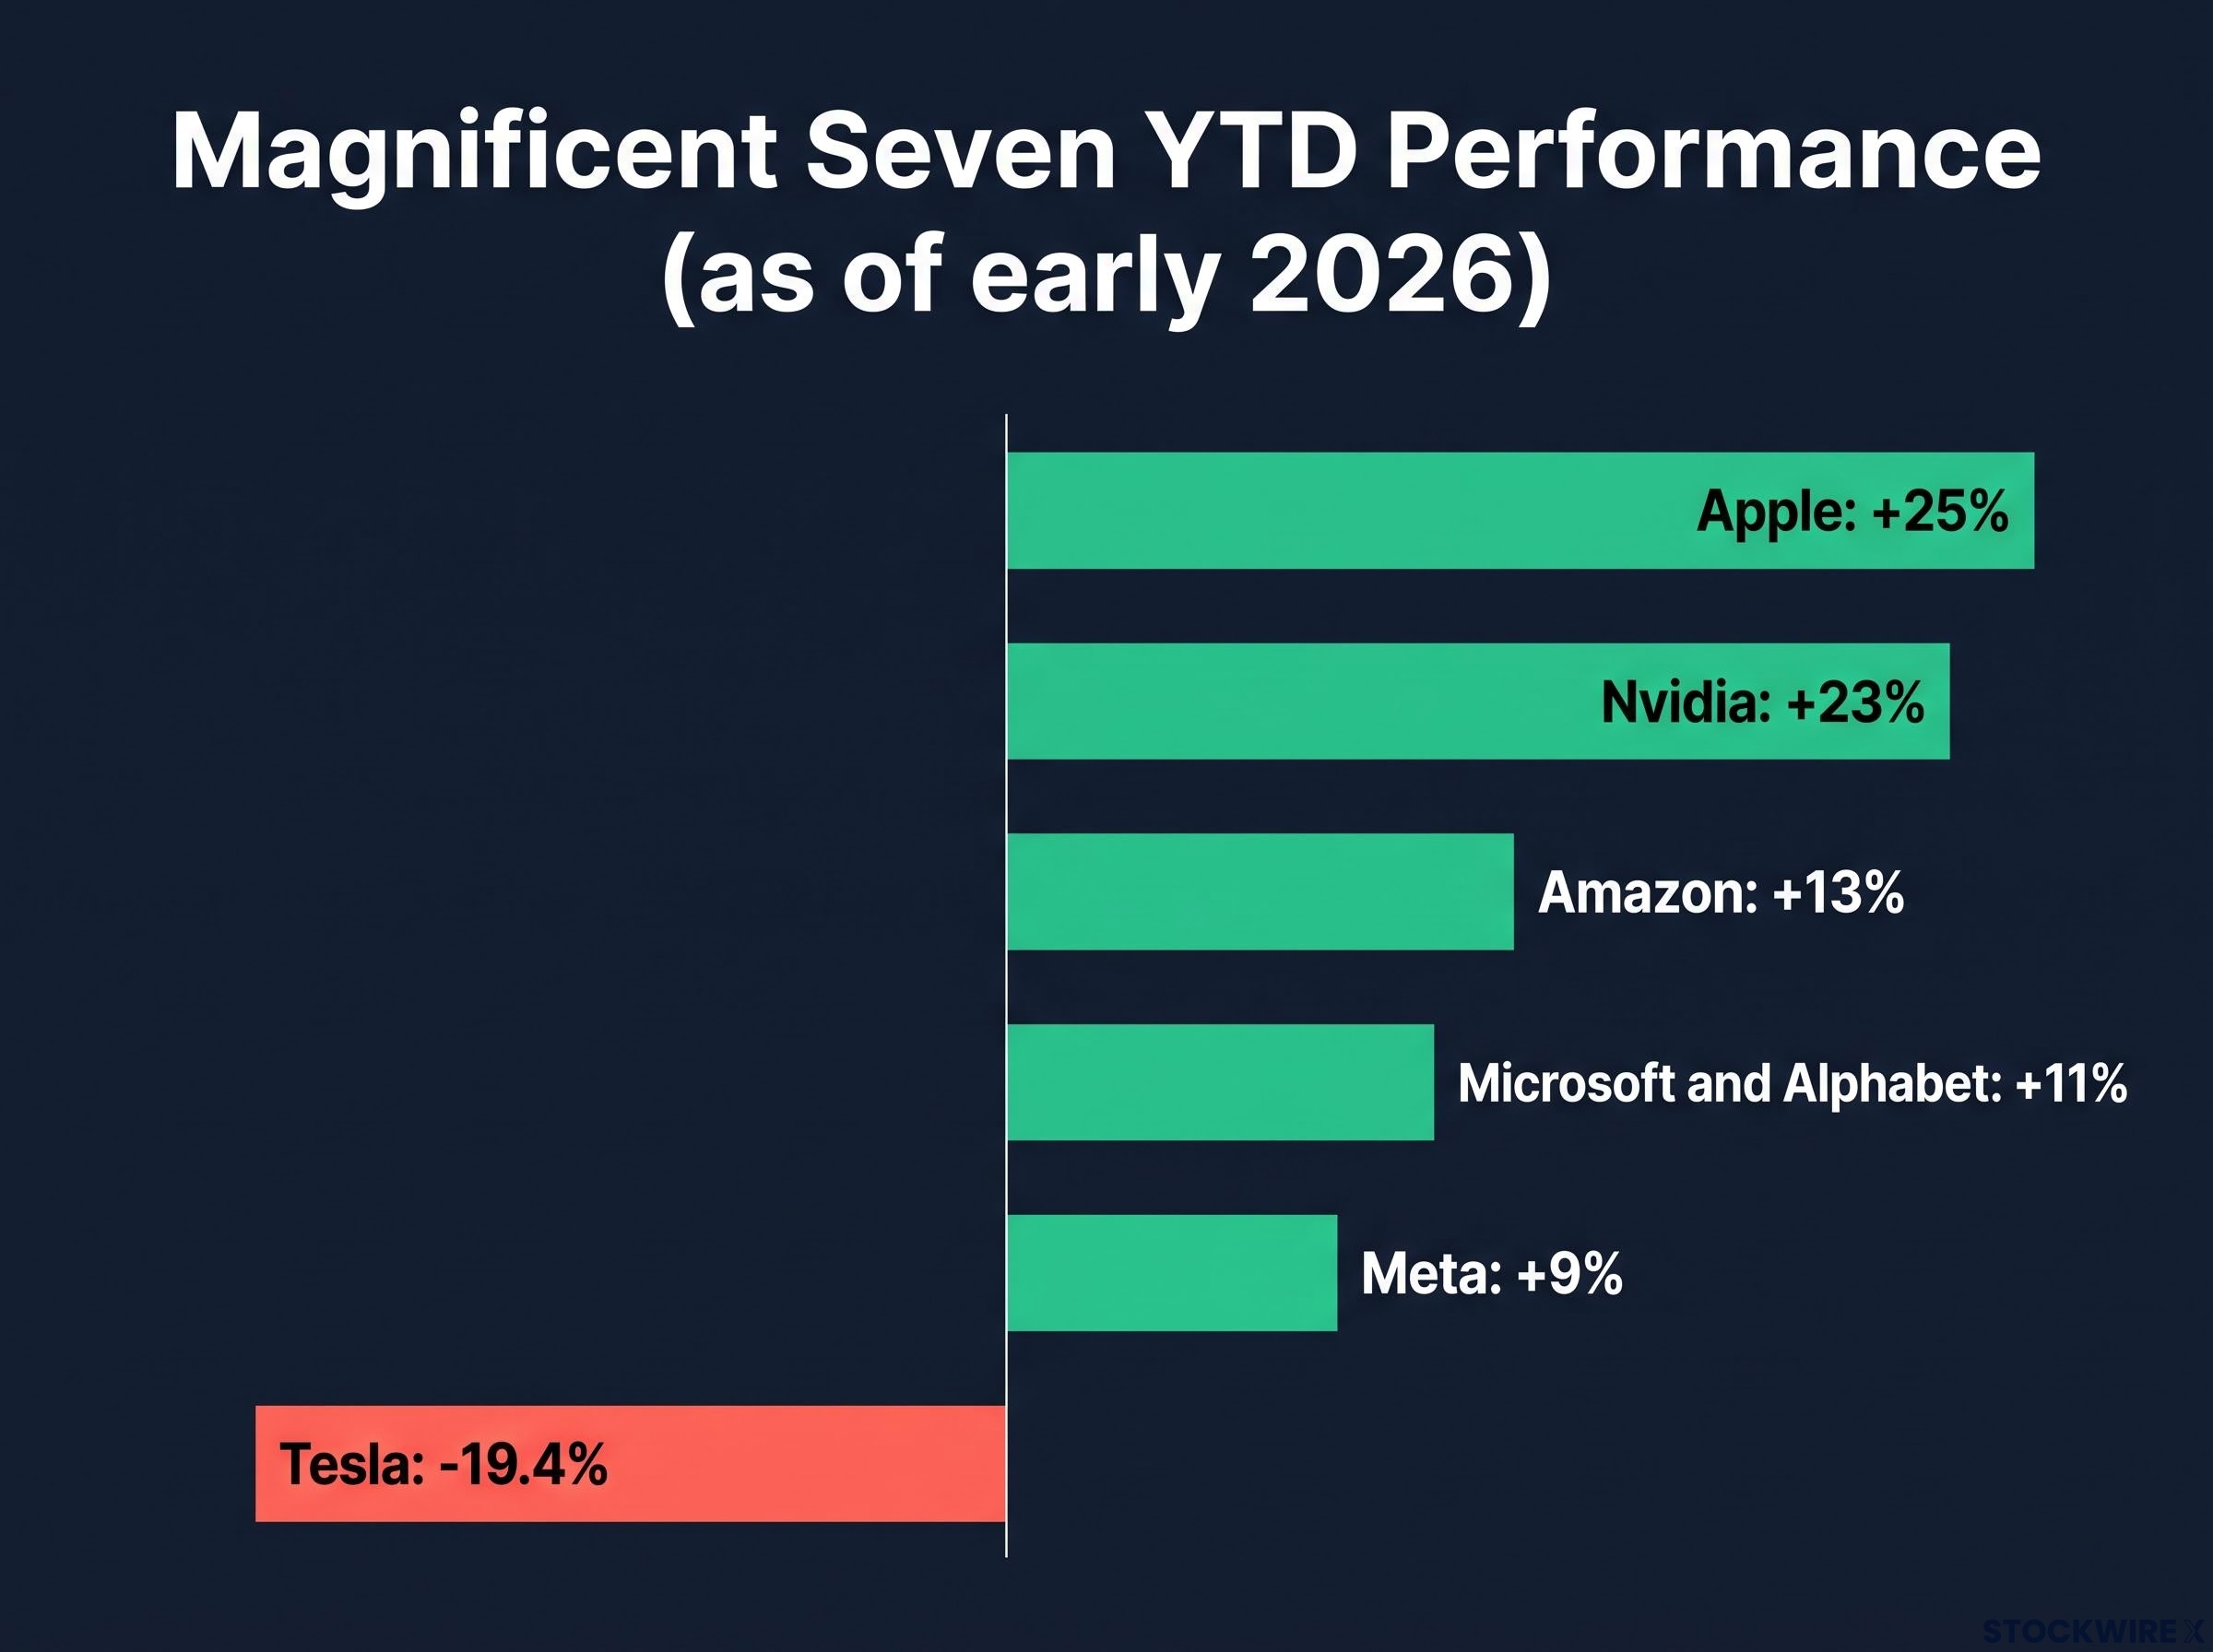
The presenter suggested the buyer may be making a relative-value bet that Tesla closes some of that gap. Technically, a push through 380-390 and then 395 could break a downtrend in place since highs last December and in May, easing the path for the April calls.
What the bears point to
Valuation is the counterweight. Tesla trades at about 340 times earnings with an operating margin of 1.4%, and free cash flow has turned negative. Companies whose value depends on distant cash flows tend to suffer when interest rates rise.
Unverified figures sharpen the concern: free cash flow of about negative $1.092 billion in the cited quarter and 2026 capital spending expected above $25 billion.
| Stance | Analyst or firm | Core reasoning |
|---|---|---|
| Bullish | Daniel Ives, Yorkville Ives & Co. | Buy, $500 target; AI, autonomy and robotics justify a premium |
| Bullish | Ivan Feinseth, Tigress Financial Partners | Optionality in autonomy, robotics and AI makes automaker valuation incomplete |
| Neutral | MarketBeat consensus (46 analysts) | Hold; average target $412.33 |
| Bearish | BNP Paribas | Target cut to about $266 on capital spending burden |
| Bearish | GLJ Research | Sell, target near $24.86 |
The named views above are not independently confirmed. The MarketBeat tally shows 1 strong buy, 23 buys, 17 holds and 5 sells, and earlier consensus readings sat at $397.83 and $395.57. The $457.45 break-even sits above every one of them, about 15% above the original source’s average.
The disagreement is less about cars than about how early to capitalise autonomy, robotics and AI. For you, the implication is plain: this trade only wins if the market adopts a more generous view than most analysts currently hold.
Investors exploring whether Tesla’s price can be justified will find our deep-dive into Tesla’s valuation scenarios, which models bull and bear cases and their annualised returns.
How to separate signal from noise in unusual options activity
Size grabs attention, but a big print can come from many motives. A repeatable checklist keeps you anchored.
Alerts on unusual options activity confirm only that abnormal volume printed at a strike; they say nothing about whether the buyer was making a directional bet, hedging, or building one leg of a larger structure.
Reasons behind a big call buy
- Directional conviction with a capped loss instead of owning shares
- Leverage, gaining large exposure for less upfront capital
- Event positioning around earnings or a product launch
- Hedging a short stock position or other derivative exposure
- One leg of a spread, where other strikes are invisible on the tape
- Relative-value positioning against other mega-cap stocks
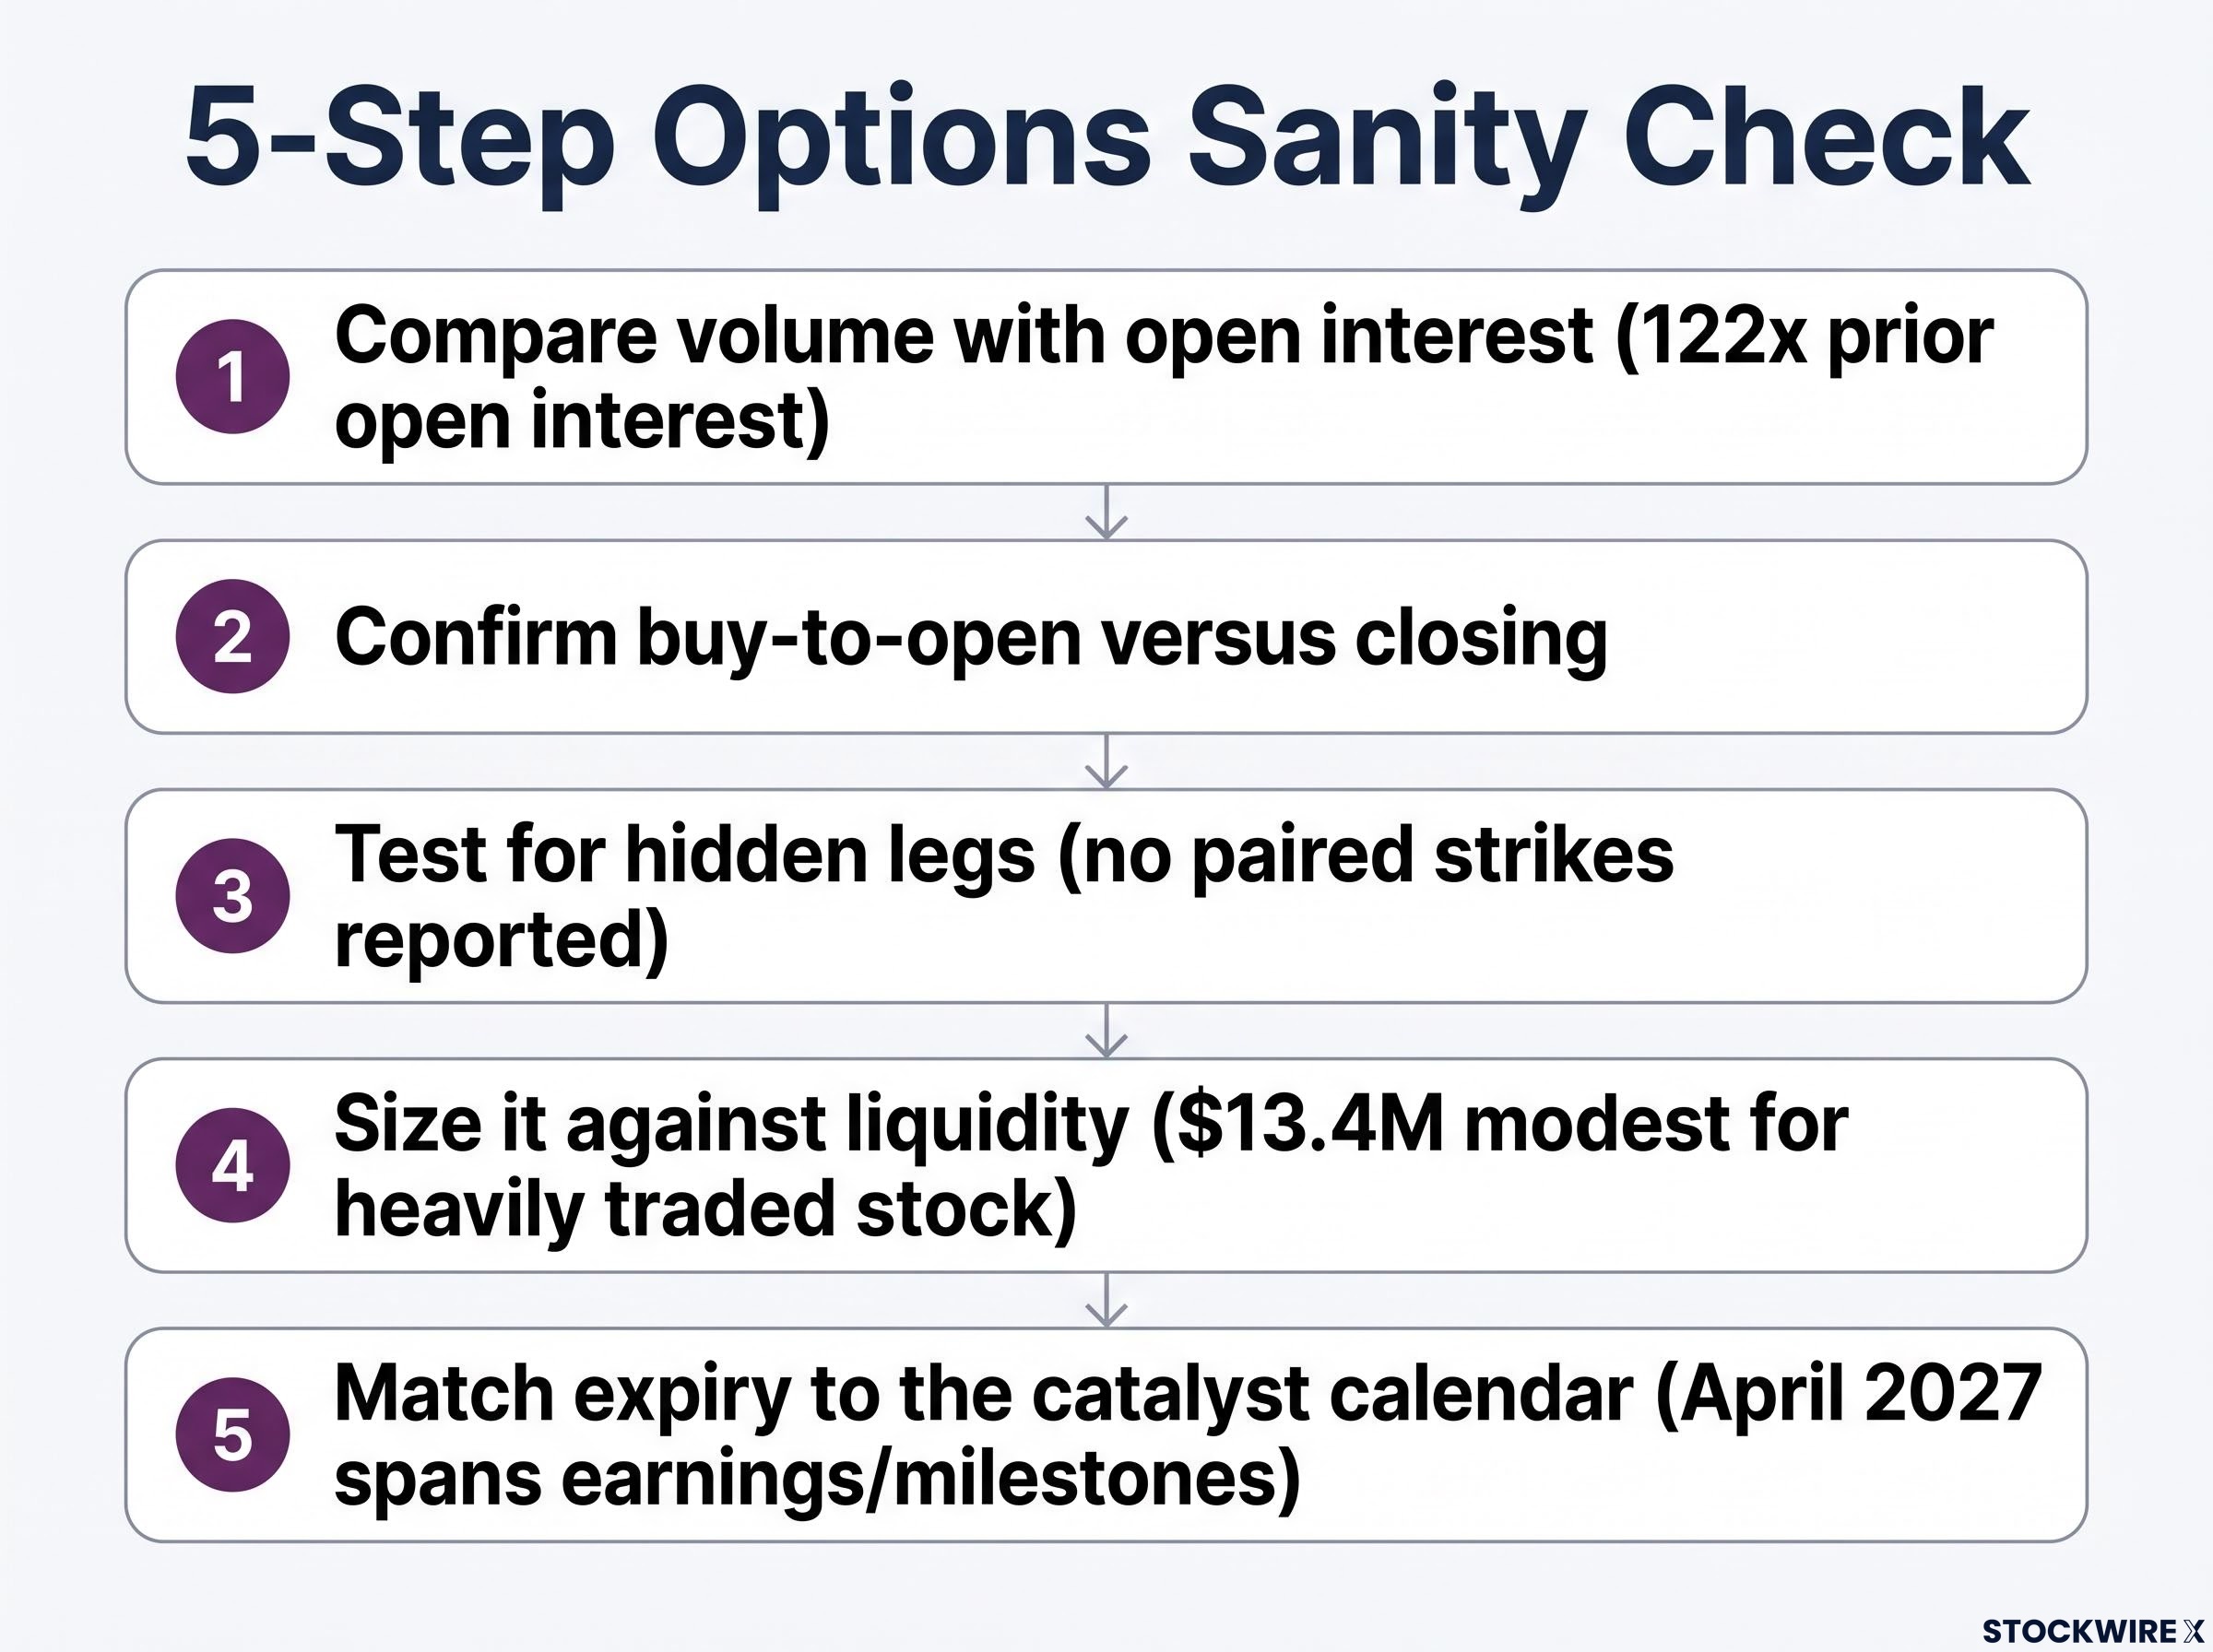
A five-step sanity check
- Compare volume with open interest. Applied to Tesla: about 122 times prior open interest suggests a new position.
- Confirm buy-to-open versus closing. Applied to Tesla: the open-interest gap points to opening, but no named publication confirmed it.
- Test for hidden legs. Applied to Tesla: no paired strikes were reported, which does not rule them out.
- Size it against liquidity. Applied to Tesla: $13.4M is large for one strike but modest for a stock this heavily traded.
- Match expiry to the catalyst calendar. Applied to Tesla: April 2027 spans two earnings reports and several product milestones.
A large options print is not a disclosed investment thesis.
The limits matter. The buyer’s identity, wider portfolio, hedges and exit plan are unknown, and flow services describe their data as filtered blocks or sweeps rather than a complete record. Earlier Tesla prints carry the same ambiguity: a reported $41.3 million call purchase on 6 May 2026 classified as buy-to-open, and a Barchart report in August 2026 of more than 2,770 $420 puts expiring 17 September 2027, both unverified with no identified trader or outcome.
Treat flow as one input to your thesis, never a replacement for one.
What the trade changes, and what it does not
The April position looks like a real, sizeable, multi-catalyst bullish bet. It still reflects one participant’s view against a Hold consensus, a stretched valuation and a break-even above every average target.
Watch three variables: the 21 October earnings reaction against the roughly 6.2% implied move, any Roadster follow-through, and whether Tesla clears the 380-395 technical zone. Each would test the buyer’s thesis long before April.
The next time a huge options print makes headlines, run the checklist before drawing conclusions. Options can lose their entire premium, and this piece is analysis, not a recommendation.
This article is for informational purposes only and should not be considered financial advice. Investors should conduct their own research and consult with financial professionals before making investment decisions. Past performance does not guarantee future results. Financial projections are subject to market conditions and various risk factors.