
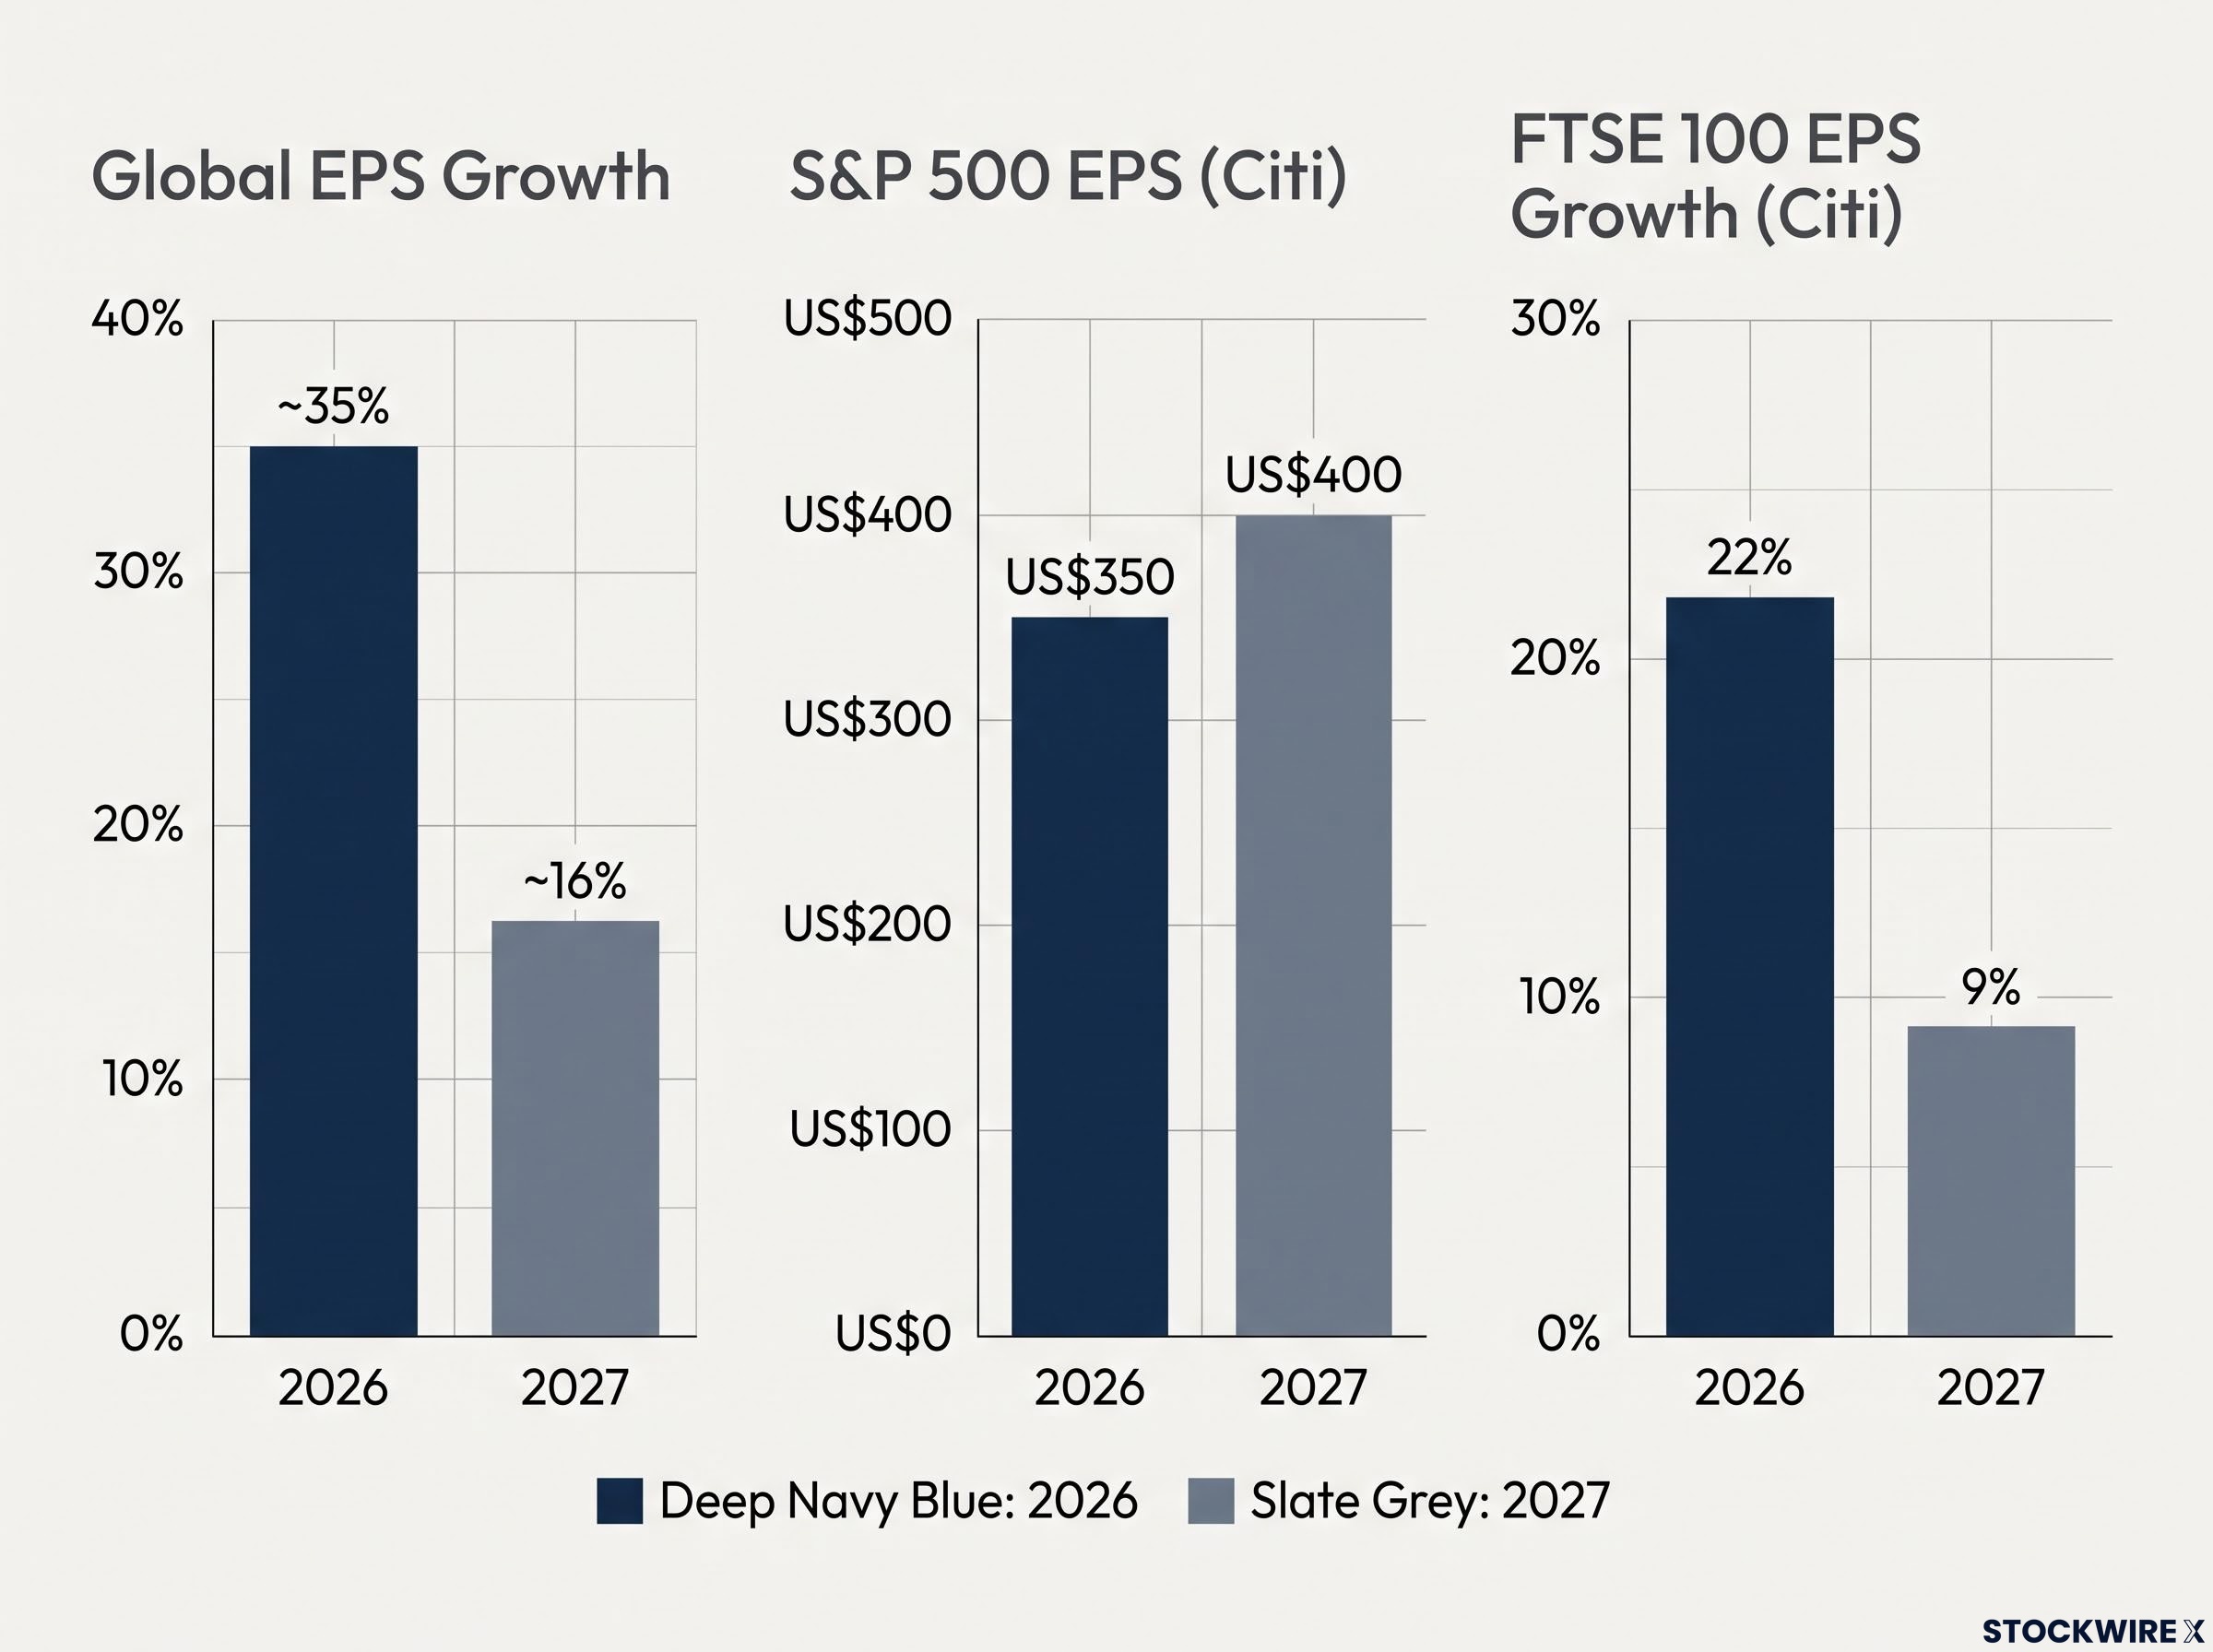
The 2027 earnings outlook looks healthy on paper, with global earnings growth forecast at about 16%. Yet Citi names that figure as one of the two main risks to its equity view. The reason is the year before it: roughly 35% growth in 2026, which means the pace falls by about 20 percentage points.
For investors, the real question is not whether profits keep rising. It is whether slower growth changes how equity returns behave, especially when technology is expected to supply about 70% of it.
Slower growth is not the same as shrinking profits. Earnings are still expanding, and the slowdown comes from comparing against an unusually strong 2026. Citi has said it still backs its view that corporate profits will drive gains in global shares through 2027, according to an Investing.com report published today.
Here is a way to read the slowdown, judge how risky the tech concentration really is, and think through which sectors and investment styles history has favoured in years like this one.
What does a drop from 35% to 16% earnings growth mean for equity returns?
Sixteen per cent growth is strong. Most companies would celebrate it, and most index-level forecasts would welcome it.
The problem is what markets have already priced in.
An expectations gap explains why strong profit growth can coexist with flat returns: markets react to results versus what was already priced in, not to whether the headline number looks impressive.
Citi’s regression view
Citi’s analysts ran simple regressions, which are statistical tests that measure how closely one figure moves with another. Here they compared changes in earnings per share (EPS) growth with market returns. EPS is a company’s profit divided by its number of shares. Their finding: a slowdown of this size has historically pointed to roughly flat equity returns, even when absolute growth stays strong.
In past years when growth stayed positive but slowed, returns came mainly from earnings while valuation multiples generally shrank. A valuation multiple is the price investors pay for each dollar of earnings. Profits rose, but investors paid less for each dollar of them.
Comparable slowing-growth years: global equities averaged about a 4% gain, with a 10% median return and positive outcomes 67% of the time.
The gap between the 4% average and the 10% median tells you the outcomes were uneven. A few bad years dragged the average down, so a typical year was decent but a poor one could be painful.
| Market or measure | 2026 | 2027 | Source |
|---|---|---|---|
| Global EPS growth | ~35% | ~16% | Investing.com, 15 Oct 2026 |
| S&P 500 EPS (Citi) | US$350 | US$400 | Citigroup, 15 Jul 2026 |
| Stoxx 600 EPS growth (Citi) | Not specified | 10% | Investing.com, updated 10 Oct 2026 |
| FTSE 100 EPS growth (Citi) | 22% | 9% | Investing.com, updated 10 Oct 2026 |
Valuations also limit how much room there is for disappointment. The MSCI ACWI, a broad index of global shares, trades at about 16x forward earnings. That places it around the 74th percentile of its 25-year history, meaning it has been cheaper about three-quarters of the time.
Why other forecasters expect cooling
Goldman Sachs points to three temporary forces that have lifted growth and will make comparisons harder: AI capital spending (capex), unusually high semiconductor margins, and gains from private investments and other income. J.P. Morgan Asset Management reportedly raised its 2027 AI capex estimate from about $800 billion to about $1.1 trillion. Neither claim has been independently confirmed.
The practical takeaway is to set your 2027 return expectations closer to flat or modest than to what you saw in 2026. Strong earnings growth alone no longer guarantees strong returns.
When big ASX news breaks, our subscribers know first
Why does tech supplying 70% of earnings growth matter, and does it actually raise risk?
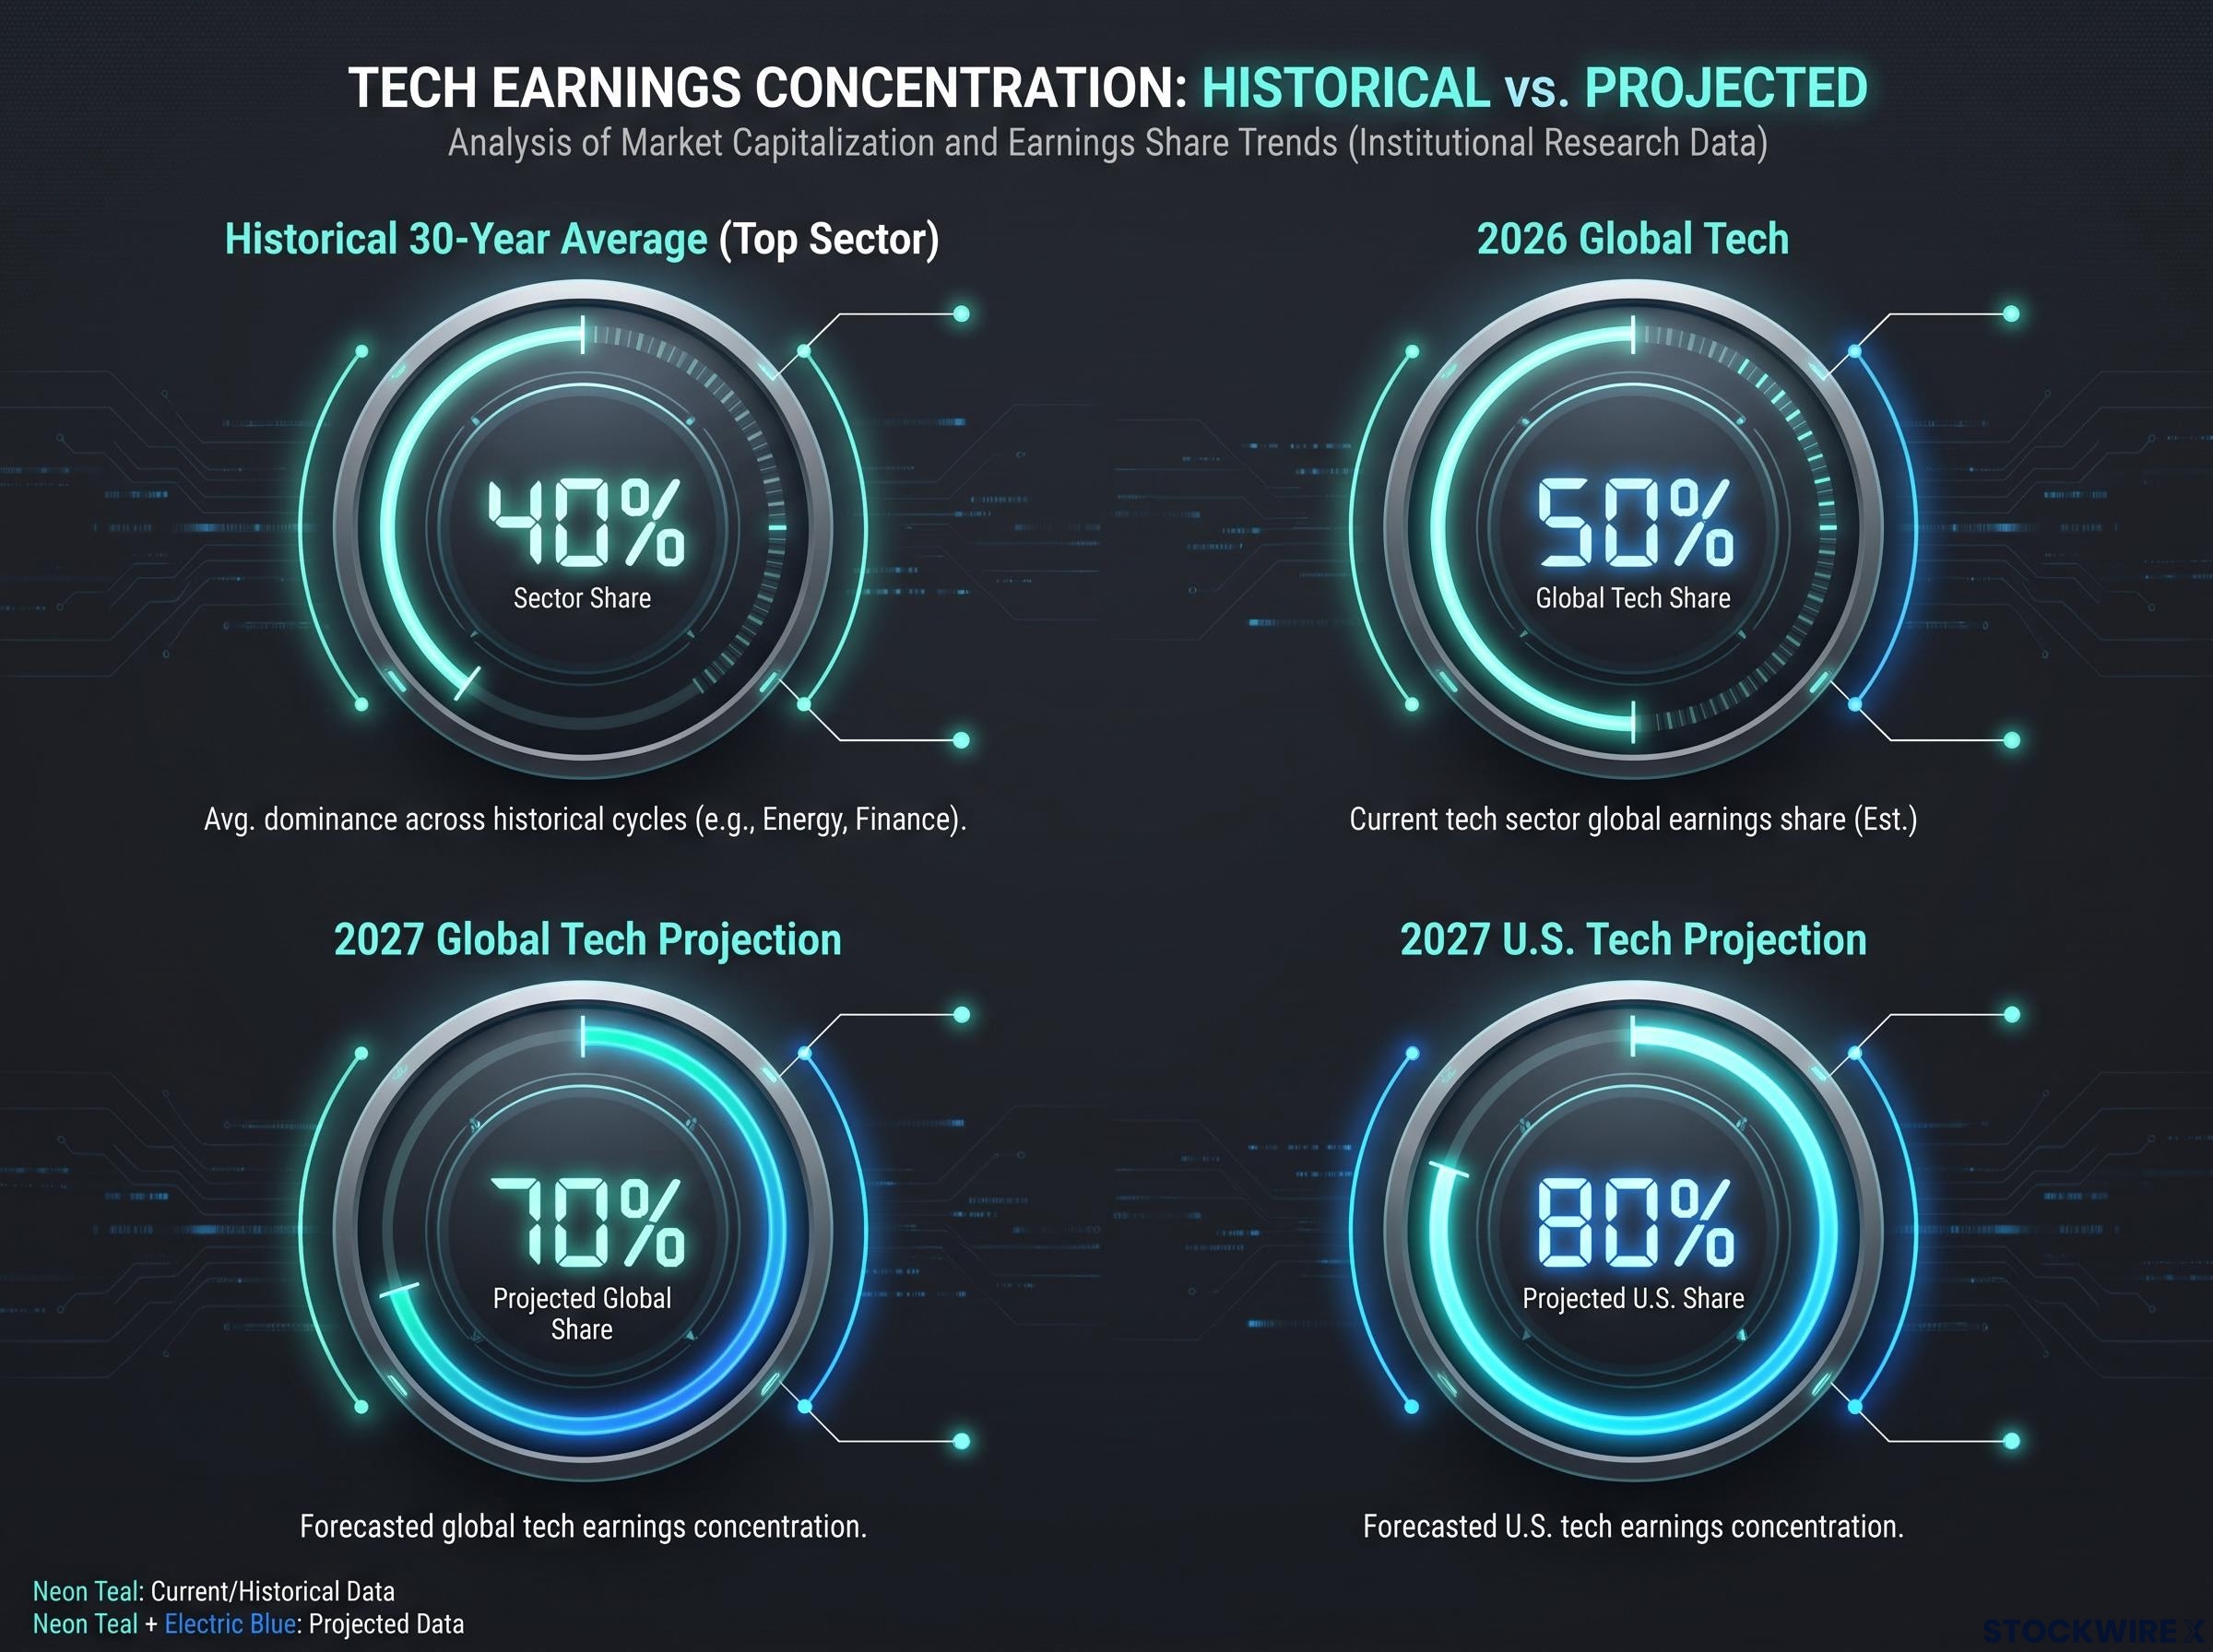
Concentration check: technology is projected to deliver about 70% of global earnings growth in 2027, up from about 50% in 2026, and about 80% in the U.S.
That figure looks alarming. Before deciding whether it is, it helps to measure it properly.
What earnings concentration means
Earnings concentration measures how much of the market’s total profit growth comes from a single sector. It is based on each sector’s contribution to that growth, not on its share of market value. This shows which part of the market is actually producing the extra profit.
Over the past 30 years, the top-contributing sector has averaged about 40% of global EPS growth. Citi expects 2027 to be the second-most concentrated year of positive earnings growth on record.
Citi’s evidence then complicates the alarm. It finds little consistent link between concentration and overall market performance. A sector that contributes a disproportionate slice of profit growth has typically beaten the market during that stretch, with the edge fading only once the following year arrives.
Risk versus acceptable: the real dispute
The argument comes down to whether tech’s dominance reflects durable cash-flow growth or a fragile cycle of expectations. That cycle works like this: rising share prices support AI capex, the spending supports earnings, and those earnings support share prices.
The circular loop looks more fragile because AI capital spending is now consuming up to 90% of hyperscaler operating cash flow, leaving little room for a funding or confidence shock.
| View | Core argument | What would confirm it |
|---|---|---|
| Risk | Natixis: six or seven AI companies drive a disproportionate share of returns; 85% of surveyed strategists rate concentration risk medium or high (not independently confirmed) | Weaker AI orders, lower chip margins or slower capex |
| Acceptable if profits are real | Citi: concentration shows little consistent link to later performance | Earnings delivery and AI investment stay on track |
| Broader growth | S&P 500 growth excluding tech and energy estimated near 16% in 2026, falling to about 9% in 2027 (not independently confirmed) | Growth spreading to more sectors |
When expectations are this high, merely good results may not be enough. Holding technology stays defensible only while earnings delivery and AI spending hold up. That makes earnings breadth, meaning how many sectors are contributing to growth, something to keep checking rather than a judgement you make once.
What have slowing-earnings years looked like for sectors and styles?
Citi points to four earlier years in which earnings growth slowed. Each had a different cause, but the same leaders kept appearing.
| Year | Context | Leadership |
|---|---|---|
| 2000 | Reset after the tech boom | Quality, value, defensives |
| 2011 | European sovereign-debt crisis | Defensives, quality |
| 2018 | After a tax-driven earnings surge, with rising rates and trade tensions | Value, quality, defensives |
| 2022 | Inflation, monetary tightening, geopolitical shocks | Energy, defensives, value, quality |
Quality appears in all four years. Defensives, meaning sectors whose demand holds up in downturns, appear in every one as well. Citi distils five recurring patterns:
- Quality companies lead
- Value beats growth
- Defensives beat cyclicals
- Large and small caps perform similarly
- Health care and energy show strength
From these patterns, Citi infers somewhat more defensive market internals for 2027. That is a tilt in leadership within the market, not a call to sell growth stocks.
Where sector growth stands
The forecasts still put technology ahead. FactSet expects S&P 500 earnings growth of about 16.8% in 2027. RBC and Bloomberg data show S&P 500 technology growth of about 26.6% in the final reported 2027 quarter.
Health care is expected to rebound, but the estimates differ. State Street forecasts about 19.3% growth for 2027 and Yardeni about 22.2%, with different dates and methods behind each. On valuation, the S&P 500 trades near 19x forward earnings and the Stoxx 600 near 14x.
Four years is a small sample, and the current AI-capex and semiconductor cycle has no clear precedent. Treat these patterns as a shift in the odds towards quality, value and defensives, not as a signal that technology’s leadership ends in 2027.
How could you position for 2027, and where does this analysis break down?
A practical positioning framework
- Barbell: pair profitable AI and tech leaders with health care, energy, utilities and consumer staples, so you hold both growth and defence.
- Quality filter: favour strong free cash flow, manageable debt, durable margins, high returns on capital and reliable earnings revisions.
- Value or equal-weight exposure: reduces your dependence on the largest index members.
- Regional spread: Citi reportedly favours European technology, banks, basic resources, health care and personal goods, and is underweight luxury, autos, telecoms and utilities (not independently confirmed).
- Breadth monitoring: broadening growth supports the “acceptable” view, while narrowing growth supports the risk case.
- Stress testing: check how your portfolio would cope with a semiconductor-margin reversal, a capex slowdown, higher rates, geopolitical inflation or a drop in AI sentiment.
Goldman Sachs estimates that semiconductor gross margins falling from about 70% to their 15-year average near 55% could cut S&P 500 earnings by about 10%. It also estimates that rising depreciation at the large cloud providers could reduce 2027 growth by about 5 points. Depreciation is the annual cost of wearing out past equipment spending. Both figures are not independently confirmed, but they show how quickly the tech engine could lose momentum.
The semiconductor margin risk matters because chipmakers capture much of the capex boom, while hyperscaler returns on equity are projected to fall as depreciation climbs towards 12% of revenue.
Avoid binary calls: the evidence supports neither abandoning technology nor treating concentration as harmless.
Where the analysis can fail
- The regressions draw on few observations, and sector make-up has changed over time.
- AI may be a structural break that weakens historical comparisons.
- The circular AI feedback loop is vulnerable to a sudden loss of confidence.
- Higher rates could compress multiples even if earnings forecasts are met.
- Sector definitions differ across MSCI, S&P, FactSet and Bloomberg.
The practical task is sizing your technology exposure and watching breadth, not choosing between all-in and all-out. This is general information, not personal financial advice.
What the slowdown changes, and what it does not
2027 looks set to bring slower but not weak earnings growth. The open question is whether AI-driven concentration reflects durable profit expansion or a dependence on a narrow group of companies.
The slowdown lowers return expectations and points to more defensive leadership within markets. It does not, on its own, overturn the case for earnings-driven gains.
Three things will tell you which way it is breaking: whether earnings breadth widens or narrows, whether semiconductor margins hold, and whether AI capex keeps growing.
Past performance does not guarantee future results. Financial projections are subject to market conditions and various risk factors. This article is for informational purposes only and should not be considered financial advice. Investors should conduct their own research and consult with financial professionals before making investment decisions.