Jim Carzon says roughly 70% of financial stocks are now in a correction of 10% or more. That figure could not be independently confirmed. Yet the first big-bank results of the season look sturdy, and that gap is the signal many investors may be misreading. They are treating “financials” as a single trade.
Earnings season gets under way this week. The Financial Select Sector SPDR Fund (XLF) sits nearly 10% below its September peak. The SPDR S&P Regional Banking ETF (KRE) still trades beneath its November 2024 high while the S&P 500 hovers near records.
Carzon expects a short-term relief bounce around results. He also sees regional banks as a tail risk over the next three to six months, meaning a less likely but potentially severe downside scenario.
After this, you should be able to separate the large-bank story from the regional-bank story. You should also be able to weigh the bounce case against the fragility case on its merits.
Why are financial stocks sliding while big-bank results hold up?
On the surface, the numbers contradict each other. Prices are falling, and the businesses reporting so far look healthy.
StockCharts data shows XLF fell about 9.9% from its early September peak before finding support near key moving averages. KRE closed around $69.06 on 13 October 2026, and the same analysis rated it technically weaker, with soft momentum and heavy overhead resistance.
The split shows up more sharply over longer windows.
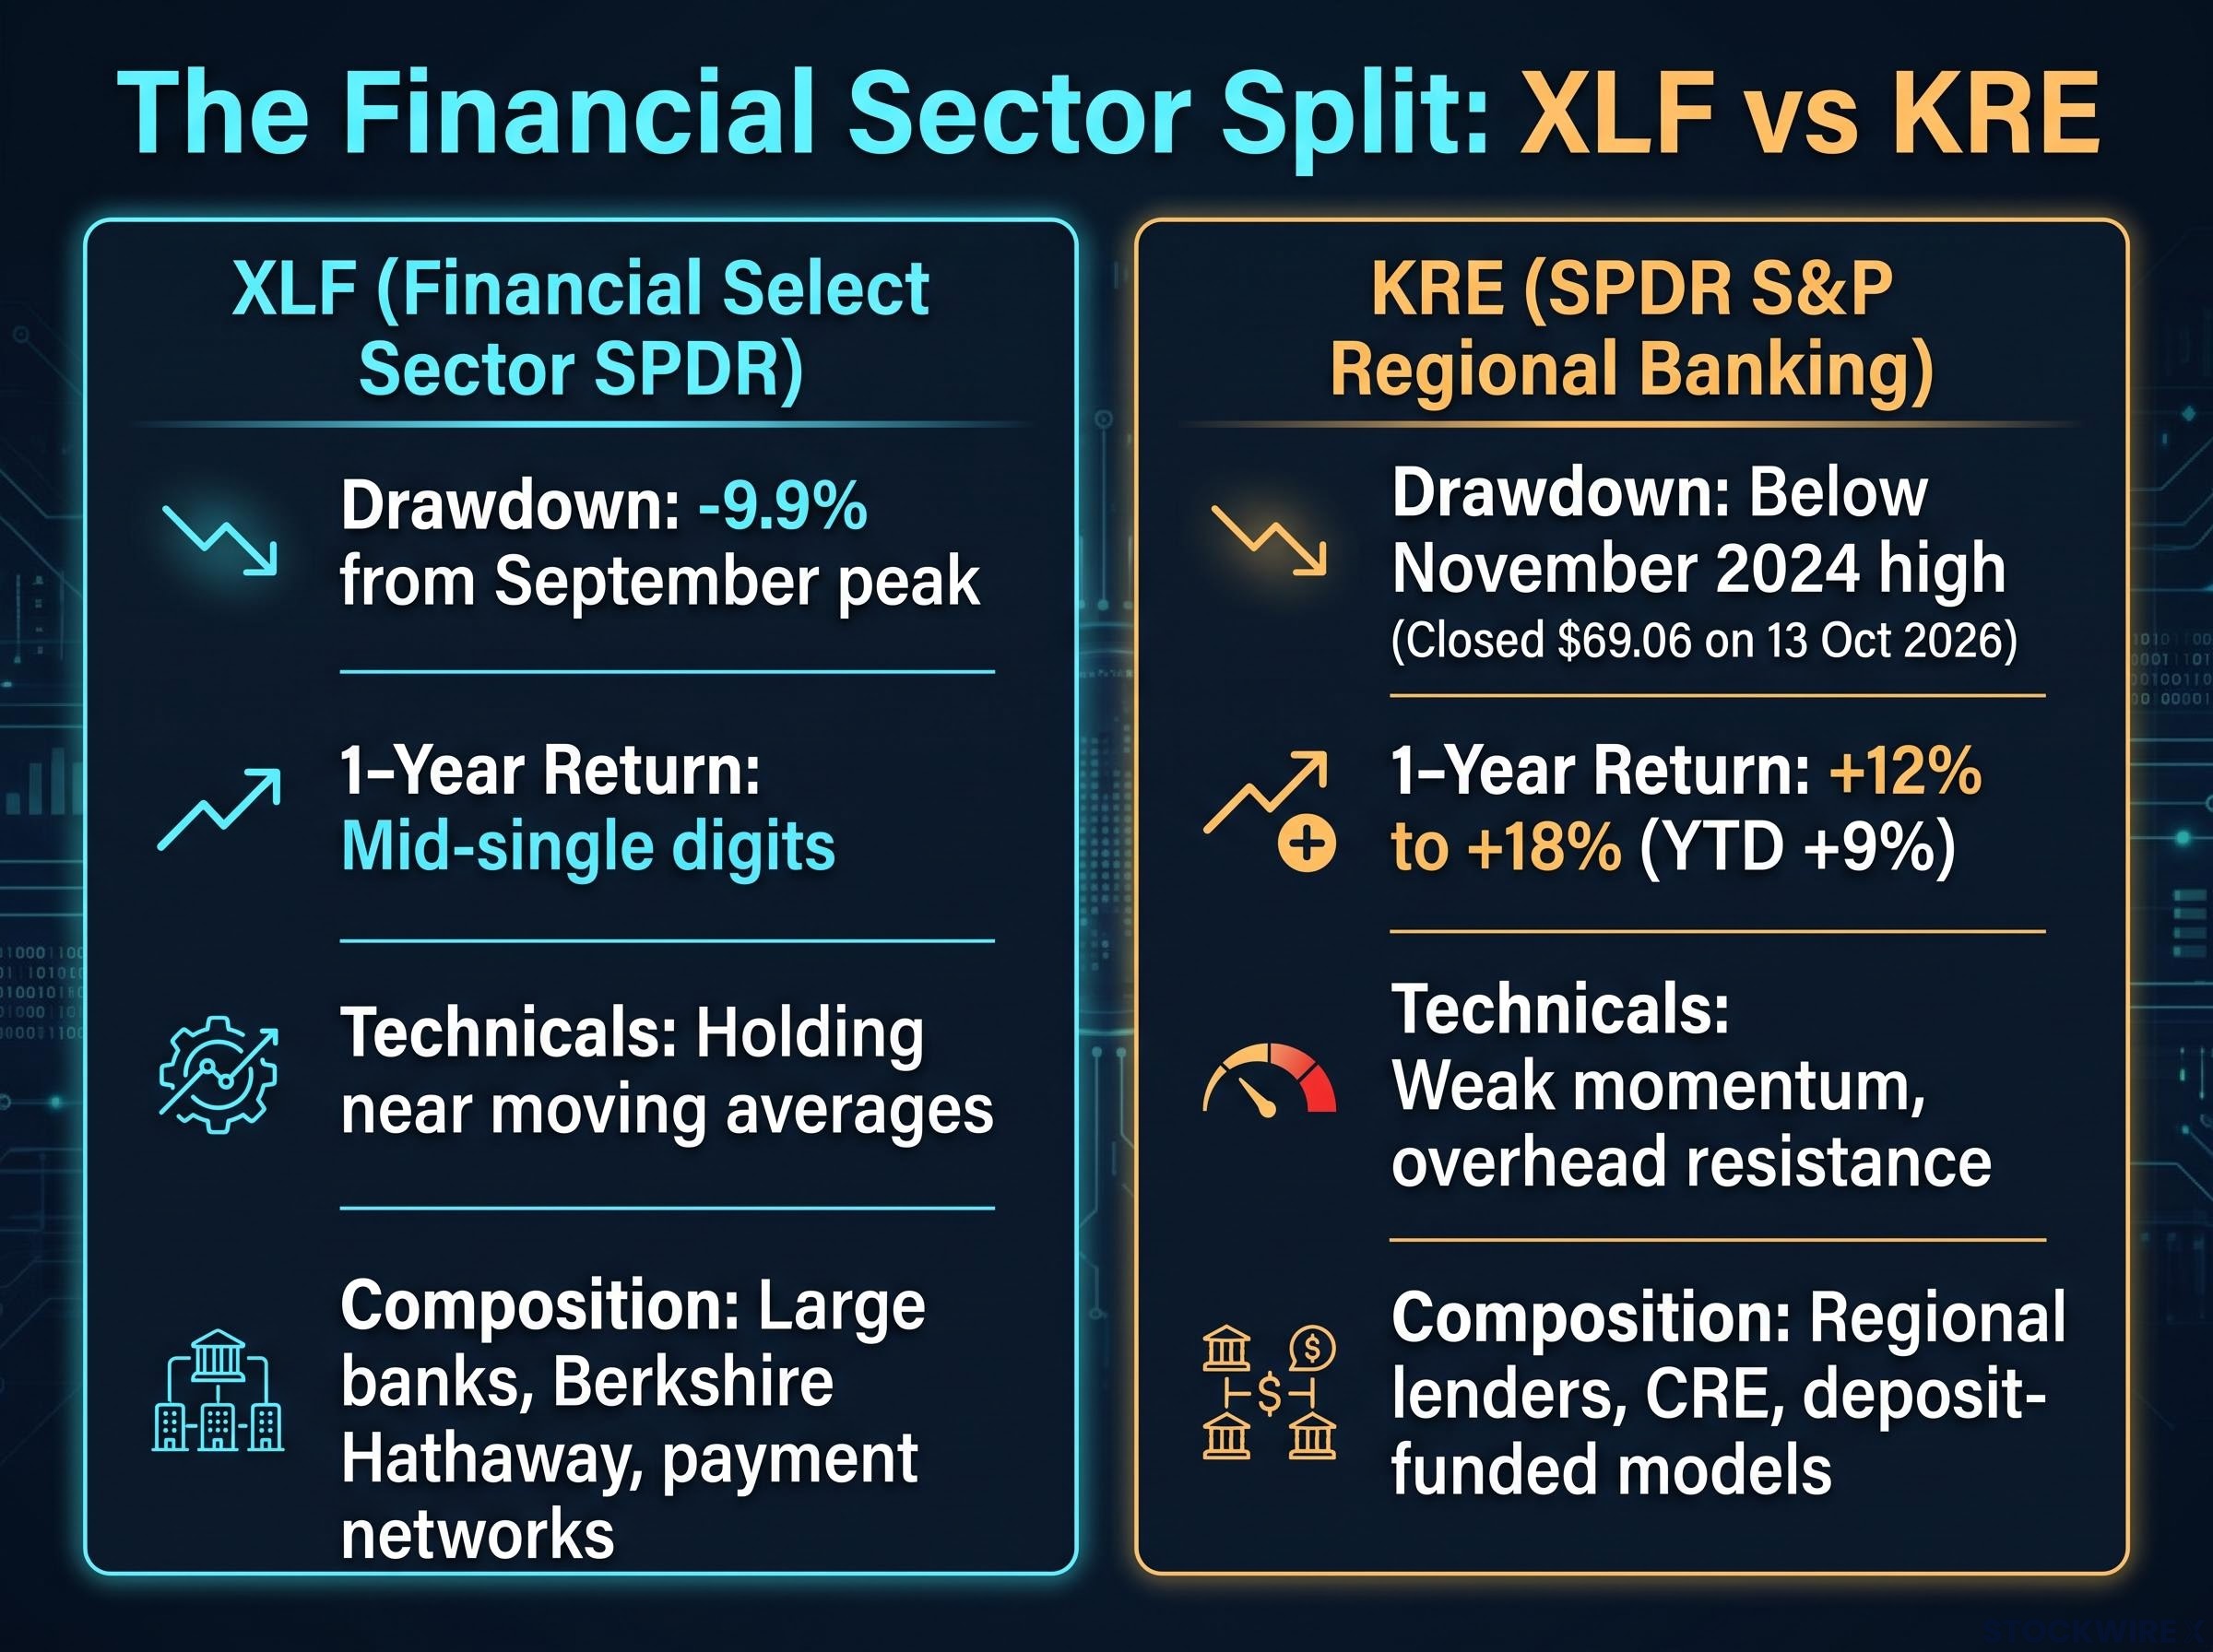
| Measure | XLF | KRE |
|---|---|---|
| Recent drawdown | About -9.9% from the September peak | Below its November 2024 high |
| 1-year return | Mid-single digits | About +12% to +18% (YTD about +9%) |
| Technical condition | Holding near moving averages, seen as buyable | Weak momentum, low RSI, overhead resistance |
| Composition | Large banks, Berkshire Hathaway, payment networks | Regional lenders, CRE and deposit-funded models |
Sentiment has also deteriorated quickly.
Truist Securities survey, October 2026 Only 35% of respondents expect bank stocks to outperform, down from 68% in July and 82% in December.
Regional banks now trade at about 12.5x earnings against a three-year average of 15x. Carzon argues the whole group was sold indiscriminately, “like software,” which is the basis of his case for treating it as several trades rather than one. He also points out that the iShares Russell 2000 ETF (IWM) holds many regional banks.
What this tells you is that a broad financials ETF may not give you the risk, or the opportunity, that you think you are buying.
Part of KRE’s lag versus the S&P 500 may reflect structural pressure on deposit franchises from stablecoins and box spreads, not only the rate cycle, which would make the discount to large banks harder to close.
When big ASX news breaks, our subscribers know first
What makes regional bank risk different from the rest of the sector?
A bank can be solvent on paper and still fail. That idea sits at the centre of the bearish case.
Start with leverage. Leverage means funding assets mostly with borrowed money; for a bank, that borrowed money is largely customer deposits. Carzon calls regional banks “structurally fragile,” leveraged about 10-to-1. This is his view, and the figure is not a confirmed universal number for regional banks.
Six mechanisms turn that leverage into fragility:
- Duration mismatch: Banks buy long-term bonds funded by deposits that can leave quickly, so rising rates create paper losses on those bonds.
- Uninsured-deposit concentration: The FDIC insures $250,000 per depositor, per insured bank, per ownership category, and balances above that have reason to run.
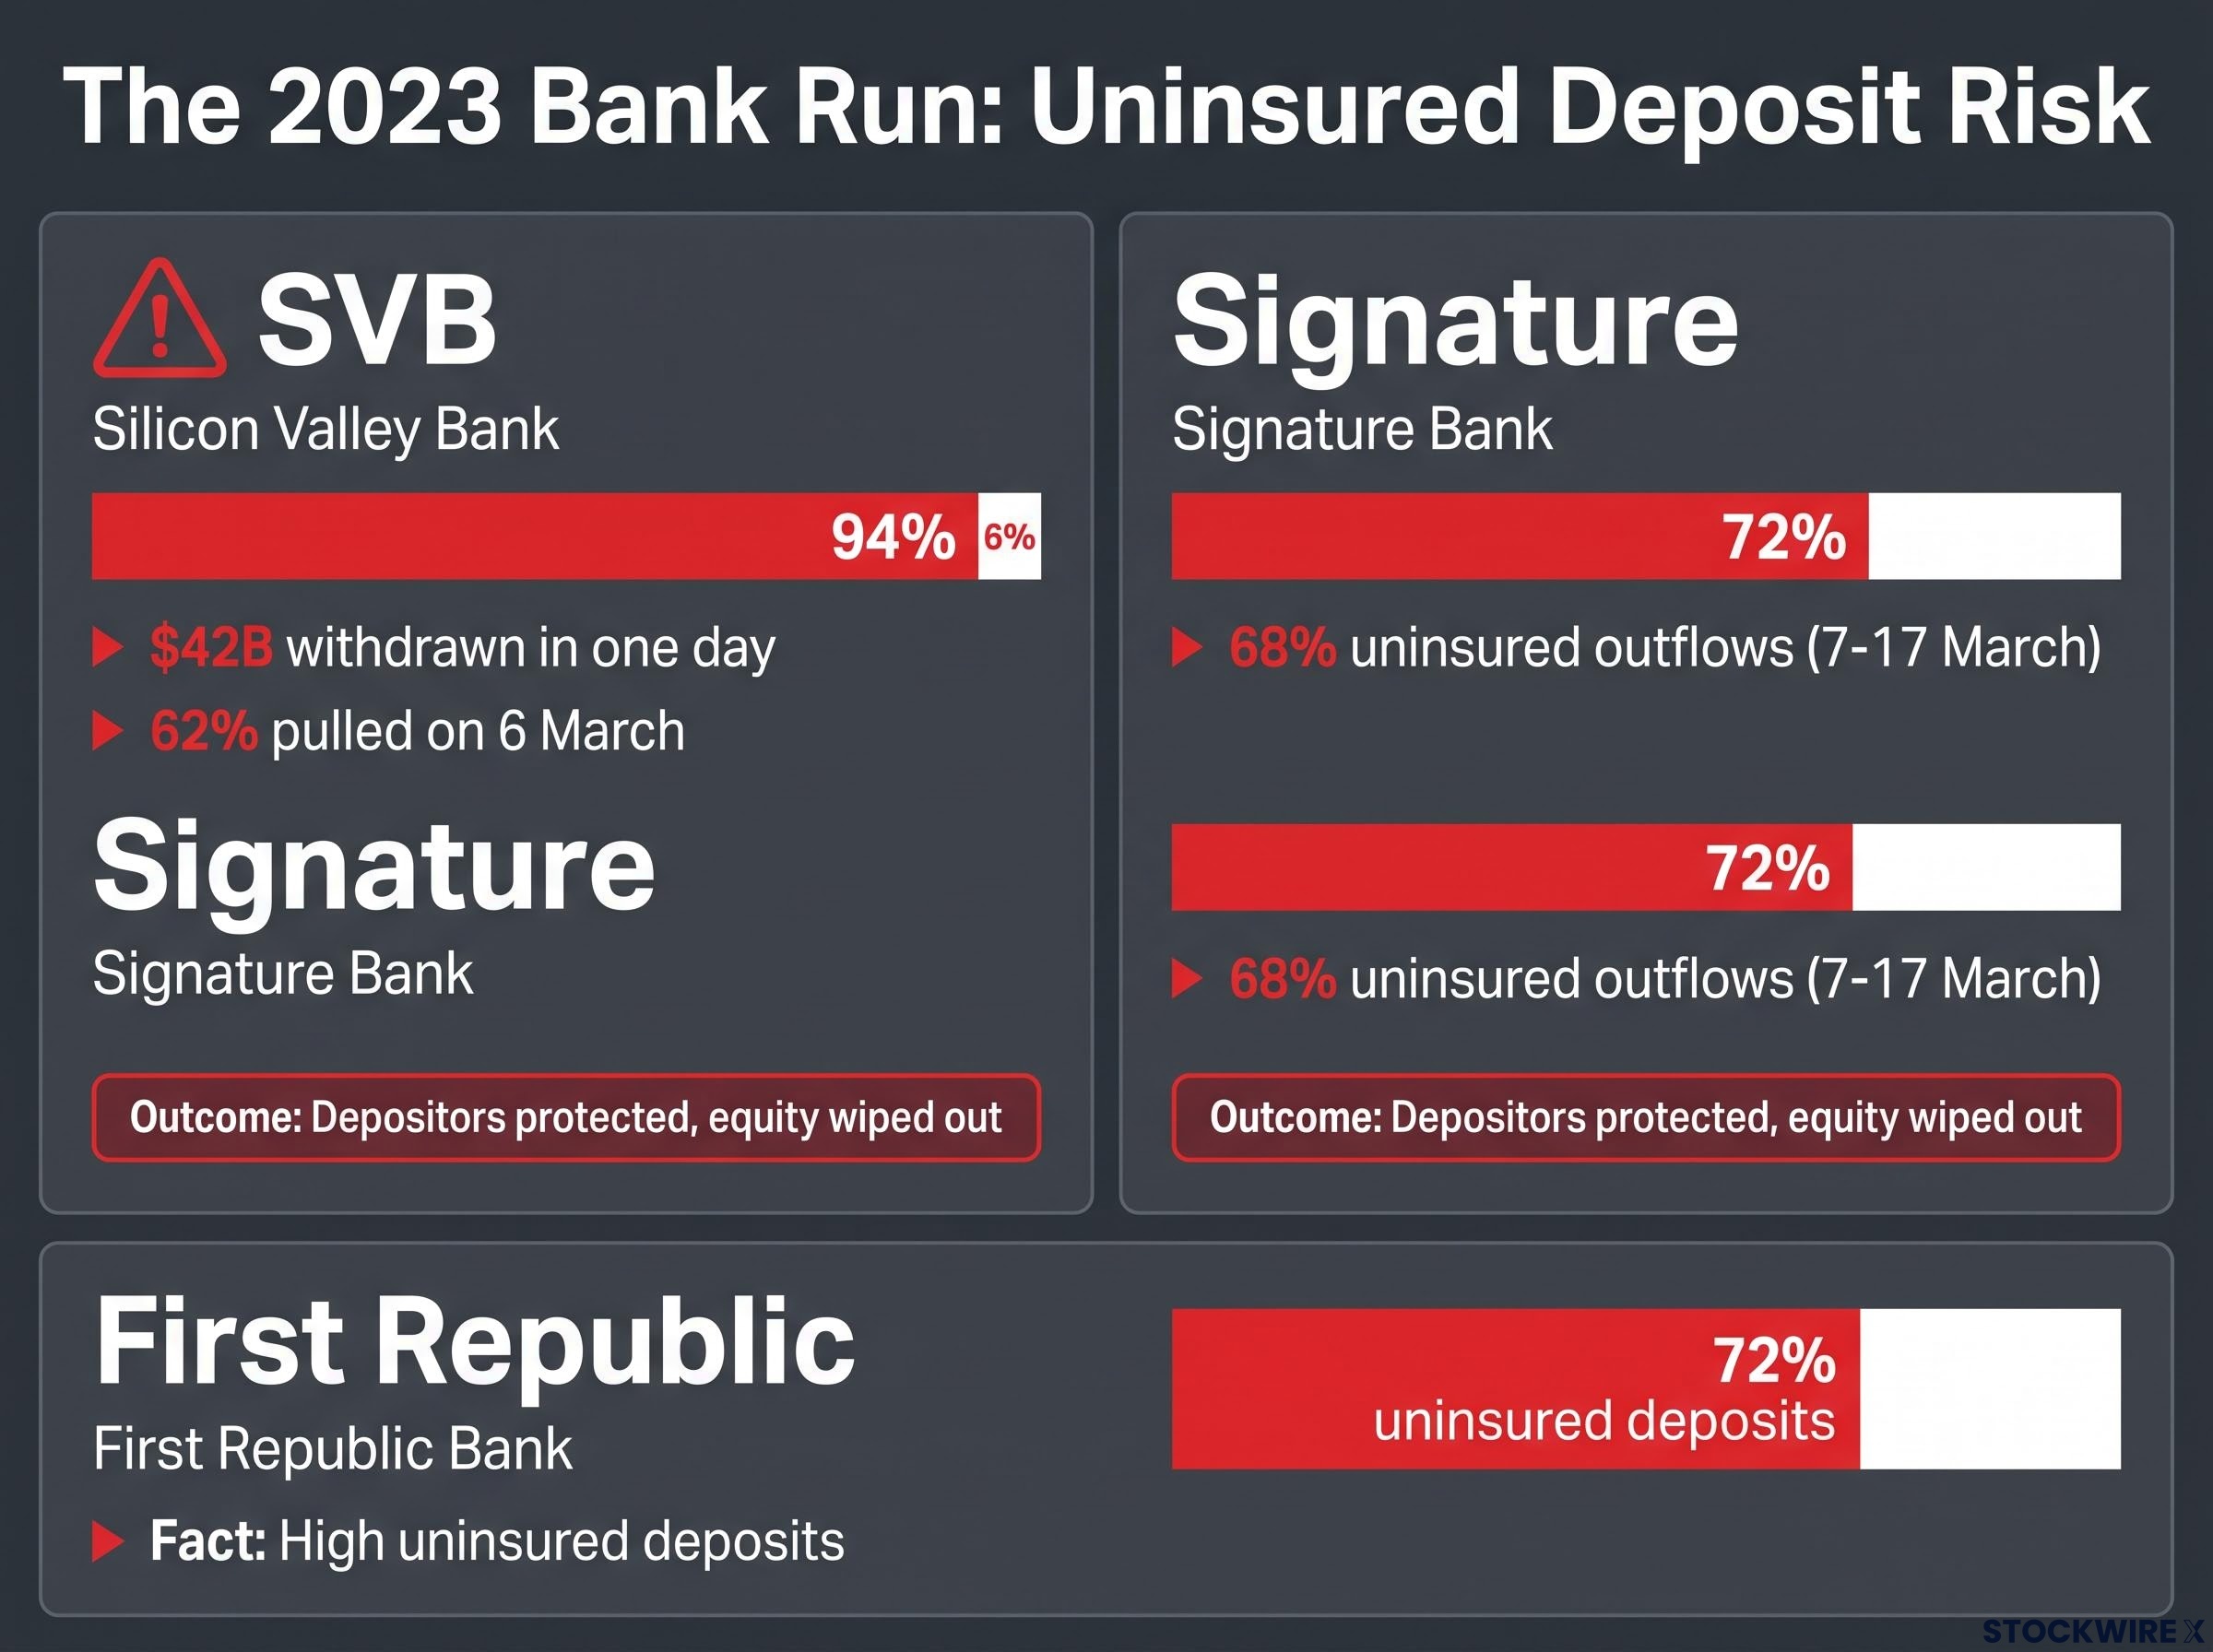
- Digital-run speed: Silicon Valley Bank (SVB) saw about $42B withdrawn in one day.
- Asset and depositor concentration: Banks serving one industry or region can see customers move together.
- CRE concentration: Smaller banks typically hold more commercial real estate loans relative to their size, with problems varying by property type and geography.
- Confidence sensitivity: Doubts about asset values can trigger withdrawals regardless of reported capital.
Carzon contrasts this with brokerages such as Goldman Sachs, which he sees as less exposed to leverage risk. He says credit unions carry similar but lesser risk; they are insured by the NCUSIF and use a different funding mix.
Why capital alone does not stop a run
Regulatory capital is the cushion a bank holds to absorb losses. SVB held bonds whose market value had fallen as rates rose, and about 94% of its deposits were uninsured, according to the American Bankers Association (ABA). Signature and First Republic sat near 72% each.
Once depositors doubted the bonds, they withdrew. Selling bonds to pay them turned paper losses into real ones.
For you, the lesson is that a headline capital ratio is only part of the picture. Deposit mix is the variable to check first.
What did SVB and the 2022-23 crisis actually teach investors?
The 2023 run unfolded in a sequence that shows who regulators protected, and who they did not.
According to the ABA’s reconstruction, uninsured depositors pulled 62% of SVB’s 6 March balance. At Signature, uninsured outflows reached 68% during 7-17 March. A 2026 analysis placed SVB’s uninsured share at or above the 99th percentile of similarly sized banks for much of the prior decade.
Regulators then invoked the systemic-risk exception, covering every depositor at both banks, insured or not. Shareholders received no such rescue.
- SVB: about 94% uninsured; all depositors protected, equity wiped out
- Signature: about 72% uninsured; all depositors protected, equity wiped out
- First Republic: about 72% uninsured; contagion reached it despite a different business, leaving regulators few buyers
Jim Carzon’s summary Regulators tend to protect deposits, not equity holders.
First Republic matters because it was not a copy of SVB. Large uninsured balances and rate exposure were enough.
Carzon adds that financials have historically led the broader market lower by a month or two when seriously stressed. That does not mean every financials decline predicts a market fall, and large banks, brokerages and payment firms behave differently from deposit-funded regionals.
For an equity holder, the precedent is blunt: a bank can be rescued while its shareholders lose everything. Deposit safety is not stock safety.
For readers wanting the regulatory side of 2023, our full explainer on the SVB stress test failure shows why the Fed’s falling-rate scenario missed the losses that sank the bank.
What do the latest numbers say about how much safer banks are now?
Look at the aggregate FDIC data and the industry appears far steadier than in early 2023.
| FDIC Q2 2026 measure | Result | Reassuring or concerning |
|---|---|---|
| Domestic deposits | +$142.7B (0.8%), eighth straight rise | Reassuring |
| Uninsured deposits | +$317.4B (3.8%); insured down about $111B | Concerning |
| Unrealised securities losses | $326.7B ($216.9B HTM, $109.8B AFS) | Concerning |
| Past-due and nonaccrual loans | 1.44%, down 9 bps | Reassuring |
| Reserve coverage | 172.7% of noncurrent loans | Reassuring |
| Tier 1 / leverage ratio | 13.75% / 8.98% | Reassuring |
The weak spots are harder to dismiss. Deposit growth is coming from uninsured money, the type most likely to run. S&P Global Ratings said in September that loan growth outpacing deposits has nudged funding pressure higher, which it judged manageable but worsening.
Uninsured deposit exposure is now compounded by new ways of moving cash, since stablecoins, money market funds and options-based lending lower the cost of leaving a bank, which makes the run-prone share of funding harder to treat as sticky.
Third-quarter results so far favour scale:
- JPMorgan: NII about $27.04B (+12.8% YoY); 2026 guidance raised to $106.2B; provision $2.74B versus $3.40B a year earlier
- Wells Fargo: NII $12.52B versus roughly $12.66B expected; provision rose to $1.03B
- Goldman Sachs: strong equities trading; banking and markets provisions $345M, sharply higher YoY
NII, or net interest income, is what a bank earns on loans minus what it pays on deposits. Detailed regional results were not yet available. Regulation is easing too: the Community Bank Leverage Ratio fell from 9% to 8% on 1 July 2026, and a broader 2026 capital rule remains only a proposal.
The sector looks safer on average. You should not assume that holds for any individual regional bank.
How could a long/short approach play out, and where could the bearish case fail?
Carzon’s plan is coherent. Heavy demand for protective puts, plus event volatility around results, could set up a relief rally driven by dealer hedging flows (what traders call vanna and charm effects). He would use that bounce to sell weaker names and buy puts dated about six months out on regionals, while noting large banks like JPMorgan may attract flight-to-safety money despite weak charts.
Others see it differently:
- Chris Grisanti, MAI Capital: weakness is more opportunity than recession warning, tied largely to rate-hike expectations
- Gerard Cassidy, RBC Capital Markets: a buying opportunity, with the US economy “nowhere near a recession”
- StockCharts: XLF looks buyable; KRE is materially weaker
Stress-test the bearish trade and the failure points pile up.
| Risk | Why it matters | Who it hurts |
|---|---|---|
| Earnings relief or squeeze | Raised guidance can force shorts to cover | Shorts |
| Rate cuts | Lower deposit costs and smaller unrealised losses | Shorts |
| Valuation | 12.5x versus 15x suggests bad news is priced in | Shorts |
| Deregulation and M&A | CBLR cut and takeovers can rescue weak banks | Shorts |
| Deposit growth | Eight rising quarters weaken sector run risk | Shorts |
| Put decay | Time and falling volatility erode puts | Put holders |
| Uninsured deposit build | Run-prone money is growing | Longs |
Even if you accept the fragility thesis, timing and instrument risk mean being right on the idea does not guarantee being right on the trade. These views are speculative and subject to change as results and market conditions develop.
Splitting the sector instead of calling it: what to watch next
The evidence supports a split. Large banks are posting resilient earnings, while regionals carry more exposure to deposit flight, securities losses, CRE and confidence shocks. KRE’s weak chart beside a steadier XLF, and uninsured money driving FDIC deposit growth, both point the same way. Carzon’s 70% figure and 10-to-1 leverage claim remain unverified.
The real question is which financials you hold, not whether to be bullish or bearish on the sector. Track these as results arrive:
- Regional-bank earnings detail, including PNC, Truist, US Bancorp, Citizens and KeyCorp
- Deposit mix, especially uninsured share
- CRE credit trends by property type and region
- The interest-rate path
This article is for informational purposes only and should not be considered financial advice. Investors should conduct their own research and consult with financial professionals before making investment decisions. Past performance does not guarantee future results.