Wells Fargo wants Meta at $1,000. Citi wants AMD at $800. Both sound like bold calls, but the options market prices them very differently, and the bigger number is not the one you might expect to be the harder target.
As of 8 October 2026, Meta traded near $721 and AMD closed at $620.68. Both stocks rallied after Meta launched its Muse AI agent in September. Both targets were raised on 6 October, and both companies report within days of each other: Meta on 28 October, AMD on 3 November.
The risk in a headline target is treating it as a forecast. It is a claim, and claims can be tested against market data.
This gives you a repeatable method for checking any analyst target using market capitalisation, implied volatility and options pricing. It also gives you a clear read on which of these two targets the market treats as more realistic.
Why share price misleads and what the targets imply in market cap terms
A $1,000 target feels larger than $800. It also sounds more ambitious, because four-digit share prices carry a psychological weight that three-digit ones do not.
That instinct is wrong. Share price on its own says nothing about a company’s size, because companies split their shares at different times. A stock split divides each existing share into several cheaper ones without changing the company’s total value. Nvidia shows the effect: its market capitalisation is about $5.78 trillion, yet repeated splits leave its share price looking modest.
The fair comparison is market capitalisation, which is the share price multiplied by the number of shares outstanding. Sources conflict on Meta’s figure, but the $1.84-1.88 trillion range matches its roughly 2.55 billion shares.
| Metric | Meta | AMD | Notes |
|---|---|---|---|
| Recent close | $738.88 (6 Oct), about $721 (8 Oct) | $620.68 (8 Oct) | AMD fell 3.90% on 8 Oct |
| Market cap | About $1.84-1.88T | About $1.01T | Meta on roughly 2.55B shares |
| Analyst target | $1,000 (Wells Fargo, from $796) | $800 (Citi, from $575) | Both raised 6 Oct |
| Implied upside | About 35% from $738.88 | About 29% from $620.68 | Meta gap wider from $721 |
| Street average | About $794.96 (63 analysts) | About $654-662 | JPMorgan Meta target: $920 |
Two thought experiments show how share price can mislead:
- Scaling Meta to a $3 trillion market cap would imply a share price well above $1,000.
- Doubling AMD to about $2 trillion would imply roughly $1,300 per share, assuming no split.
Here is what that tells you. At $1,000, Meta would be worth roughly $2.55 trillion, meaning the target requires adding well over $500 billion in market value. Citi’s AMD call needs about 29% upside. The round number matters less than the percentage climb and how volatile the stock is that has to make it.
The Street average sits well below both headline numbers, and analyst price target spreads of this kind are better read as a measure of disagreement over terminal value than as a signal of agreement or a buy case.
When big ASX news breaks, our subscribers know first
How to read implied volatility and earnings moves before 28 October and 3 November
Open any options screen and you will see a single implied volatility figure. That number carries more information than it appears to.
Implied volatility (IV) is the size of future price swings that option prices currently assume, expressed as an annualised percentage. Higher IV means traders are paying more for options because they expect bigger moves. Ahead of earnings, IV rises because a single report can shift a stock sharply overnight.
Because implied volatility is backed out of live option prices rather than past returns, it works as a real-time gauge of how large a move the market expects, not which direction it will take.
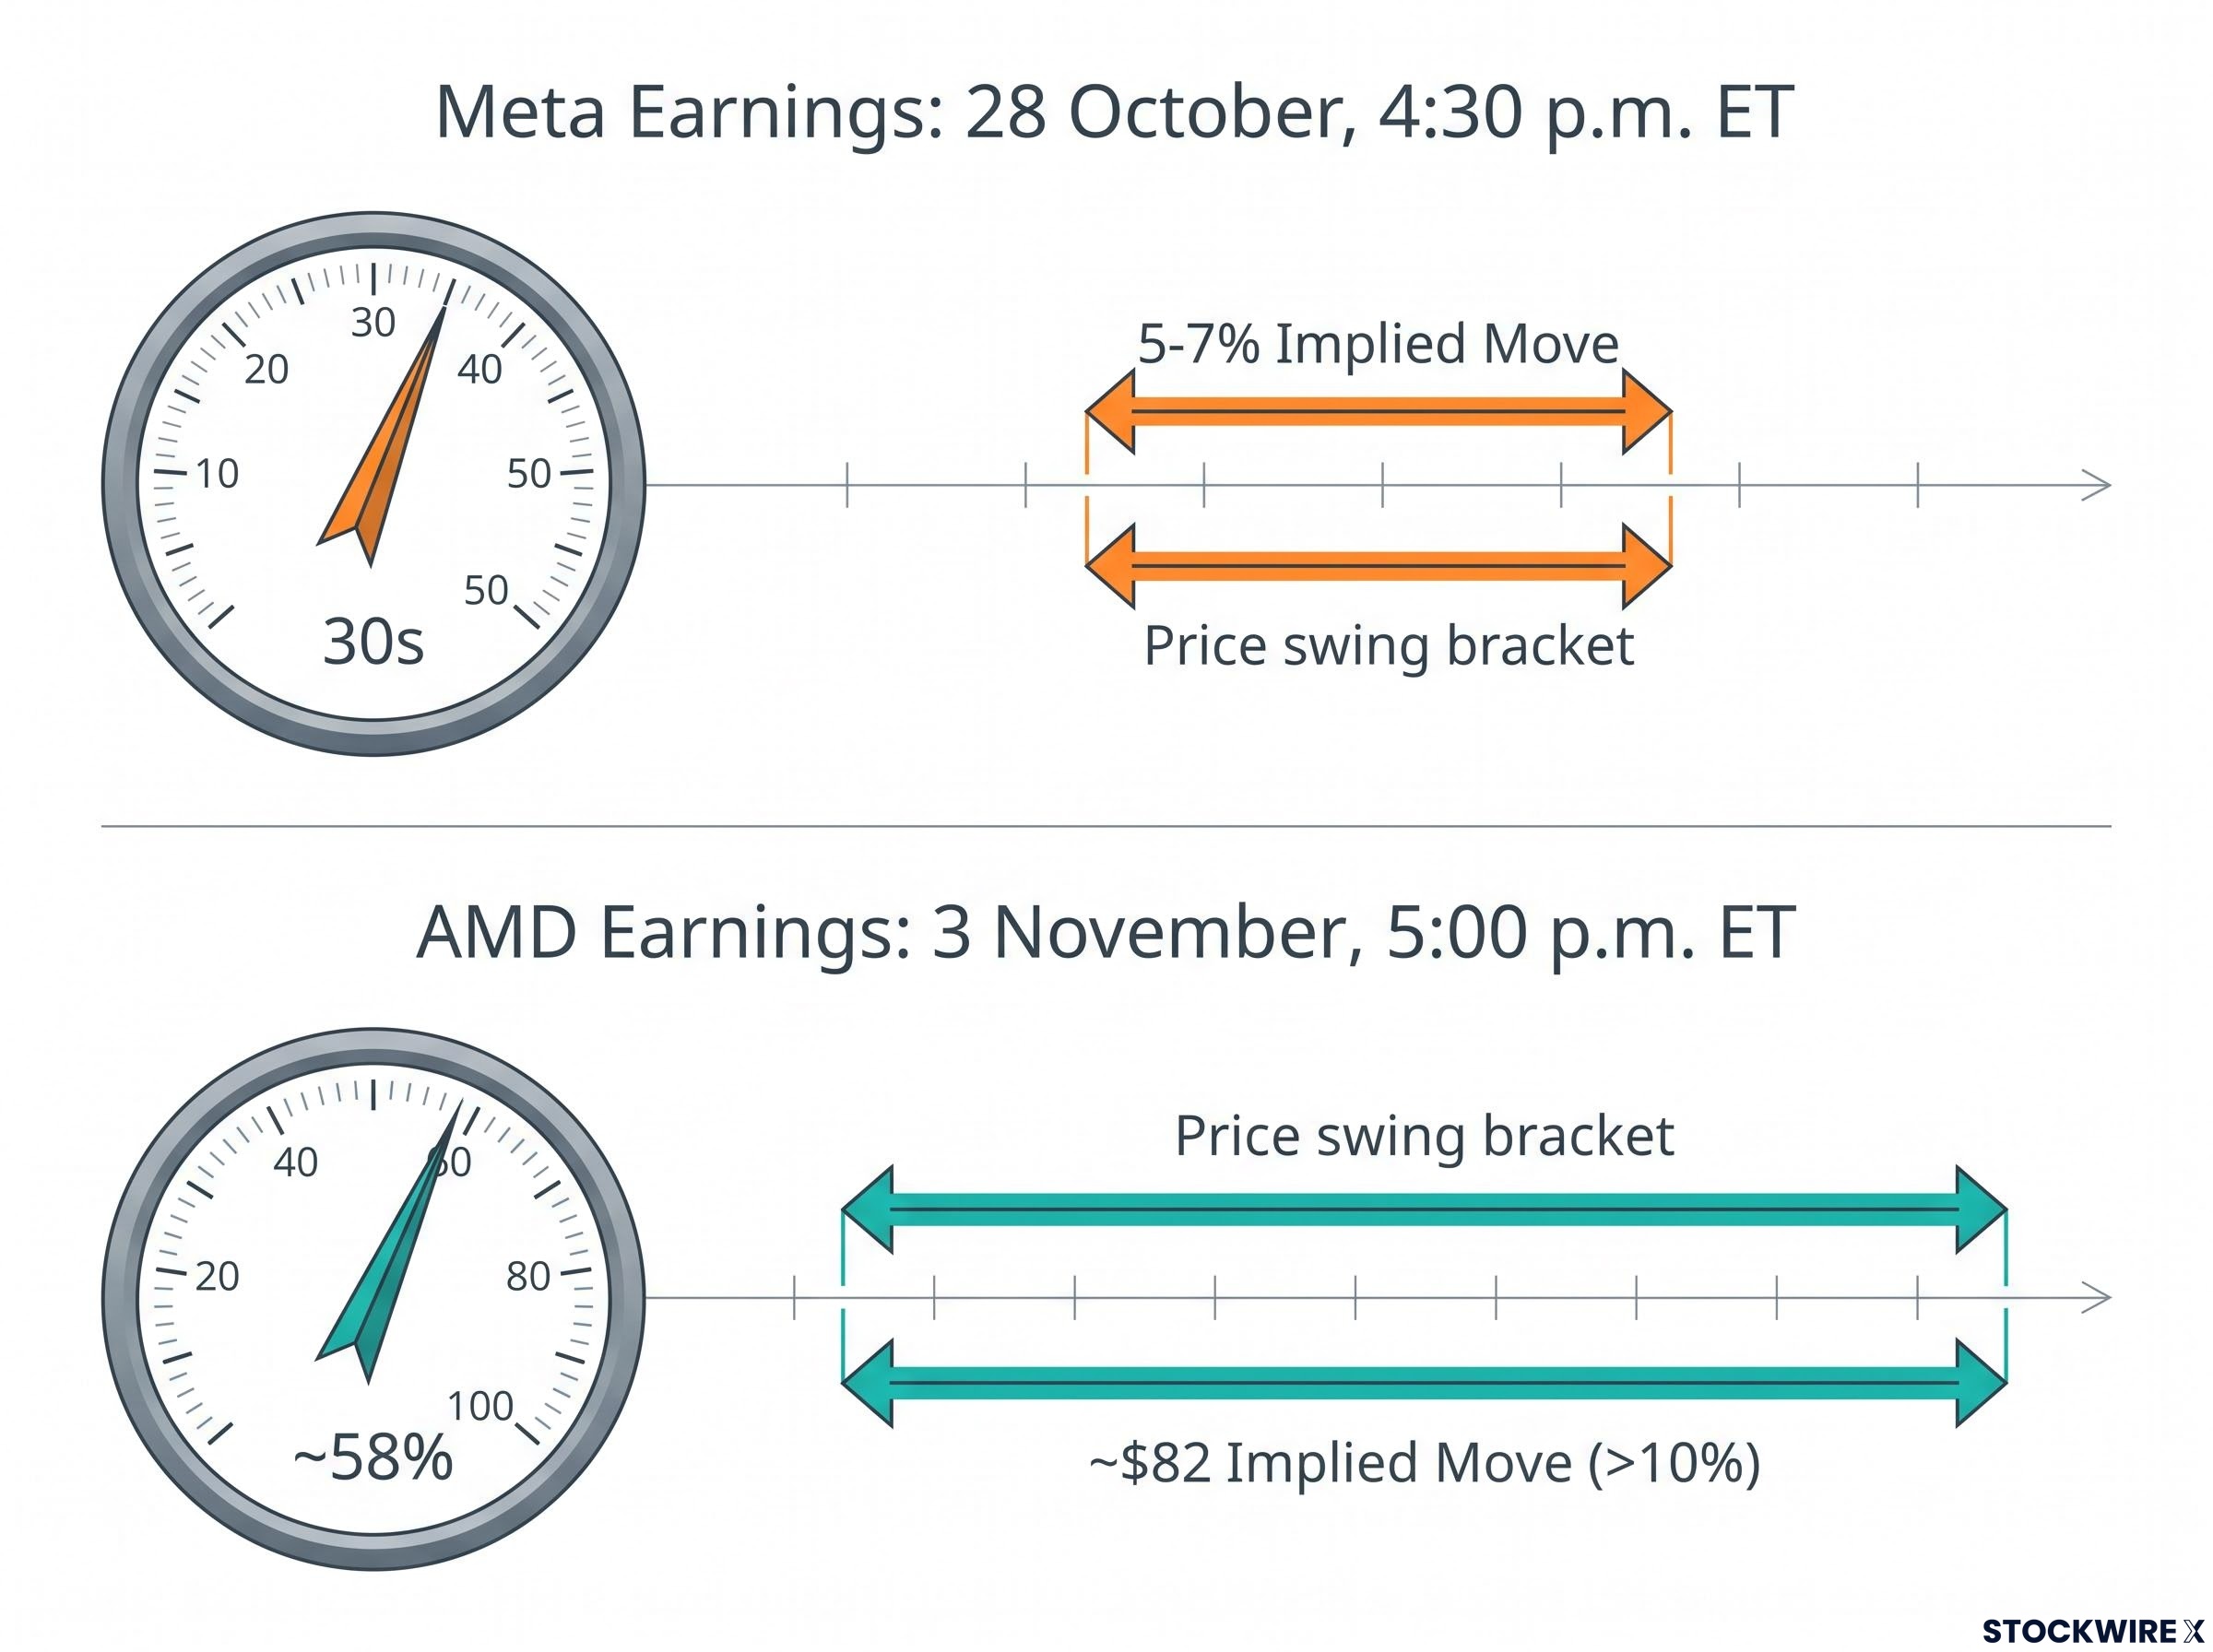
AMD’s near-term IV sits around 50% and climbs to about 58% into its report. That translates to an implied earnings move of about $82, well over 10%. Meta’s IV runs in the 30s, with an implied move in the mid-single digits to low double digits; the Tasty Trade presenter behind the options data estimates roughly 5-7%, shrinking as the date approaches.
You can check an implied move yourself in three steps:
- Find the at-the-money straddle (a call and a put at the strike closest to the current price) for the expiration just after earnings.
- Divide the straddle’s combined price by the share price to get the implied move as a percentage.
- Compare that percentage to the distance between the current price and the analyst target.
Meta reports after the close on 28 October, with a call at 4:30 p.m. ET. AMD follows on 3 November, with its call at 5:00 p.m. ET.
What an implied move does and does not tell you
An implied move measures magnitude, not direction. An $82 swing on AMD is priced in either direction, so high IV is not a bullish signal.
Vol crush Vol crush is the sharp fall in implied volatility after an event such as an earnings report, once the uncertainty has passed. It often leaves the actual move smaller than the implied move.
During the 2023-2024 AI rally, implied moves frequently exceeded realised ones. The research did not provide historical average post-earnings moves for either stock, so treat these figures as prices rather than track records. The practical read: one earnings reaction could carry AMD a meaningful distance toward $800, while Meta would need several such moves to approach $1,000.
What options-implied probabilities say about $1,000 and $800
Implied moves set the scale. Probabilities turn that scale into odds for a specific price level, and two measures matter.
In-the-money (ITM) probability is the chance a stock finishes beyond a price level at expiration. Call delta, which measures how much an option’s price changes for each $1 move in the stock, is often used as a rough proxy for it. Touch probability is the chance the stock hits that level at any point before expiration.
Rule of thumb Touch probability is always higher than ITM probability, and under standard assumptions it is roughly double.
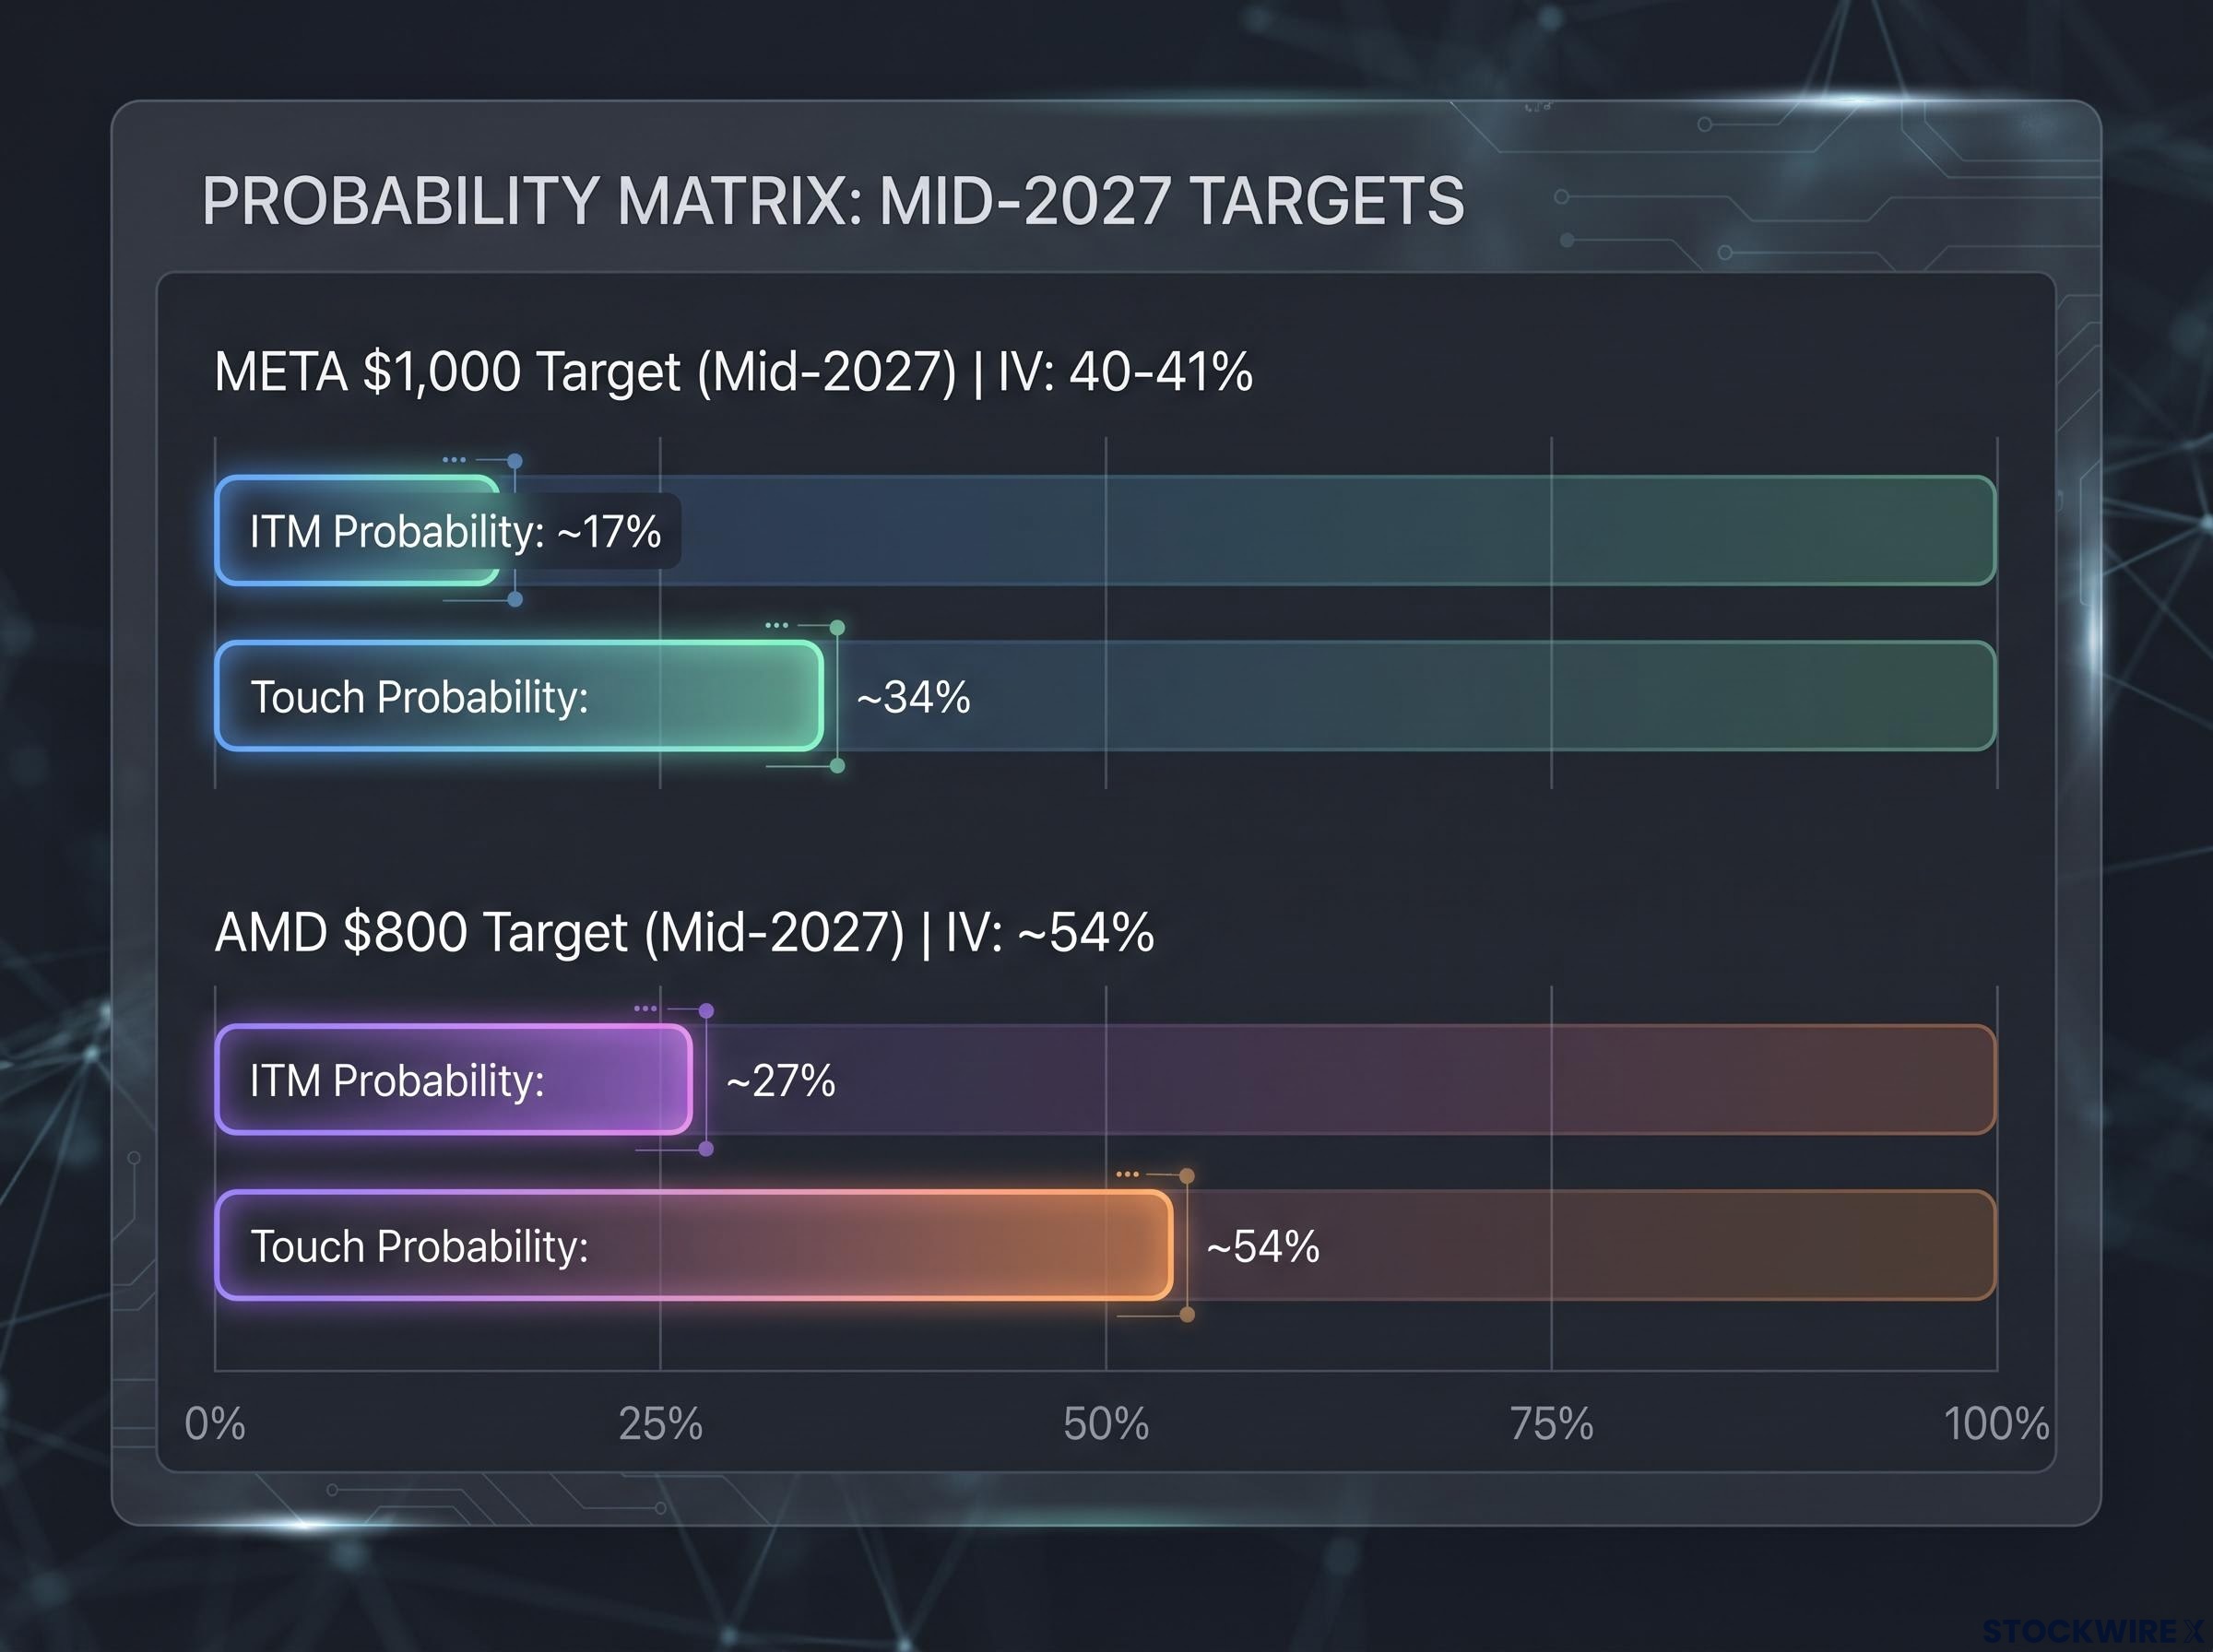
Start with Meta. For nearer-term expirations, $1,000 sits outside one standard deviation, a statistical band that captures the range of moves the options market treats as typical. Elevated strikes in those cycles show low single-digit to low-teen probabilities. Only by mid-2027, with IV around 40-41%, does $1,000 reach roughly one standard deviation, at about 17% ITM and 34% touch.
AMD’s numbers move faster. In the November cycle, about 45 days out, $800 carries roughly 14% ITM probability. December, which captures earnings, lifts that to about 18%, and mid-2027 at IV near 54% shows about 27% ITM and 54% touch.
| Stock/Target | Expiration | IV | ITM probability | Touch probability |
|---|---|---|---|---|
| Meta $1,000 | Nearer-term | Not cited | Low single digits to low teens | Not cited |
| Meta $1,000 | Mid-2027 | 40-41% | ~17% | ~34% |
| AMD $800 | November (~45 days) | Not cited | ~14% | Not cited |
| AMD $800 | December (includes earnings) | Not cited | ~18% | Not cited |
| AMD $800 | Mid-2027 | ~54% | ~27% | ~54% |
The conclusion follows from the data. AMD’s higher volatility makes $800 both more probable and sooner than Meta’s $1,000.
That puts Citi’s target close to a coin flip on a touch basis, while Wells Fargo’s sits as a minority outcome. Weigh that before treating either as a base case. For Meta to shift those odds, the presenter points to strong earnings, a broad market rally and easing concerns about rates, inflation and crude oil.
Product cycle or narrative: what the numbers cannot tell you
The probabilities describe how the market prices risk. They say nothing about whether Muse is a lasting business, and the case that it is has real weight.
Muse reached about 3 million users in its early weeks, with reports ranging from 2.8 million installs by day 12 to more than 6 million later. It hit the top of Apple’s US App Store, and Meta reported a 60% increase in daily users engaging with its assistant. 24/7 Wall St. sizes Muse at more than $27 billion in revenue by 2030; Deutsche Bank puts it at $36 billion. Citi’s Atif Malik ties the AMD target directly to Meta, a major AMD server customer whose AI agents need computing power.
The sceptical case comes partly from Wells Fargo itself:
- Product cycle: fast adoption, rising engagement, revenue sizing from two firms, and an explicit compute link to AMD.
- Scepticism: Wells Fargo’s Ken Gawrelski models 2027 operating expenses of $210-215 billion against a Street figure near $202 billion, and 2027 EPS of $31-32 (model: $31.18) against consensus near $34.
Recovery arrives in 2028, with EPS of $40.02, and MarketWatch reports a best case of $1,211 per share. That changes how you should read the target. It is a bet on 2028 earnings, not on this quarter’s report, so the 28 October date is a weak signal for it.
The sceptical case is easier to weigh when Meta is viewed through three valuation lenses, since a PEG ratio near 1.0 can look modest while 2026 capex guidance of $130-145 billion nearly doubles last year’s spend.
Options pricing has limits of its own:
- IV reflects risk-neutral pricing, which embeds risk premiums and can run above realised volatility.
- Skew prices downside and upside differently, so higher put IV signals priced risk, not a forecast.
- Event volatility deflates after earnings, often leaving realised moves smaller than implied ones.
- IV does not encode direction, path or post-event shifts in regime.
Where each company’s risk sits
For Meta, the risks are expense intensity, the 2027 earnings drag, uncertain monetisation timing and a valuation multiple sensitive to higher long-term rates. For AMD, they are concentration in hyperscaler spending, competition from Nvidia and the cyclical exposure of a semiconductor stock.
Precedent cuts both ways. In the 2023-2024 AI boom, targets were hit when product cycles met earnings surprises and missed when narratives ran ahead of monetisation.
Past performance does not guarantee future results. Analyst targets and options-implied probabilities are subject to market conditions and various risk factors.
Testing any analyst target before you trust it
The method holds for any target you read:
- Convert the target into market cap and percentage upside.
- Read the implied move against the distance to the target.
- Compare ITM and touch probabilities across expirations.
- Stress test the result against the fundamental case.
Right now, options pricing ranks AMD’s $800 as the nearer target and Meta’s $1,000 as a longer-dated, lower-probability call. That is pricing, not a forecast.
The next update arrives soon. Meta’s report on 28 October and AMD’s on 3 November will reset implied volatility and the probabilities built on it, so re-run the check after each.
This article is for informational purposes only and should not be considered financial advice. Investors should conduct their own research and consult with financial professionals before making investment decisions.