
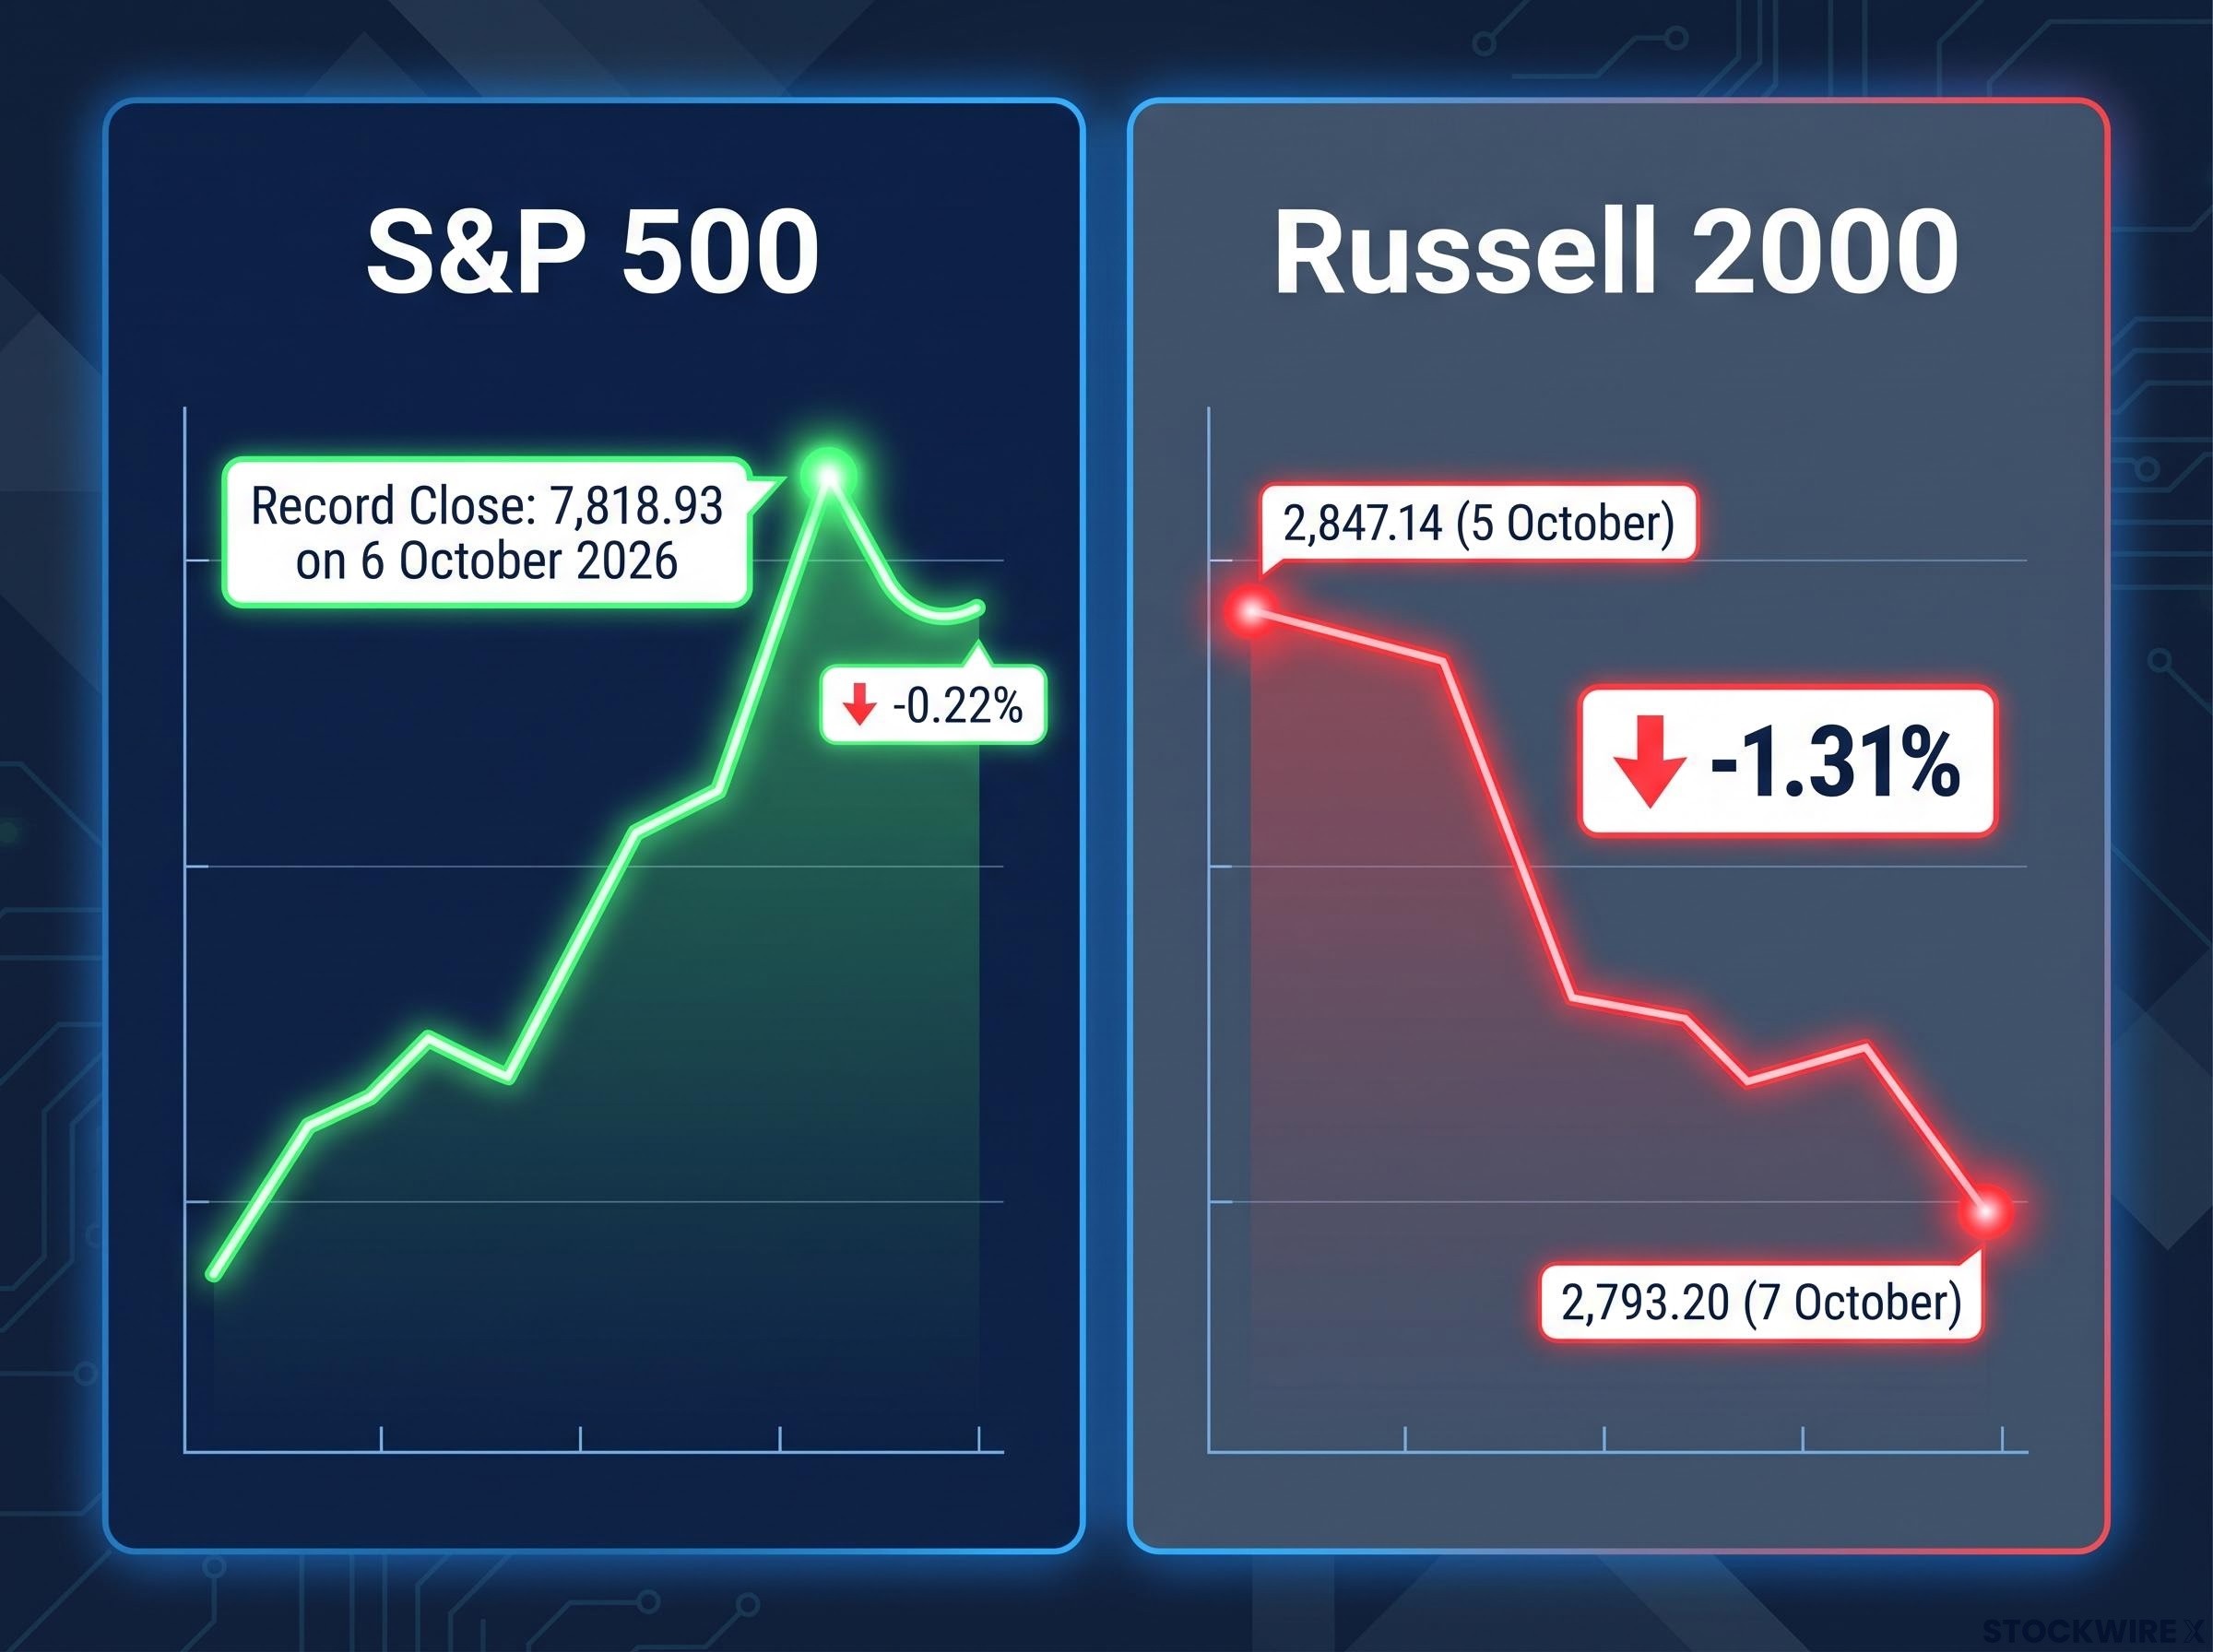
The S&P 500 set a record close of 7,818.93 on 6 October 2026. One day later, the Russell 2000 fell 1.31% while the large-cap index slipped just 0.22%. If you are trying to read technical analysis reversal signals, that gap between a headline record and the weakness beneath it is where your attention belongs.
Technicians are pointing to two specific warnings. The first is an island reversal in SPY (the S&P 500 exchange-traded fund), ES (S&P 500 futures), XLK (the technology sector fund) and QQQ (the Nasdaq-100 fund). The second is a minor failed breakout in SPY and ES.
The damage is not confined to US large caps. Small caps, international shares, gold and bitcoin all softened in the same session, which turns this week into a live case study.
You will not get a market call here. You will get a method: how these patterns work, how to test them against other markets, and how to weigh them against a bullish case that still has real evidence behind it.
What do island reversals and failed breakouts actually tell you?
On a chart, both patterns look like a market that reached higher and could not stay there. The logic behind them is about people. Specifically, it is about buyers who end up stuck.
How an island reversal forms
An island reversal is a price bar, or a small cluster of bars, separated from the rest of the chart by a gap on each side. A gap is a price range where no trading took place between one session and the next. The market gaps up, trades in isolation, then gaps back down, leaving the bar stranded like an island.
Tuesday 6 October is that island in SPY, ES, XLK and QQQ. The days on either side posted highs below Tuesday’s low. Everyone who bought on Tuesday now holds a position the market has walked away from, and their selling can feed the next leg down.
Why failed breakouts trap late buyers
A failed breakout happens when price pushes above resistance, a level where selling has previously capped rallies, then drops back into its old range. The push signals there was not enough demand above the line. Late buyers who chased the move are left underwater and often cut their positions.
You can judge whether a breakout is genuine or a trap by checking volume confirmation, since closes above resistance on thin volume are the ones most likely to fall back into the range.
After Tuesday’s lifetime high, SPY and ES dipped below the gap that formed between Monday and Tuesday. QQQ and its futures contract did not fail, though. They remain above their breakout level, which keeps the signal mixed.
Failures near major highs often come before at least a multi-week correction. They do not reliably come before a bear market.
How reliable are islands? Thomas Bulkowski, author of Encyclopedia of Chart Patterns, treats islands as signs of trend exhaustion that produce tradable moves more often than not, but he does not rank them among the most reliable patterns.
StockCharts ChartSchool, the CMT Association and major brokerages add that islands carry more weight near prior highs and on heavy volume, and that you should wait for follow-through. Islands are also rare on major indexes, so the historical sample is thin. Three things commonly break these patterns:
- Strong secular bull markets with solid earnings weaken failed-breakout signals.
- Options expiries, index rebalancing and index inclusions can produce temporary false failures.
- Analysts define the patterns differently, which skews the statistics.
| Pattern | What it looks like | Who gets trapped | Common failure mode |
|---|---|---|---|
| Island reversal | Bar or cluster isolated by gaps on both sides | Buyers who entered on the island | Broader trend stays strong and the gap is reclaimed |
| Failed breakout | Push above resistance that falls back into the range | Late buyers above resistance | Expiry or rebalancing noise; strong earnings revive the trend |
A modest island at a record high tells you the burden of proof has moved to buyers. Treat it as a reason to watch for confirmation, not as an instruction to sell.
When big ASX news breaks, our subscribers know first
Where else are the cracks showing, and why does correlation matter?
A single chart can mislead you. Several charts weakening together carry more weight, so it helps to check other markets one at a time.
Start with small caps. The Russell 2000 fell from 2,847.14 on 5 October to 2,793.20 on 7 October, and its futures broke below a trend line with a fresh price gap. Abroad, one trader’s charts show emerging markets turned back at a trend line several times since a 22 June peak, while EFA (the developed ex-US fund) has trended lower since mid-August. Metals and crypto showed the same direction of travel.
| Market | Observation | Reported move (7 Oct) | Shared driver |
|---|---|---|---|
| Russell 2000 | Trend line break, fresh gap | -1.31% | Rates, liquidity |
| Emerging markets | Repeatedly repelled at trend line | About -1.25% | Dollar strength |
| EFA | Downtrend since mid-August | -1.07% | Dollar strength |
| KORU / FXI | South Korea and China weakness | -4.16% / just over -1% | Dollar, risk appetite |
| Gold, miners, XME | Gold breaks May 2025 trend line; possible move below $4,000; GLD toward 365, then about 363.60 | XME more than -3% | Dollar, rates |
| Bitcoin / MSTR | Down thousands of dollars; possible low $70,000s | MSTR roughly -6% | Rates, liquidity |
France’s CAC 40 has repeatedly failed bullish breakouts, and GDX (gold miners) shows no support below current levels. The gold, bitcoin, emerging markets, EFA, South Korea and CAC 40 readings come from one analyst and could not be independently verified, so weigh them accordingly.
Three forces can push these markets down at the same time:
- Rates and duration: Higher yields raise the discount rate applied to future earnings, hitting long-duration assets such as small caps, speculative tech and bitcoin hardest.
- US dollar strength: A stronger dollar weighs on foreign markets and on dollar-priced commodities like gold.
- Liquidity and risk appetite: Tighter liquidity and rising volatility prompt investors to cut risk everywhere at once.
That matters for you because simultaneous weakness from one common cause is really one signal repeated. Cross-asset confirmation only adds weight when the markets are falling for independent reasons.
Rising gold and copper correlations with equities show why metals weakening alongside stocks may reflect one shared macro driver, not an independent warning.
Bear case versus rotation case
The bearish reading calls this late-cycle risk-off behaviour. History offers examples: failed breakouts and gap patterns preceded the 2000 and 2007 tops, but the 2015 and 2018 gap clusters produced 10-20% corrections rather than multi-year bear markets.
The bullish reading says money is rotating, not leaving. Artificial intelligence and semiconductor leadership can carry large caps while small caps and international markets wait for rates to settle.
How does a bearish-leaning trader turn these signals into positions?
Theory becomes clearer when you watch someone apply it. The trader whose charts feature above is openly bearish, and his choices show how selective pattern-based positioning can be. Treat what follows as illustration, not recommendation.
Semiconductors: weak charts, not weak sector
The SOX semiconductor index fell about 1.75% on Wednesday and SMH dropped over 1.5%, after a channel midline capped prices from Friday to Tuesday and gave way. Even so, he avoids AMD, which sits near a record high, along with Micron and Nvidia, and covered his Micron short. He shorts broken charts instead:
- Semiconductors and hardware: AAOI (about 5.5% lower), AXTI (about 5%), AMAT (about 2%), CRDO, Western Digital (about 2%, next support roughly $100 lower) and Seagate (targeting a price gap).
- Consumer and media: Viasat and Tesla (down 0.75%).
- Speculative growth: IONQ (about 5% lower).
His largest short is DIA, the Dow fund, with a stop near 51,350.
Interest-sensitive stocks and the midterm window
Utilities (XLU) bounced strongly on Tuesday, a relief rally he had expected. His ideal path is a stall near resistance, then a fall below $39 around the 3 November midterm elections. In his view, most of the bounce is probably done.
The bullish rebuttal A significant share of reversal patterns fail, so institutions often treat them as secondary to earnings revisions and credit spreads.
Strong mega-cap earnings and margins, plus persistent AI leadership, can keep indexes rising through technical cracks. The selectivity here tells you pattern-based positioning is about relative chart weakness, not a blanket view that everything falls.
How do you manage risk when a reversal signal might fail?
Some of these patterns will fail. Plan for that outcome as a normal event, not a surprise. A disciplined process looks like this:
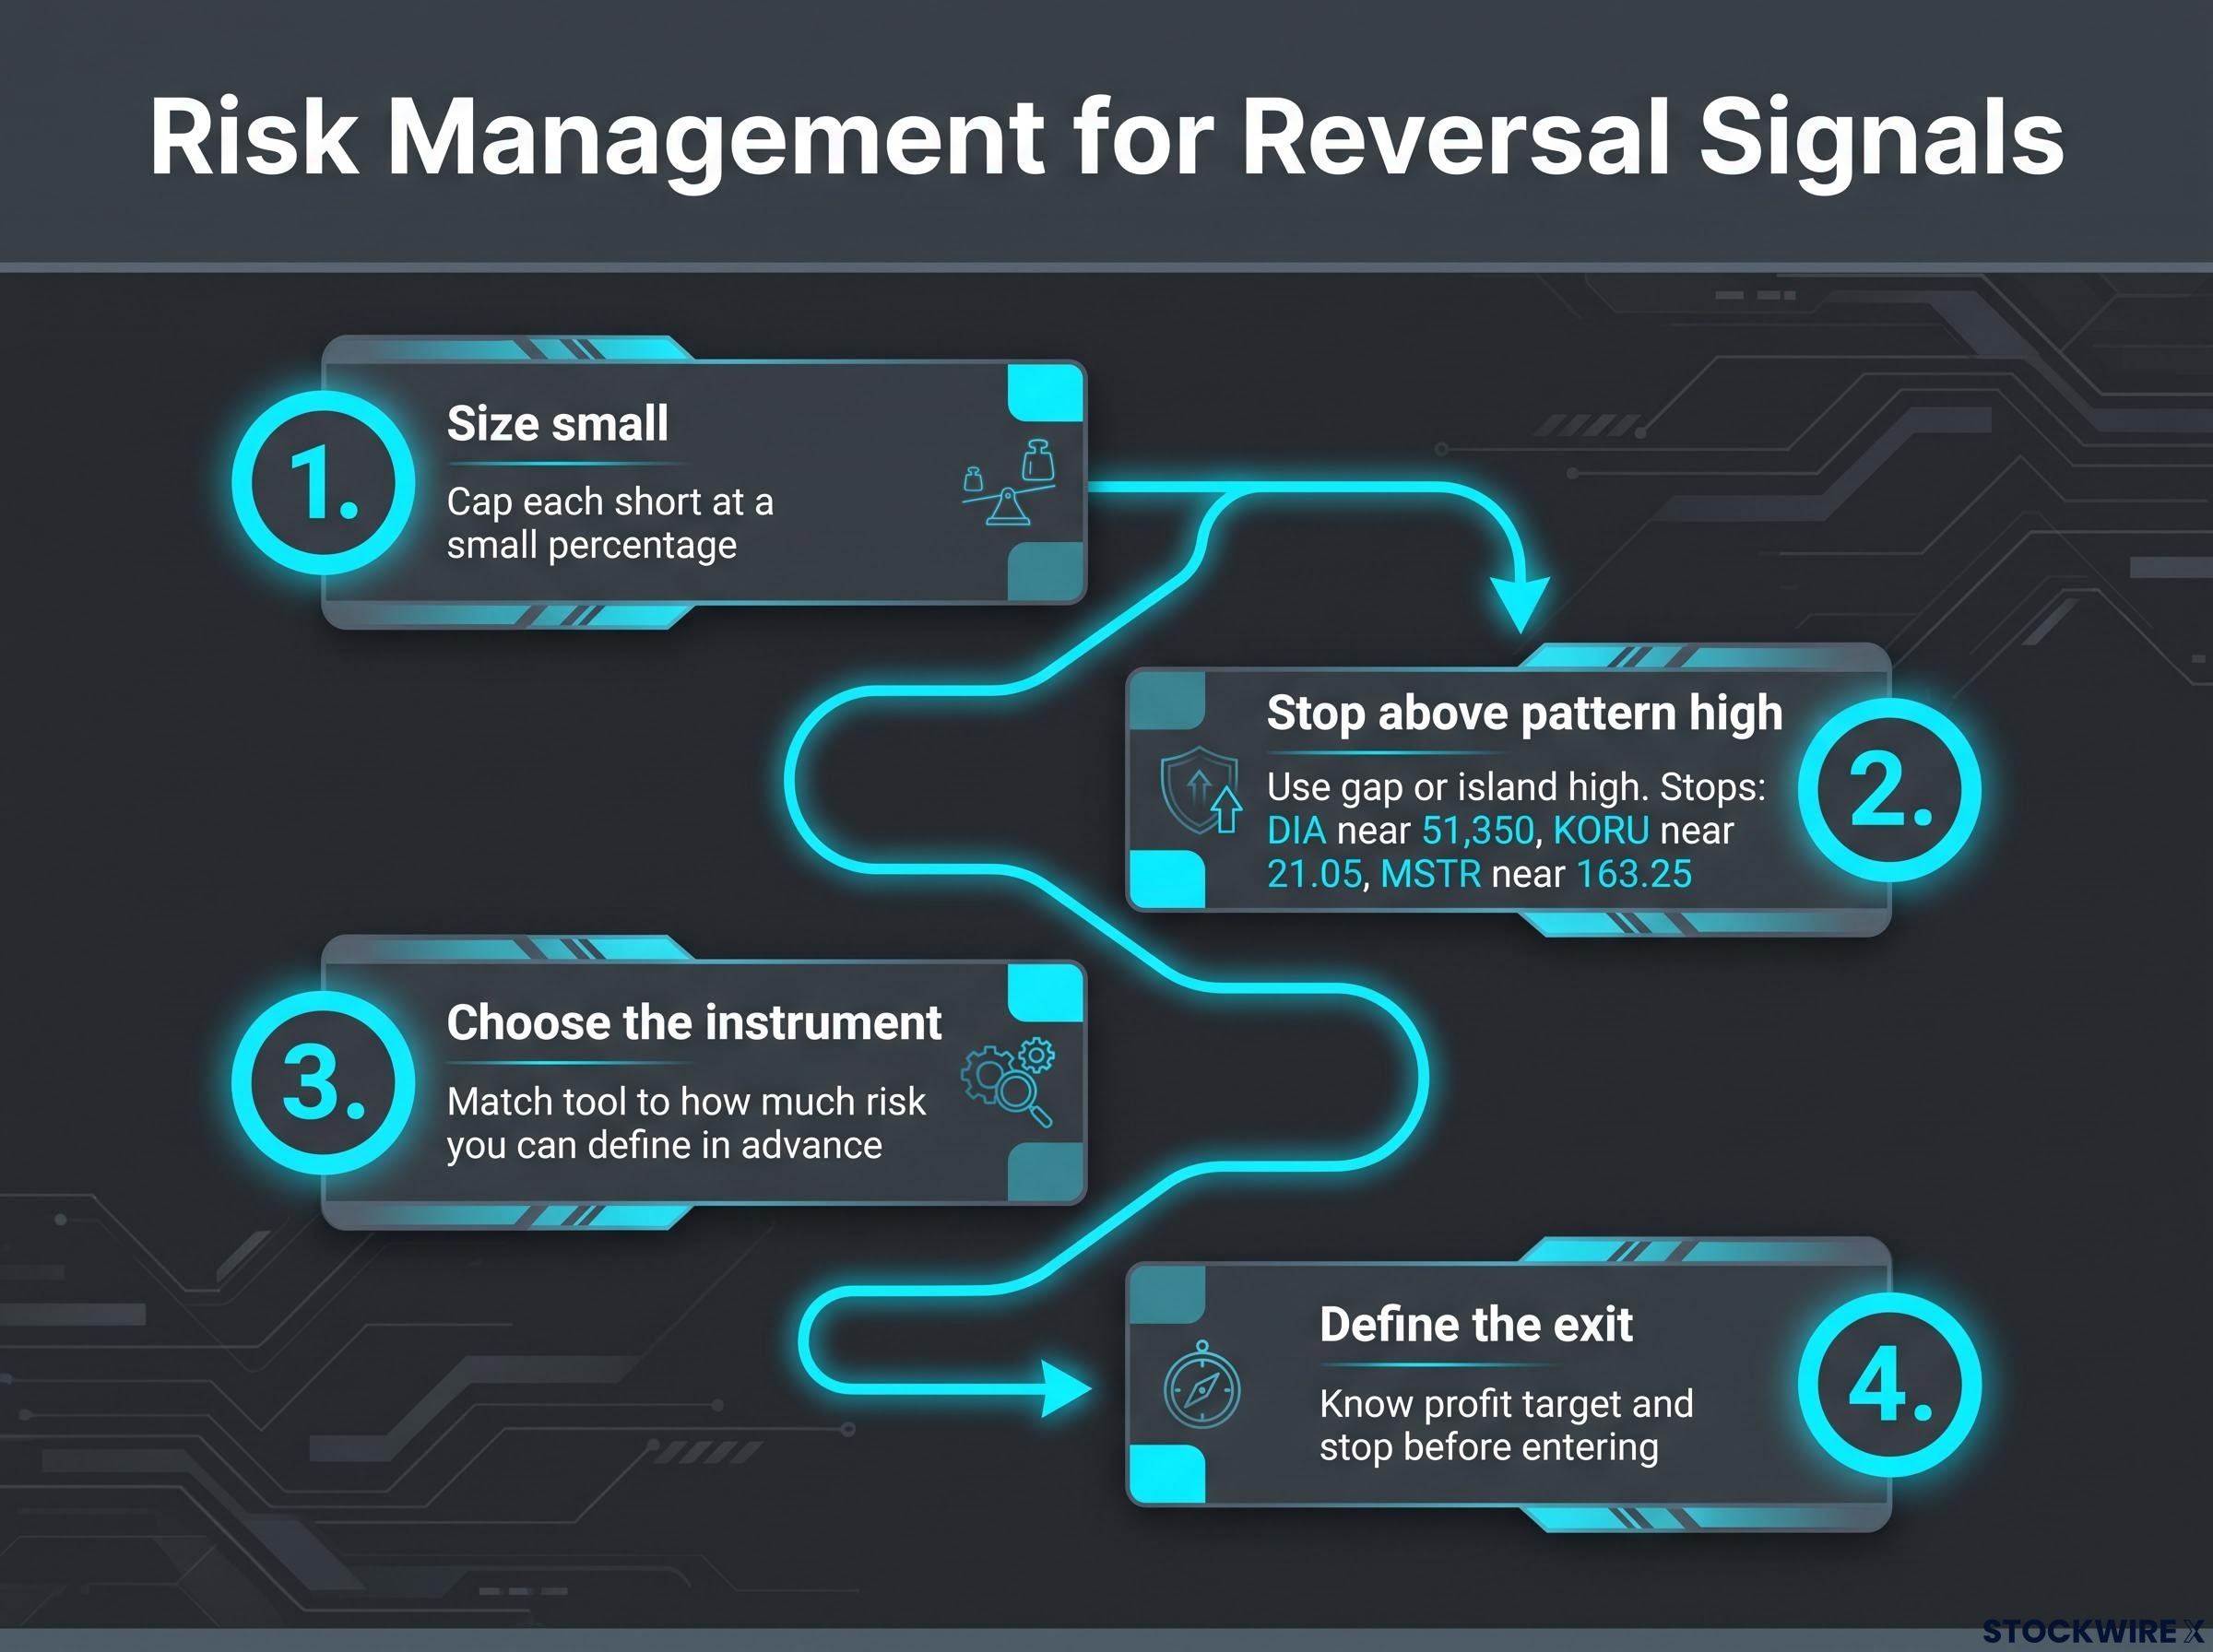
- Size small: Cap each short at a small percentage of your capital so you can make several attempts.
- Place the stop above the pattern high: Use the gap or island high, so a failed pattern costs a defined amount. The trader’s stops at DIA near 51,350, KORU near 21.05 and MSTR near 163.25 follow this logic.
- Choose the instrument: Match the tool to how much risk you can define in advance.
- Define the exit: Know your profit target and your stop before you enter.
| Instrument | Risk defined? | Main hazard | Suitability |
|---|---|---|---|
| Shorting plain ETFs | Only with a stop | Squeezes, borrow costs | Experienced traders |
| Puts or put spreads | Yes, limited to premium paid | Option can expire worthless | Traders wanting fixed risk |
| Shorting leveraged ETFs | Only with a tight stop | Sharp counter-trend rallies, tightening margin | Highest risk |
Leveraged funds rebalance daily, which creates volatility decay (an erosion of returns when prices swing back and forth) and path dependency, meaning returns depend on the sequence of moves, not just the end point. Borrow can become expensive or disappear, and margin requirements can rise during volatility spikes. Puts avoid borrow fees and recall risk entirely.
A bear market is not guaranteed; 2015 and 2018 ended in finite corrections. Because many reversal patterns fail, your edge comes from how small you keep each loss, not from how often you are right.
Trading expectancy explains why small losses matter more than hit rate: a strategy that wins 40% of the time can still outperform one that wins 70% if its losses stay contained.
Past performance does not guarantee future results. These statements are speculative and subject to change based on market developments.
Weighing the signals: what the cracks do and do not prove
The island and the failed breakout flag fragility at a record high, and weakness across small caps, foreign markets, metals and crypto adds weight. Rates, earnings, liquidity and leadership will decide whether this becomes a tradable pullback or a major top.
Four markers deserve your attention:
- Whether the Monday-Tuesday gap is reclaimed
- Whether QQQ holds its breakout level
- Whether the Russell 2000 keeps breaking down
- How markets behave around the 3 November midterms
Treat these signals as a prompt to review your risk and wait for confirmation, not as an order to act.
This article is for informational purposes only and should not be considered financial advice. Investors should conduct their own research and consult with financial professionals before making investment decisions.