Over the past year, one tech ETF fell roughly 33% while another gained about 26%, and both are sold as “tech exposure”. Treat technology as a single bucket and you miss the signal sitting in that gap.
Data here is current to early October 2026. Anyone weighing a tech allocation this month faces three very different products among ASX tech ETFs: the domestic BetaShares S&P/ASX Australian Technology ETF (ATEC), the AI-themed Global X Artificial Intelligence ETF (GXAI), and the concentrated mega-cap Global X FANG+ ETF (FANG).
Here is what the data tells you about which kind of tech risk each fund carries, and which one fits around your existing portfolio. This is general information only, not personal advice.
Why use an ETF for tech exposure instead of picking stocks?
Many investors start with the urge to find the next WiseTech or Nvidia. An exchange-traded fund (ETF) is a single listed holding that owns many companies, so you do not have to predict which part of tech wins.
Technology has been among the largest contributors to share market gains over the last ten years. BetaShares positions ATEC as a way to avoid picking winners amid rapid disruption and binary outcomes, while Global X pitches GXAI and FANG as ways to express a theme while diversifying away single-stock risk.
Commentary from Livewire, Motley Fool Australia and the AFR argues ETFs suit investors without the time to research names such as WiseTech, Pro Medicus, Palantir or Nvidia. The trade-off is plain:
- You gain: diversification, easier access and lower single-company risk.
- You give up: some single-stock upside, which experienced investors may prefer to chase through stock-picking.
Issuers and Morningstar Australia generally frame thematic tech funds as satellite holdings around a diversified core, more volatile and cyclical than broad-market ETFs. That tells you a tech ETF is a decision about how much concentration you will accept, not a decision to avoid risk.
When big ASX news breaks, our subscribers know first
What do ATEC, GXAI and FANG actually hold?
| Fund | MER and FUM | Number of holdings | Top holdings and weights |
|---|---|---|---|
| ATEC | 0.48%; about $545-558M | 42-49 (S&P/ASX All Technology Index) | Computershare about 10-11%, then Xero, TechnologyOne, Pro Medicus, Codan, CAR Group, NEXTDC, REA Group, WiseTech |
| GXAI | 0.57%; about $285-289M | 89 | Palantir about 4.1%, Microsoft about 3.6%, SpaceX about 3.3%, Meta |
| FANG | 0.35%; about $1.77B | 10, equal-weighted | Micron about 11%, Palantir about 10.5%, Nvidia about 10.4%, Meta about 10.4%, Microsoft about 10.1%, Netflix about 8.6% |
MER is the management expense ratio, the annual fee taken from the fund. FUM is funds under management, the fund’s total size.
ATEC delivers domestic software and marketplace exposure, yet its top 10 holdings make up about 72-74% of assets. KoalaGains called the portfolio “extremely top-heavy” on 29 June 2026.
GXAI covers the AI value chain, with technology about 70% of the fund and semiconductors about 25.4%. It launched in April 2024. FANG is almost entirely ten names, and both global funds are unhedged against the AUD/USD exchange rate.
So “diversified” means something different in each. GXAI is the most spread by name count, ATEC is concentrated by weight in a small domestic group, and FANG is a ten-stock bet.
Investors exploring why domestic software lagged will find our deep-dive into ASX information technology shares explains how high gross margins and recurring revenue sit behind a negative index return.
Why did domestic tech fall while global tech rose?
Start with the numbers. The S&P/ASX All Technology Index fell more than 34% over one year.
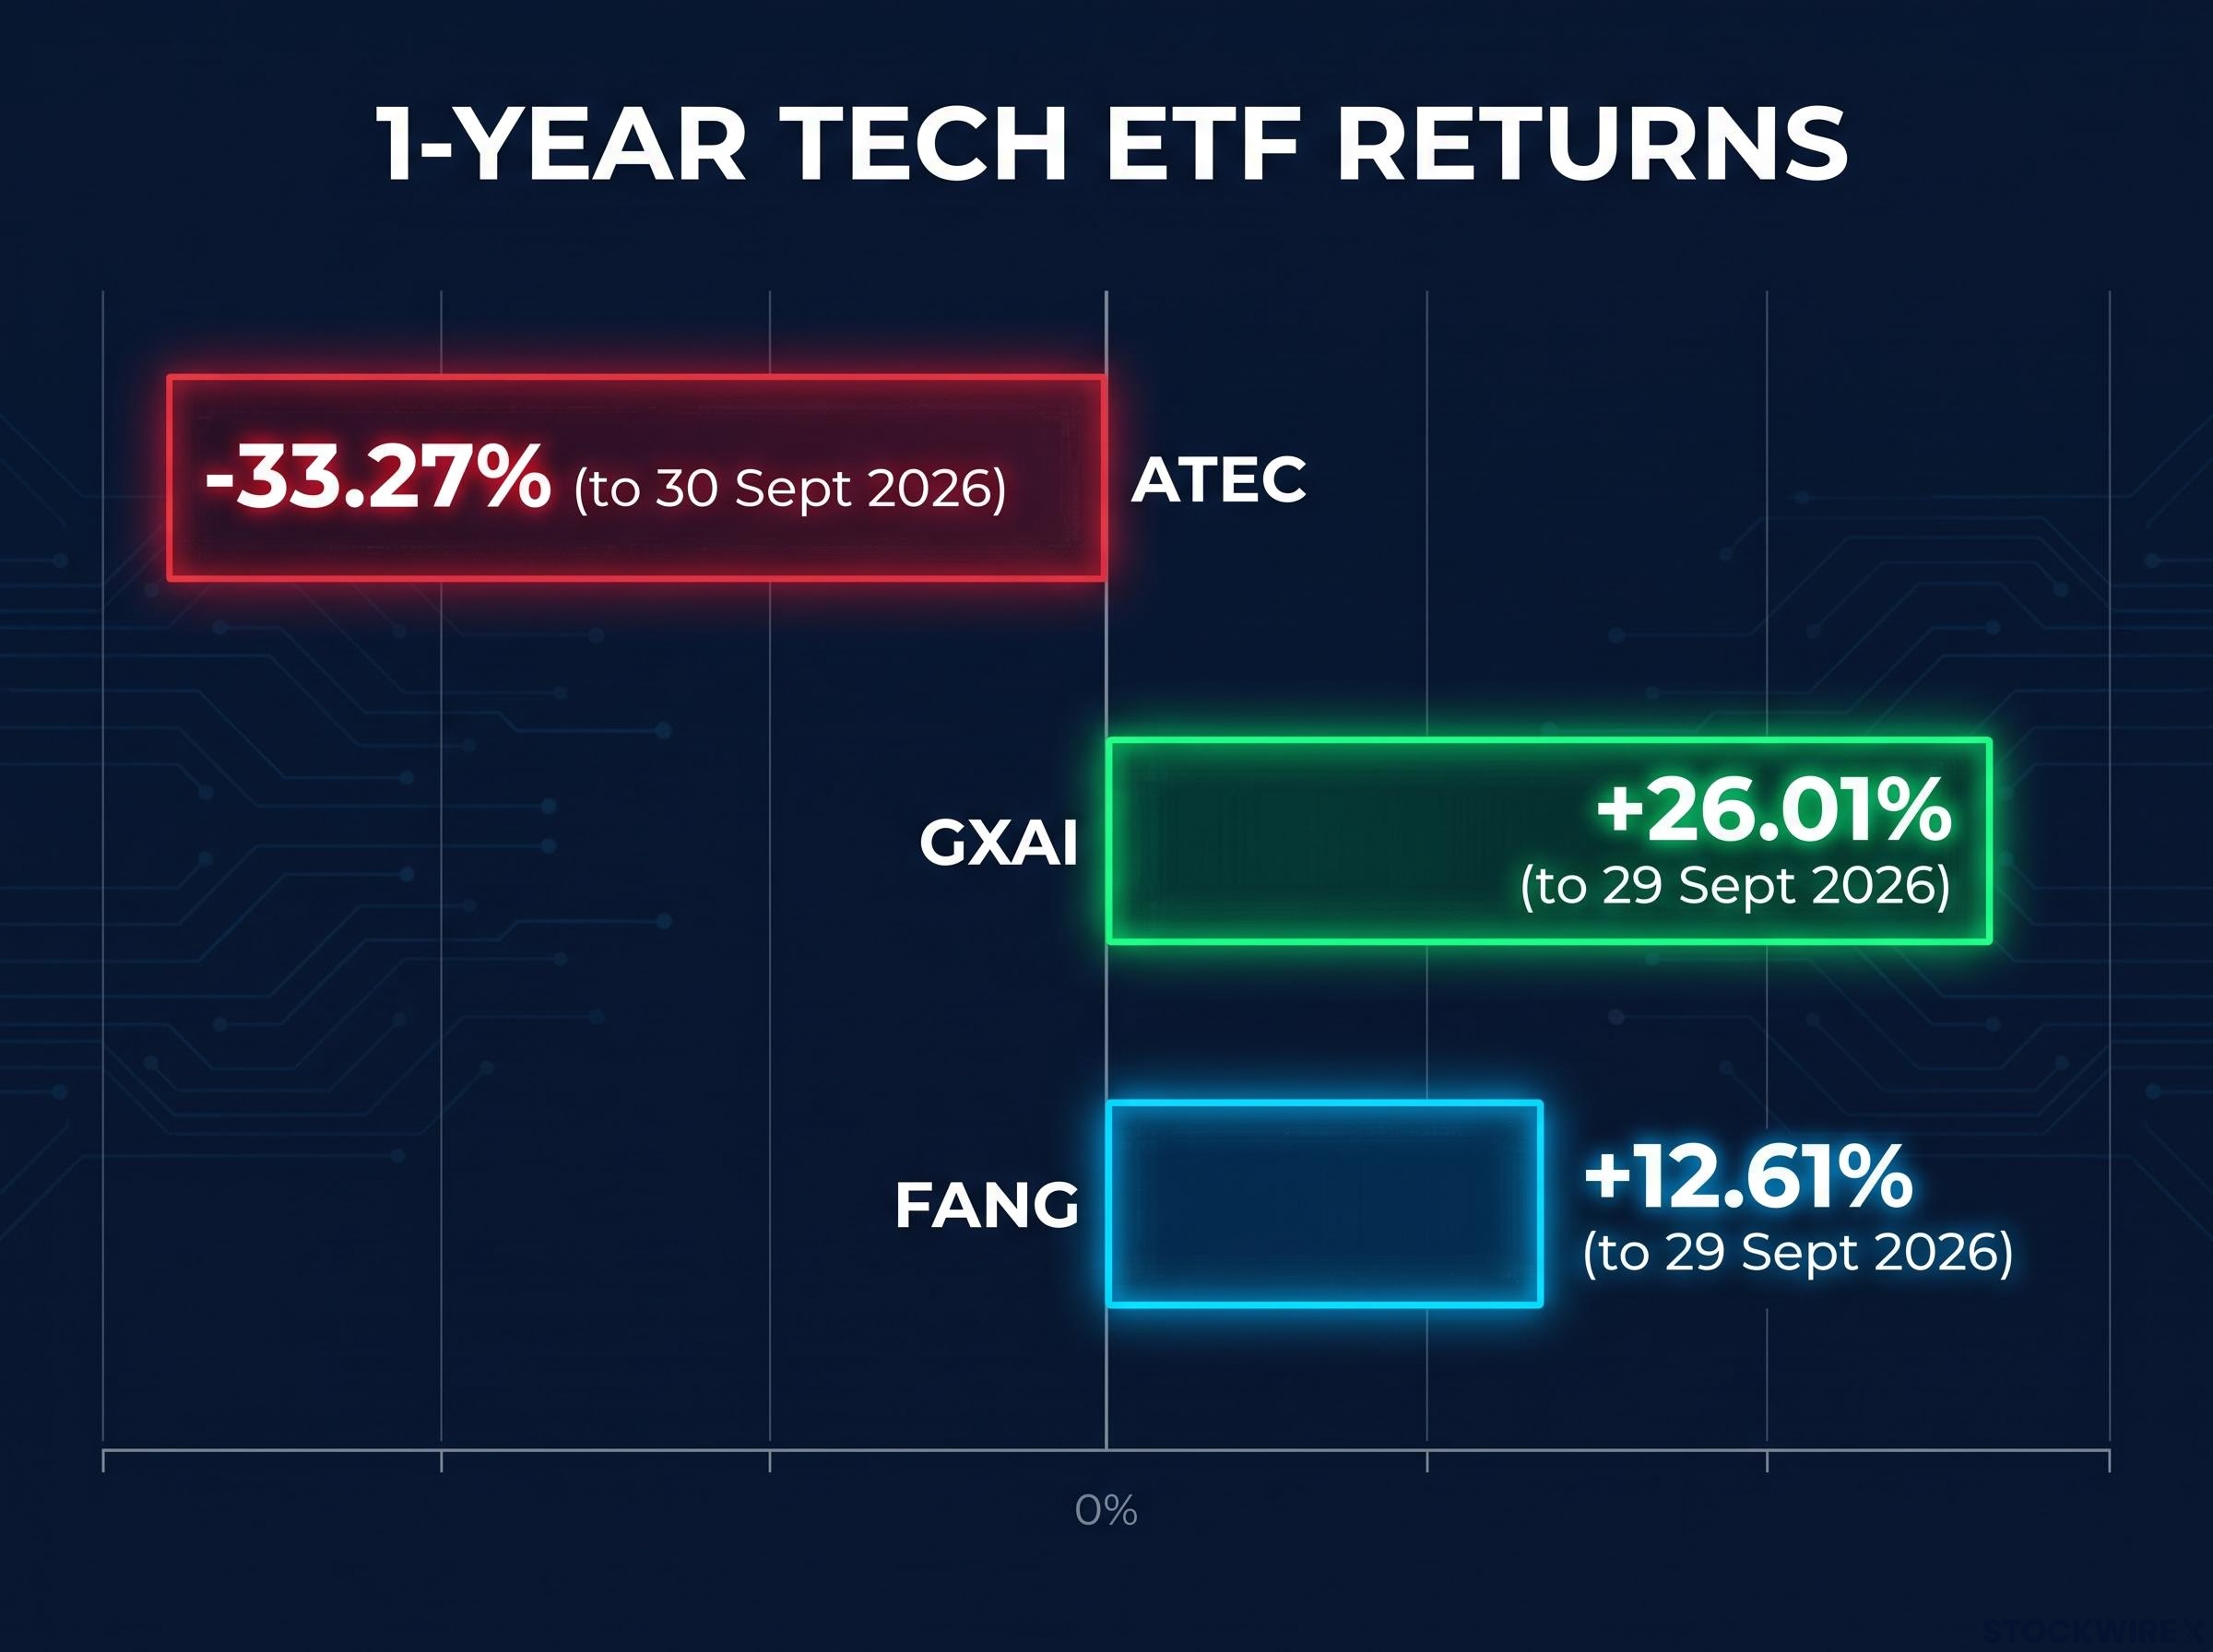
| Fund | 1-year | 3-year p.a. | 5-year p.a. | Since inception p.a. |
|---|---|---|---|---|
| ATEC | -33.27% | 4.86% | -1.39% | n/a |
| GXAI | 26.01% | n/a | n/a | 27.70% |
| FANG | 12.61% | 33.78% | 22.97% | 29.13% |
ATEC figures are InvestSMART data to 30 September 2026; GXAI and FANG are to 29 September 2026. BetaShares reports a different ATEC one-year return of -28.05%, but that runs to 31 August 2026, so the gap reflects a further month of weakness. GXAI has no 3- or 5-year record because it is under three years old. No ASX 200 IT or Nasdaq-100 comparator was located.
The contrast: ATEC about -33% versus GXAI about +26% over one year.
The drivers explain why this looks structural rather than random:
- Rates and valuations: higher rates in 2022-23 compressed valuations for long-duration growth stocks, and many smaller ASX tech names trade on higher multiples.
- AI capex cycle: spending on chips, data centres and cloud favours semiconductor and hyperscaler firms, which fits GXAI’s roughly 25% semiconductor weighting.
- Earnings momentum: mega-caps have posted strong AI, cloud and advertising earnings.
- Software disruption fears: AI raises doubts over legacy software revenue, limiting ATEC multiples.
- AUD/USD: a weaker dollar lifts unhedged US returns; a stronger one trims them.
What this tells you is which risks were rewarded recently, not which will be next. Treat the returns as context, not a forecast.
The rates driver comes down to equity duration: companies whose value rests on earnings many years away lose more from a higher discount rate than businesses generating cash today.
Which risks and overlaps should shape your choice?
Strong returns hide specific fragilities. The numbered list below sets out the main ones.
- ATEC concentration: supporters say the top-heavy structure mirrors the ASX tech landscape, but critics warn stock-specific problems become fund-level problems.
- FANG concentration: equal-weighting avoids dependence on one giant but raises exposure to volatile constituents.
- GXAI and FANG overlap: both hold Microsoft, Meta, Nvidia and Palantir, so they would likely fall together in a sell-off.
- Currency and US exposure: both global funds carry unhedged AUD/USD risk and exposure to US policy.
- AI bubble debate: some commentators compare the enthusiasm to the dot-com boom; the counter-argument is that leading firms have strong free cash flow and real customers.
History offers a caution. The 2022 rate sell-off hit tech-heavy funds hardest, and the 2023-26 AI rallies were followed by sharp corrections. Holding GXAI and FANG together means doubling the same bet, so count overlap before counting funds.
Funds that share the same mega-cap names behave like one position, which is why investors need to count overlap across every ETF they hold before deciding that two products add genuine diversification.
Matching a fund to your portfolio
| Fund | Exposure it provides | Main risk | Possible portfolio role |
|---|---|---|---|
| ATEC | Domestic software and marketplaces | Top-heavy weights | Domestic diversification |
| GXAI | AI value chain, semiconductors | AI cycle, currency | AI infrastructure theme |
| FANG | Ten equal-weighted mega-caps | Ten-stock concentration | Concentrated mega-cap growth |
Some commentators suggest pairing global tech with domestic tech or broad Australian equities. Others argue broad, low-cost exposure plus modest thematic allocations may serve many investors better.
Check the latest product disclosure statement (PDS), weigh your circumstances and consider professional advice. Past performance is not a reliable indicator of future results.
Sizing a tech allocation: what the three funds do and do not solve
These are three different bets, not three versions of one, and this year’s returns say little about the next. Concentration, overlap, currency and fees (0.35%, 0.48% and 0.57%) are the variables that separate them.
The decision comes down to two questions: what role does tech play in your portfolio, and how much volatility can you hold before you choose a fund?
This article is for informational purposes only and should not be considered financial advice. Investors should conduct their own research and consult with financial professionals before making investment decisions. Past performance does not guarantee future results.