Official data puts Q2 2026 GDP growth at about 2.2%, yet economist Mark Skousen says real gross output grew roughly 5% over the same quarter. Both figures describe the same economy, so which one is telling you the truth about gross output vs GDP?
The question matters now because the signals conflict. The September jobs report, released on 2 October 2026, showed only 29,000 jobs added, and consumer sentiment is poor. Meanwhile, Treasury Secretary Scott Bessent is pointing to growth above 5%.
You need a way to sort these claims. Here is what each measure counts, why Skousen believes business-to-business (B2B) spending leads the economy, and how much weight his numbers deserve.
What GDP counts, what gross output counts, and why the gap matters
Most people assume gross domestic product (GDP) is the whole economy. It is not, and the part it leaves out is deliberate.
GDP measures the value of final goods and services: consumption, investment, government purchases and net exports. Intermediate inputs, the materials and components that businesses buy from each other, are excluded so nothing is counted twice.
Gross output counts sales at every stage of production, including those business-to-business transactions. The Bureau of Economic Analysis (BEA) publishes it alongside GDP-by-industry, and treats GDP as the headline figure and gross output as a complementary production-side measure.
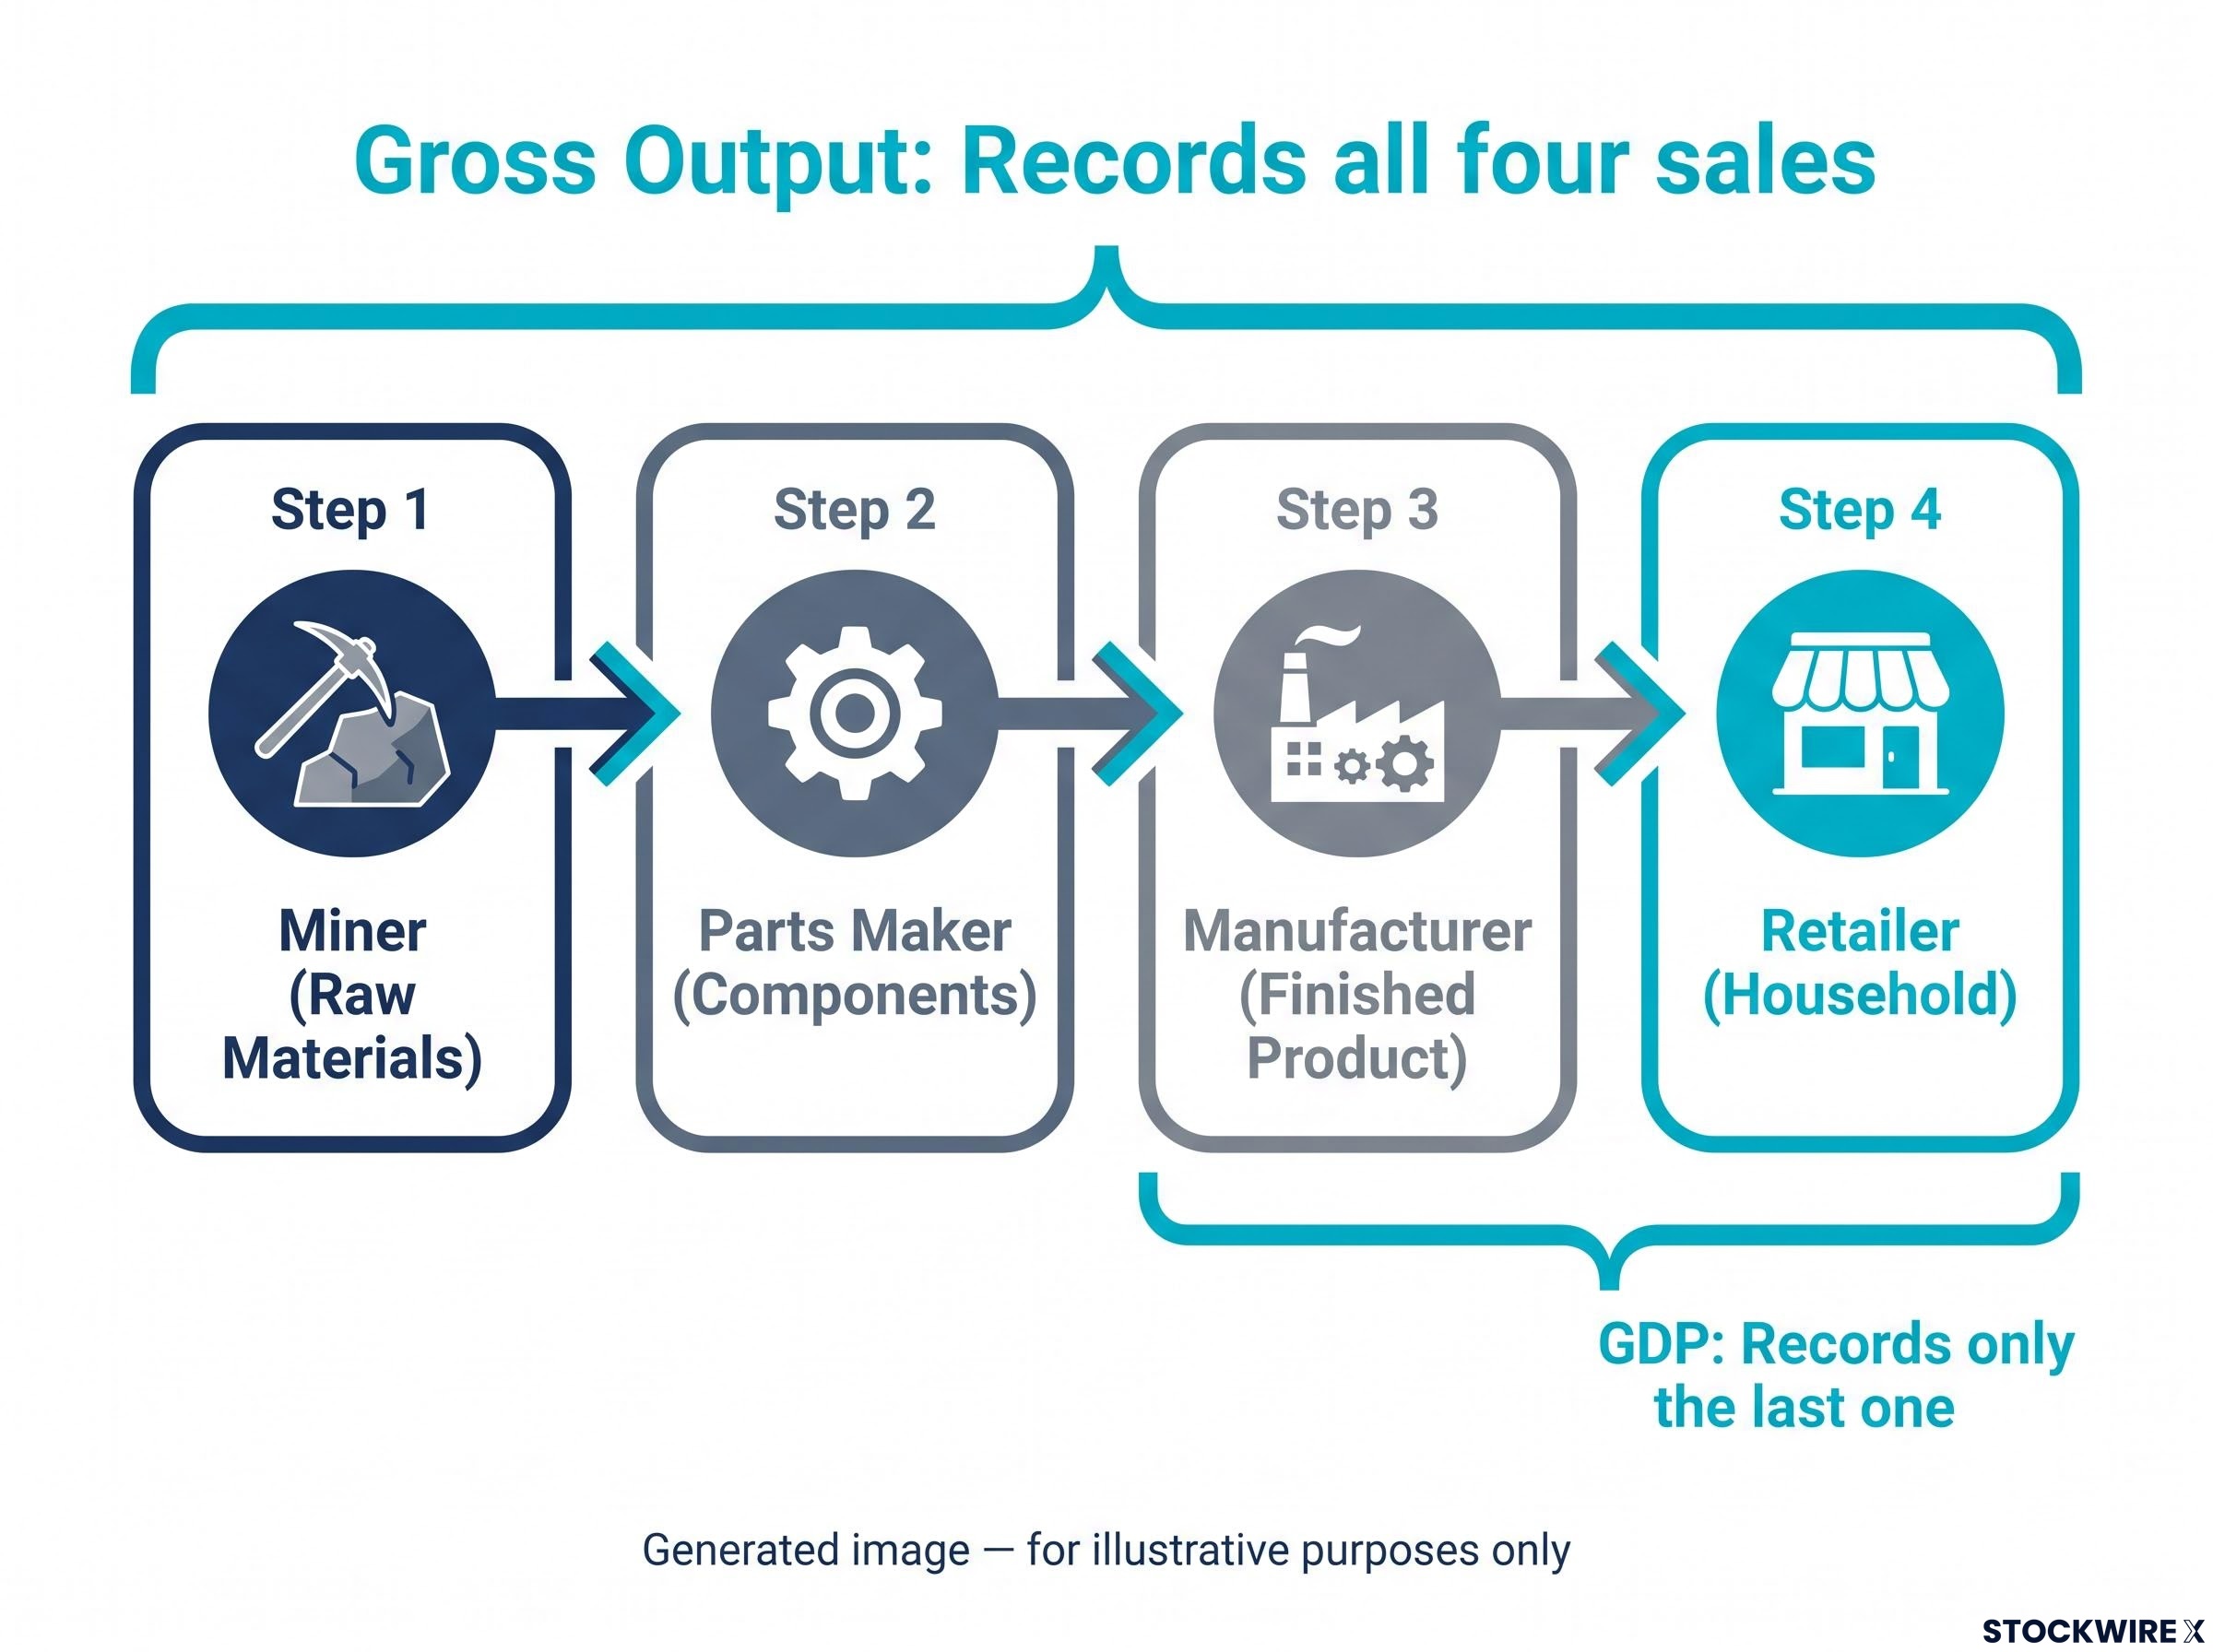
A simple supply chain shows the difference:
- A miner sells raw materials to a parts maker.
- The parts maker sells components to a manufacturer.
- The manufacturer sells a finished product to a retailer.
- The retailer sells it to a household.
Gross output records all four sales. GDP records only the last one.
| Feature | GDP | Gross output |
|---|---|---|
| What it counts | Final goods and services | Sales at every production stage |
| Intermediate inputs | Excluded | Included |
| Size and volatility | Smaller, steadier | Larger, more volatile |
| Typical use | Headline measure of final output | Production-side and structural analysis |
Skousen argues this is why gross output matters. He claims B2B spending is nearly twice consumer spending, that over 60% of spending is B2B, and that about 80% of employees work in the supply chain versus 20% in retail. These are his claims, not BEA figures.
Gross output is not “GDP but bigger.” It answers a different question: how much business activity is happening, rather than how much final value is delivered. The two can legitimately diverge.
The double-counting question
Double counting is built into gross output by design, so it is not an error. It simply means the measure tracks turnover, not income.
For the same reason, gross output does not map onto household income or living standards. Its larger numbers are partly just arithmetic.
When big ASX news breaks, our subscribers know first
Why some economists say B2B spending leads the economy
The logic runs as a chain. Before a household buys anything, a retailer has already ordered stock, a manufacturer has already bought parts, and a supplier has already shipped materials.
Firms adjust to expected demand in three places:
- Orders: businesses place or cancel purchases ahead of final sales.
- Inventories: stockpiles are built or run down before demand shifts.
- Capital spending: equipment and facilities are funded on forecasts, not current sales.
Because these decisions come first, B2B activity can turn before consumer spending and GDP do. Skousen says gross output as a leading indicator points to stronger Q3 GDP.
Capital spending is a useful early signal because firms can defer equipment purchases quickly when confidence fades, so core capital goods orders often move months before official GDP accounts do.
Skousen’s core claim B2B spending, not consumer spending, is the main engine of the U.S. economy, and its surge in Q2 2026 signals stronger growth ahead. (Mark Skousen, economist)
History offers some support, with limits. Restocking, supply-chain rebuilding and heavy investment can lift production measures before final demand catches up, and falling orders can precede downturns. Research finds production-side indicators sometimes lead GDP, but the relationship is unstable across cycles.
Skousen also says he largely ignores consumer sentiment, attributing continued spending to easy credit. BEA data show consumer spending was still a leading contributor to Q2 real GDP growth despite weak University of Michigan and Conference Board readings.
When sentiment surveys and spending data disagree, spending reflects what households actually did. That makes sentiment alone a weak guide for you.
What the Q2 2026 numbers show, and which ones you can verify
Sort these numbers into two groups: confirmed by official data, and resting on Skousen’s word.
The official path
BEA’s second estimate, released on 26 August 2026, put Q2 real GDP growth at 1.5% annualised. A later Commerce revision, reported by CNBC on 2 October 2026, lifted Q2 to 2.2% and put Q1 at 2.5%.
Because revisions can be large, as the move from 1.5% to 2.2% in Q2 shows, you should treat any single GDP release as a provisional record, not a final verdict on the economy.
| Item | Figure | Status |
|---|---|---|
| Q2 2026 GDP (latest) | 2.2% | Confirmed |
| Q2 2026 GDP (August estimate) | 1.5% | Confirmed, superseded |
| Q1 2026 GDP (revised) | 2.5% | Confirmed |
| B2B spending growth | 13.8% | Skousen’s claim |
| Real gross output growth | About 5% | Skousen’s claim |
Skousen says B2B spending rose 13.8% in Q2 and real gross output about 5%. No accessible BEA release confirms either figure.
A gap between 2.2% and 5% is meaningful only if the gross output number holds up and is not simply inventory restocking. Treat it as a hypothesis to check when BEA publishes its data.
The three drivers behind the surge
Skousen names three drivers. Supply chains are finally recovering from the pandemic, and the Trump trade war is stabilising.
The third is booming artificial intelligence (AI) spending, especially on data centres. It shows up in GDP mainly as nonresidential fixed investment and intellectual-property investment, not consumption, so only part of it lands there. That makes it the driver most likely to widen the gap between gross output and GDP.
Weak jobs and sticky prices: where the strong-business story gets tested
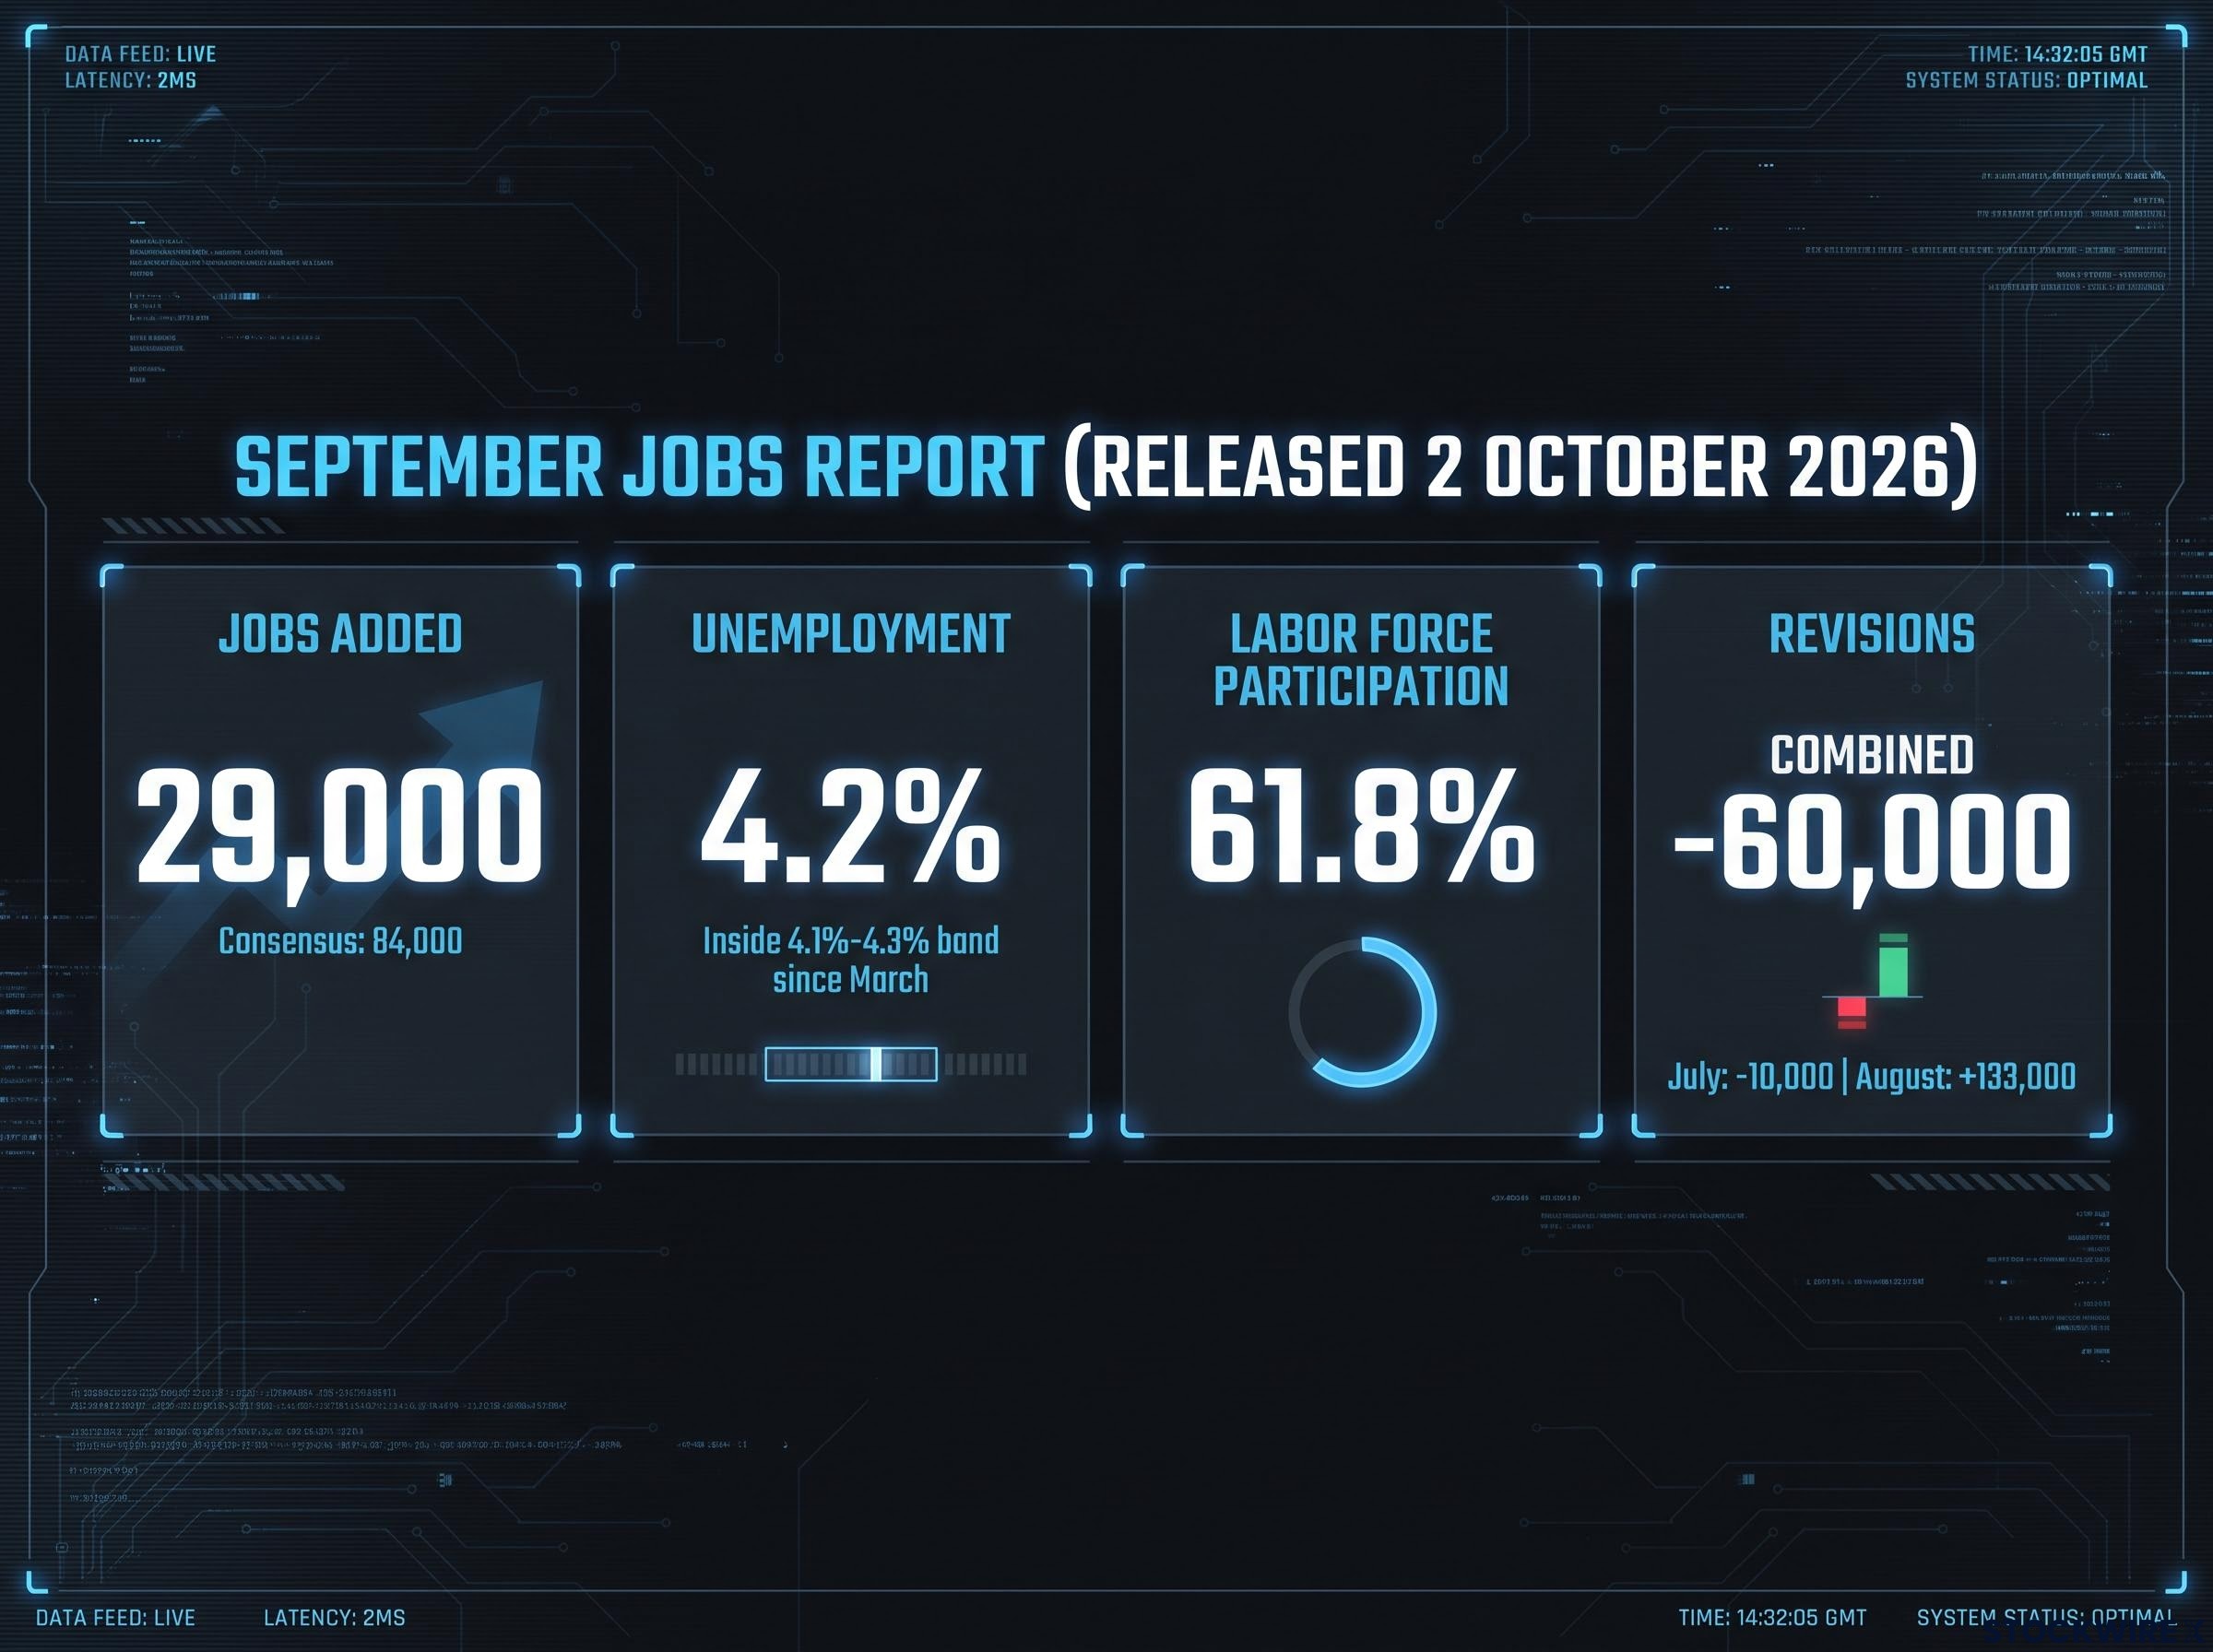
The jobs report is the strongest counterpoint to Skousen’s thesis. The official figures are confirmed:
- Payrolls rose by 29,000 against a consensus of about 84,000.
- Unemployment was 4.2%, inside a 4.1%-4.3% band since March.
- Labour force participation was 61.8%.
- July and August were revised down by a combined 60,000, with July now a loss of 10,000 and August at +133,000.
Skousen does not dispute the weakness. He attributes it to a transition period shaped by AI and employer uncertainty, and expects hiring to pick up eventually.
Mainstream explanations overlap: automation, caution about demand and regulation, and capital deepening, where investment raises output without adding workers. Strong business activity does not guarantee strong hiring. For your household finances, the jobs and inflation data matter more than either output measure.
Two views of the economy Treasury Secretary Scott Bessent cited the Atlanta Fed’s GDP tracker as showing growth above 5% and said core inflation is subdued. Skousen agrees the economy is expanding but says inflation is not contained.
The GDPNow path, reported as 5.0% in late September and about 3.7% on 1 October, comes from the original source and is unverified.
Is inflation contained?
Treasury officials say inflation is on a path back to target. Critics point to housing, health care and services costs that keep rising for households.
Skousen rejects the core inflation measure because it excludes food and energy. He cites “shadow” statistics suggesting inflation near 10% and says the economy has entered an era of permanent inflation. Mainstream economists reject the methods behind such series as non-transparent.
The research holds no latest CPI or core readings, and the Iran conflict’s energy effects are unverified, so neither can be treated as settled.
Using gross output without over-trusting it
Mainstream economists treat gross output and B2B spending as supplements, not replacements for GDP. Households consume final goods, not intermediate inputs, so gross output says little about welfare.
Its large swings can also overstate short-term moves, and central banks rarely target it. Read a gross output surge as a sign of strong business activity, then wait for GDP, jobs and prices to confirm it before drawing conclusions about your own finances.
If AI capex growth slows toward the mid-teens by 2027, as some projections suggest, the B2B surge Skousen describes could fade before it ever reaches final demand.
Watch these next:
- The BEA gross output release.
- Q3 GDP.
- The next jobs report.
- The next CPI release.
Reading the signals together: what to confirm before trusting the strong-economy story
Gross output and GDP measure different things, so they can disagree without either being wrong. Skousen’s thesis is plausible, but his specific figures remain unconfirmed, and the weak jobs data and inflation dispute are unresolved.
Treat B2B activity as an early signal, and wait for official GDP, payroll and CPI data to confirm it. The BEA gross output release, Q3 GDP and the next jobs and CPI reports will show which story holds.
This article is for informational purposes only and should not be considered financial advice. Investors should conduct their own research and consult with financial professionals before making investment decisions.
These statements are speculative and subject to change based on market developments and company performance.