Firmus is asking investors to pay A$11 a share for a market capitalisation of about A$44 billion, a company with almost no financial history behind it, while broker valuations stretch as high as A$128 billion. That is a number with no earnings under it yet, and the Firmus Technologies ASX float forces you to decide how much faith to place in forecasts alone.
The deal is set to be the second-largest ASX float by market value after Telstra. Institutional bidding runs this week, the prospectus is due on 12 October, and listing is targeted for 23 October 2026. Demand is reported to be well in excess of the offer, yet fund managers are split.
Firmus is a useful live case for a wider problem: how to judge any pre-revenue AI infrastructure listing. Here is a working method, built from the Firmus numbers, for separating what is known from what is assumed.
What explains the gap between A$44bn and A$128bn for one company?
One company, two price tags separated by roughly A$84 billion. It looks like chaos, but the numbers are measuring different things.
Equity value is what shareholders own: about US$30.6 billion (A$43.7-44 billion) at A$11. Enterprise value (EV) adds debt to equity, so it captures the whole business. Deal analysts estimate US$20-30 billion of debt, and that gap explains most of the difference.
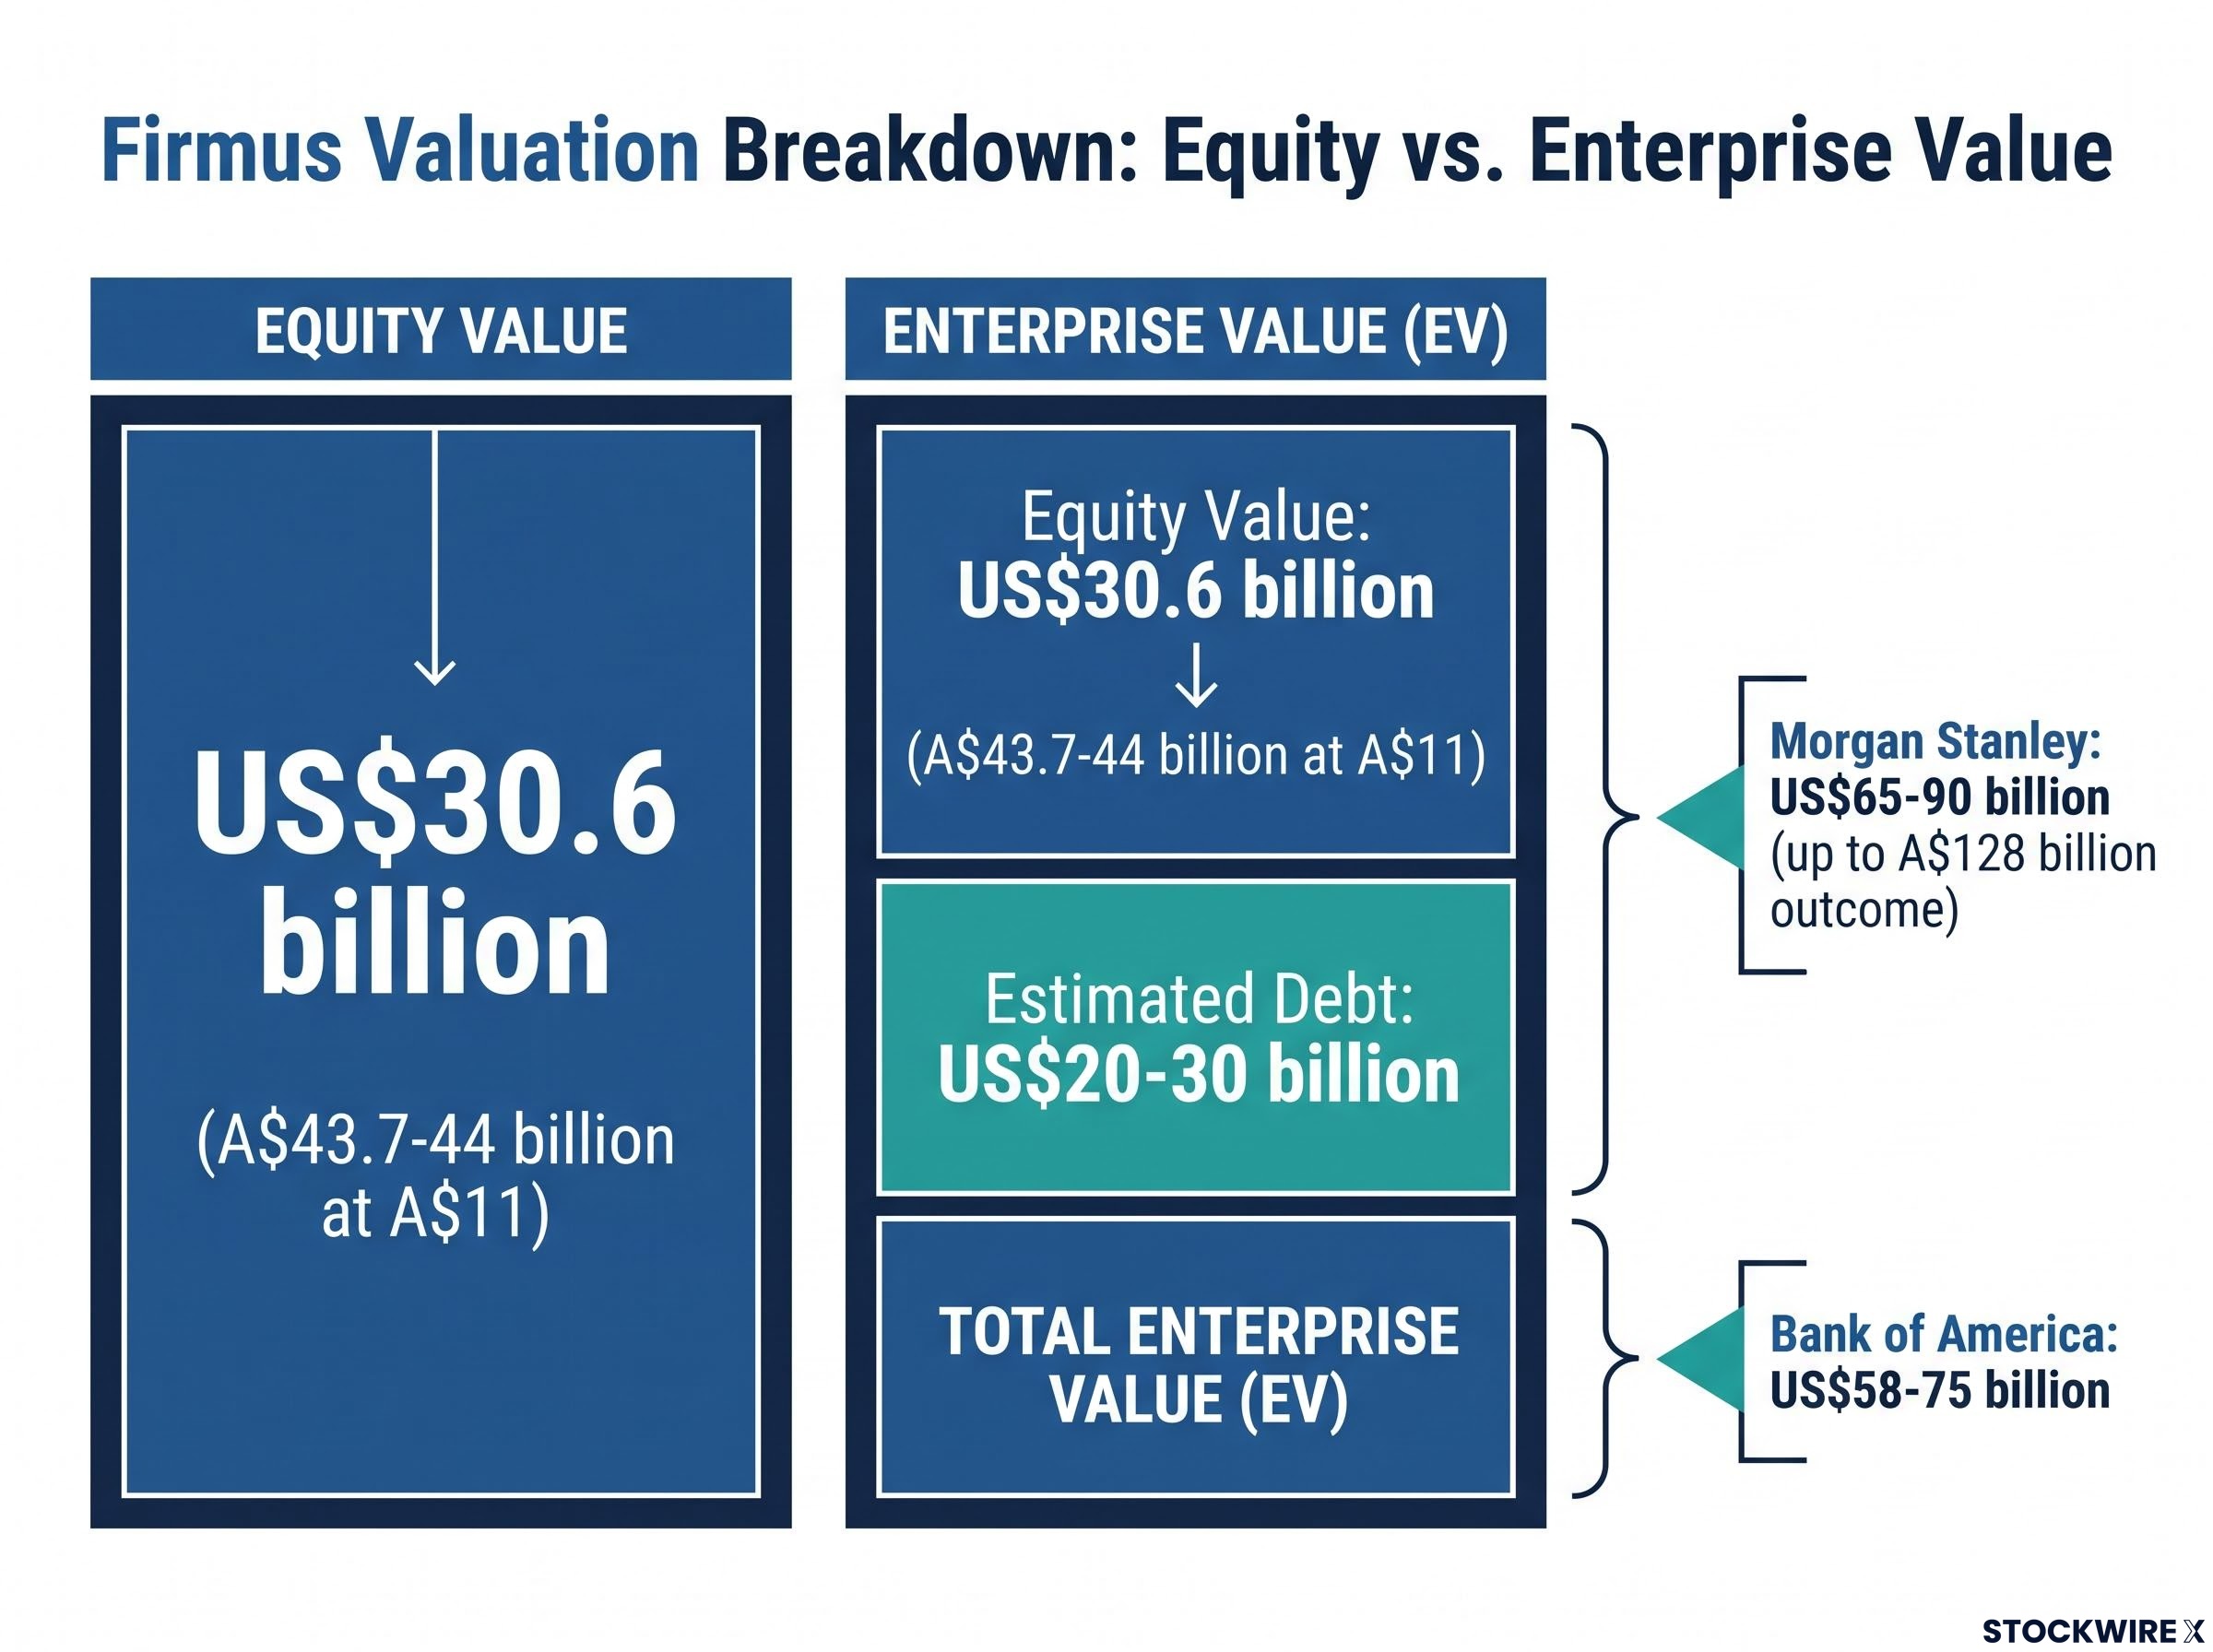
The A$128 billion figure is a Morgan Stanley EV-style outcome, not a market cap the float implies. Morgan Stanley’s range is US$65-90 billion, while Bank of America’s runs from US$58-75 billion depending on the report.
| Measure | Source | Figure | Includes debt? |
|---|---|---|---|
| Equity value at A$11 | Offer terms | US$30.6bn (about A$44bn) | No |
| Enterprise value | Morgan Stanley | US$65-90bn | Yes |
| Enterprise value | Bank of America | US$58-75bn | Yes |
Sources conflict on debt (US$20-30 billion) and on the Bank of America range, so treat each figure as an estimate. The offer itself raises about A$7.1 billion, up to about A$7.9 billion (US$5.5 billion) with the over-allotment, and roughly half of proceeds go to existing investors.
The range is not just brokers disagreeing. Five swing assumptions move the answer:
- Dependence on forward earnings before interest and tax (EBIT)
- The size of the discount to peers
- Utilisation and pricing of the chips
- How long the chips remain useful
- How much debt sits in the structure
The speed matters too. Bloomberg’s trajectory runs from about US$5.5 billion in April to about US$10.5 billion in August, then US$30.6 billion at the IPO.
When you see a headline valuation for this float, check first whether it is equity or enterprise value. The difference could be US$20-30 billion of debt ranking ahead of you as a shareholder.
When big ASX news breaks, our subscribers know first
How do brokers turn a business with no history into a valuation?
They borrow from the future, and the arithmetic shows how fragile that is. Firmus rents Nvidia chips to firms such as Meta, runs data centres in Singapore and Melbourne, and plans a Batam, Indonesia site to run 170,000 chips.
What is a forward EBIT multiple?
EBIT is earnings before interest and tax, a measure of operating profit. A multiple is the number you multiply it by to reach a value: US$1 billion of EBIT at 10x implies US$10 billion.
A business that has barely started has no meaningful trailing earnings, so brokers use a future year instead. The Australian Financial Review (AFR) captured the problem, saying fund managers are:
Brokers lean on forward multiples because a business with no history cannot be run through trailing metrics, but you can test any single answer against other share valuation methods such as DCF and EV/EBITDA before trusting it.
“grappling with an unusual problem: how to value a company that could see monster earnings, but has almost no financial past.”
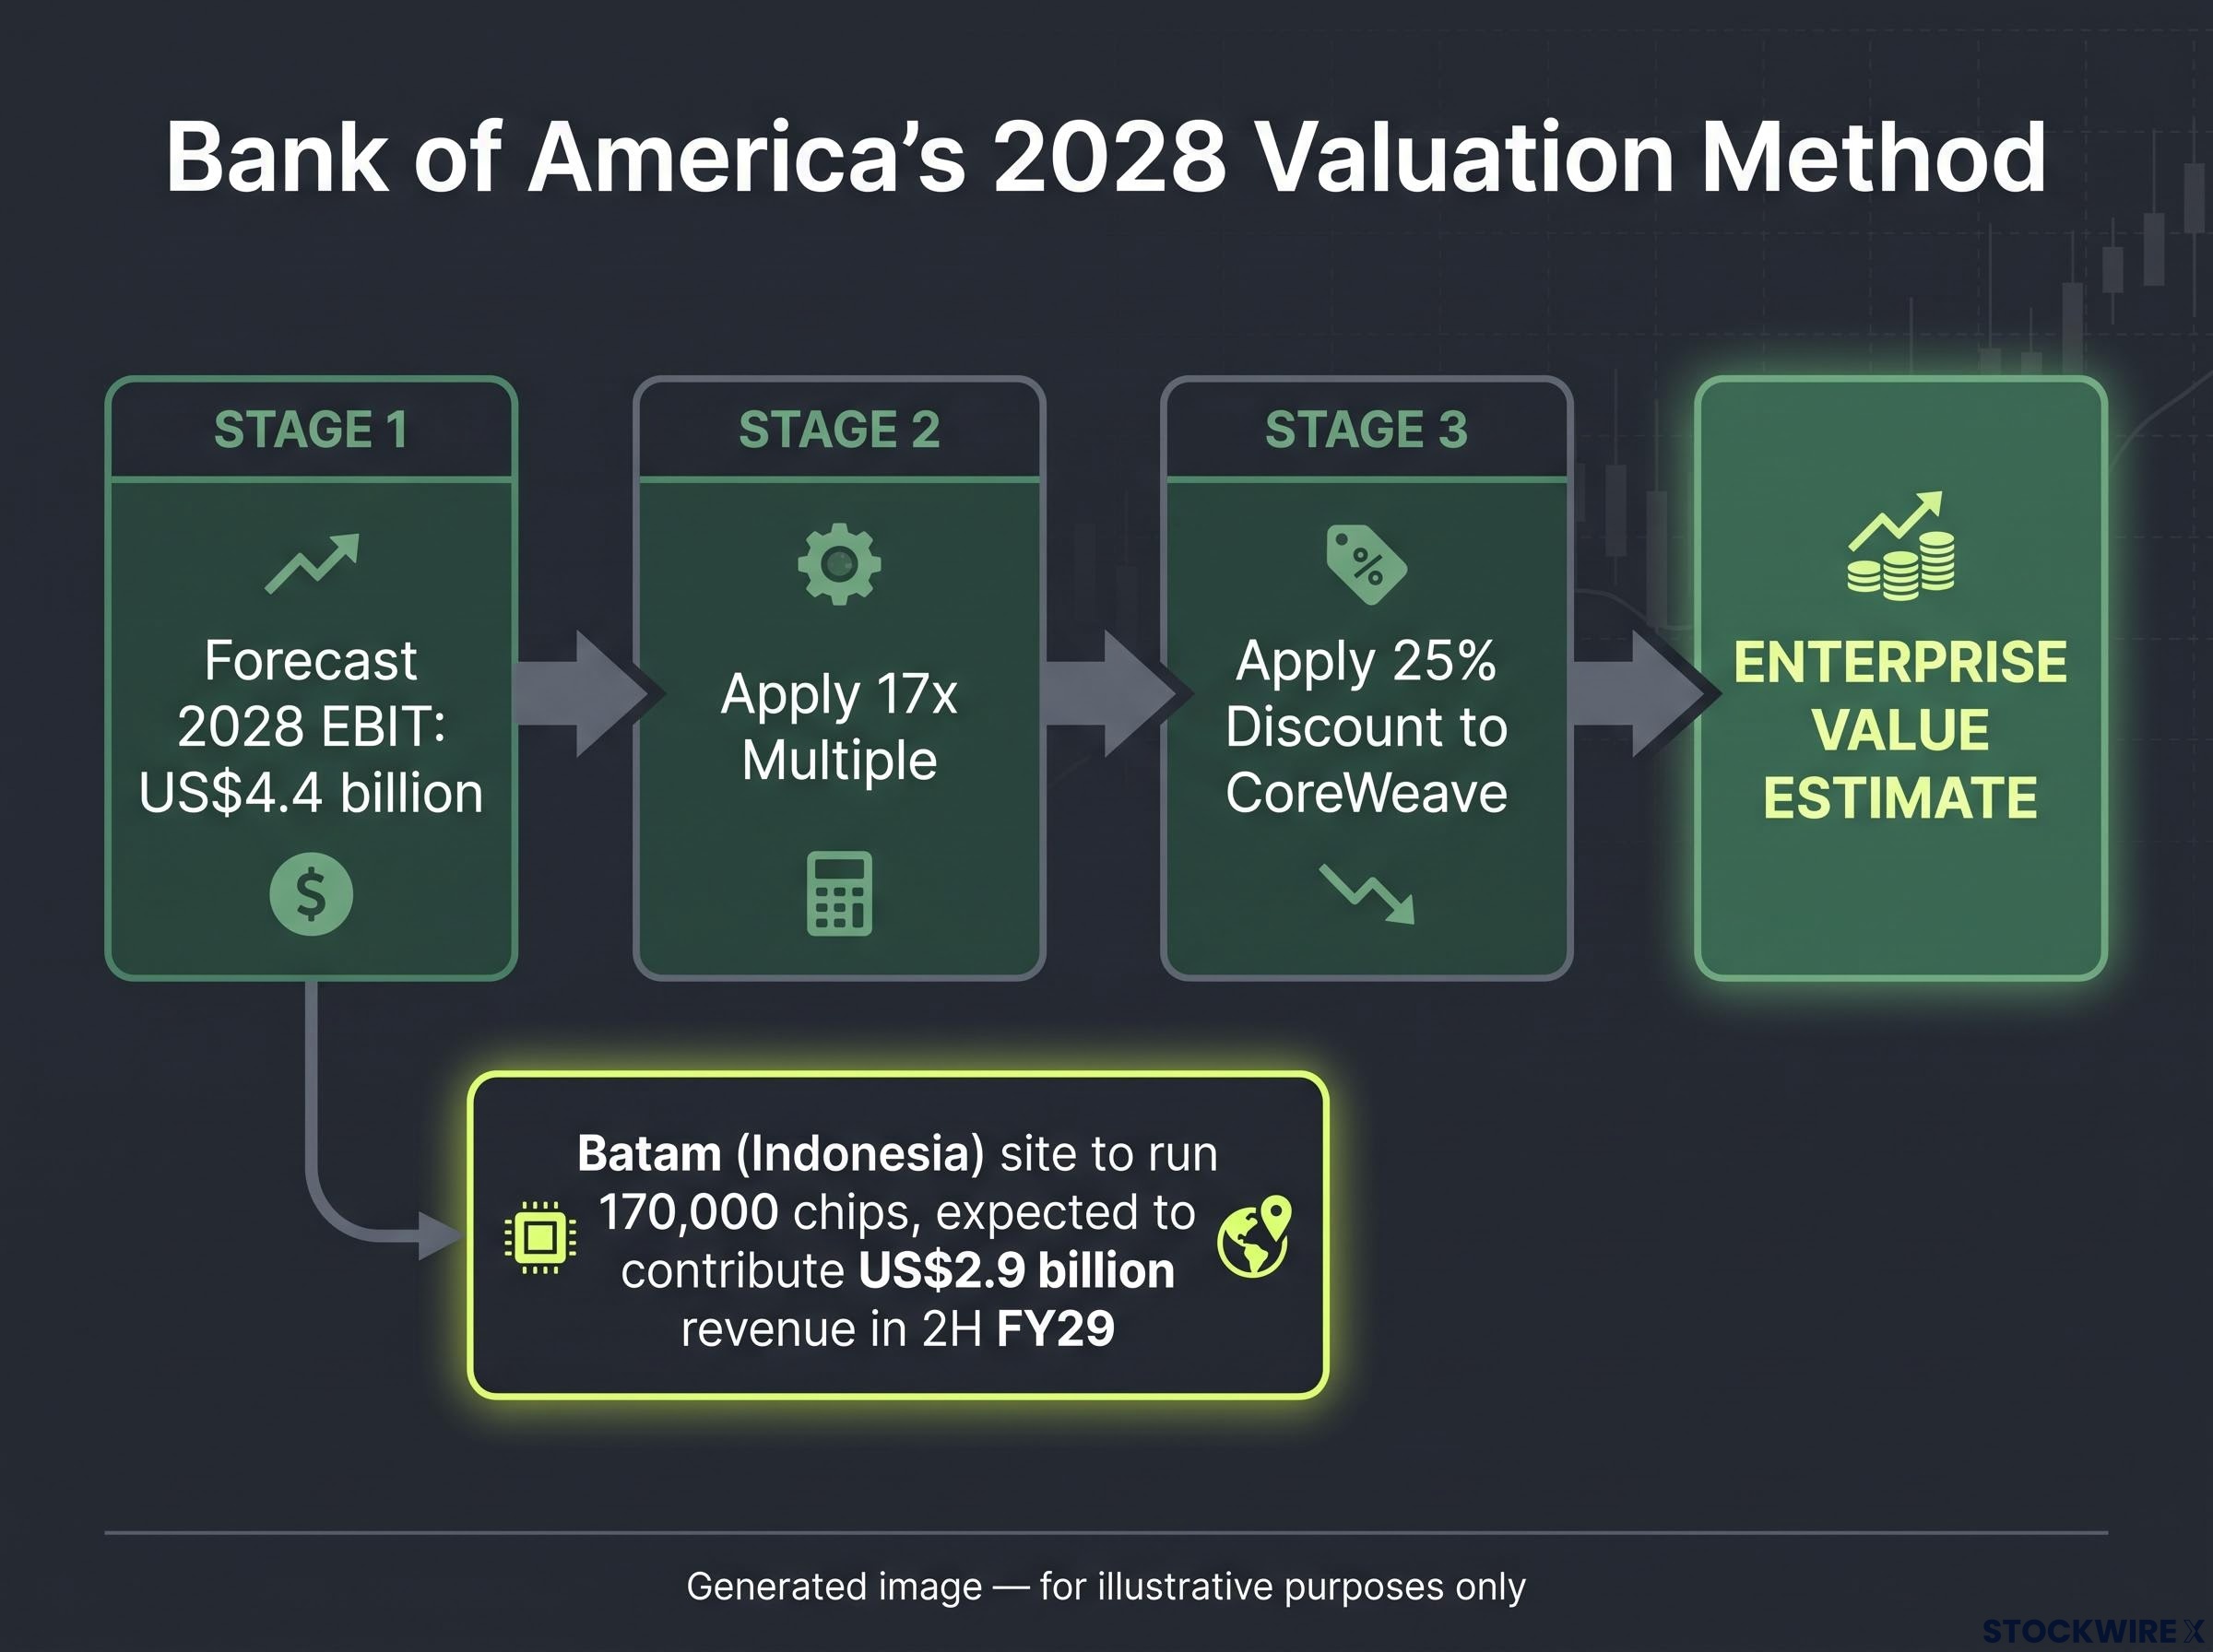
Bank of America’s case builds up like this:
- Forecast 2028 EBIT of US$4.4 billion.
- Apply a 17x multiple.
- Set that multiple at a 25% discount to CoreWeave, reflecting Firmus’s earlier scaling stage.
- Lean on Batam, which Bank of America expects to contribute US$2.9 billion of revenue in 2H FY29.
Morgan Stanley’s EBIT year and multiple were not disclosed.
Why CoreWeave is both the anchor and the problem
CoreWeave, the closest listed peer, shows how unstable a benchmark can be. Multiples.vc shows EV/Revenue of about 8.7x and EV/EBITDA of about 14.8x, while Investing.com puts trailing EV/EBITDA at 27.2x against 11.3x forward.
Kerrisdale Capital’s short report shows EV/EBIT falling from 210.9x to 92.4x, 33.2x, 23.2x and 19.2x across successive forecast years. It argues that at 8x 2028E EBIT, CoreWeave would be worth about US$13 a share.
A 25% discount versus a smaller or larger one materially shifts enterprise value. A valuation built on 2028 earnings is a bet on execution two years out, so treat the multiple and the discount as opinions, not facts.
What happens if the chips age faster than the debt is repaid?
Six years looks comfortable. That is the period over which Firmus depreciates its chips, spreading their cost across the years they are expected to earn money.
Nvidia, however, launches new chips yearly. Michael Frazis of Frazis Capital warned:
Yearly Nvidia launches could devalue the chips before the debt is repaid.
That matters because Firmus plans to fund up to 90% of equipment, including chips, with asset-backed borrowing. Debt of about US$30 billion against US$30.6 billion of equity amplifies any shortfall in utilisation or pricing.
Firmus is not alone in leaning on borrowed money, because AI capital spending across the largest hyperscalers is approaching 90% of operating cash flow, which makes debt-funded infrastructure a sector-wide feature rather than a Firmus quirk.
If chip values fall faster than the schedule assumes, reported EBIT is overstated and the multiple you pay is applied to flattering earnings.
| Factor | Bull case | Bear case |
|---|---|---|
| Utilisation | High, scarce platform | Falls short of forecasts |
| Pricing | Pricing power holds | Rental rates compress |
| Leverage | Serviceable from earnings | Amplifies downside |
| Track record | Local AI champion | Almost no financial history |
Concentration and execution add risk: reliance on Meta, plus power, permitting and regulation across Singapore, Melbourne and Batam. Morningstar has flagged bubble risk, and BofA’s Savita Subramanian has said AI capex positioning is crowded. A record 60% of S&P 500 stocks carry Buy ratings, so expectations are high.
Several facts are still undisclosed:
- Lenders, tenor, coupon and covenants
- The capex budget
- The full customer roster beyond Meta
How can you assess a pre-revenue AI infrastructure IPO yourself?
Use the prospectus, due 12 October, as your checklist. Joint lead managers are Morgan Stanley, Bank of America, JPMorgan and Morgans Financial.
What to read first in the prospectus
Start with the debt schedule, covenants and asset-life disclosures. Then check contracted versus uncontracted capacity and customer concentration.
Work through these in order:
- Equity versus EV: confirm which figure any valuation uses, and the debt gap between them.
- Debt and covenants: look for lenders, tenor, coupon and triggers.
- Depreciation versus chip cycle: look for the six-year policy and any impairment discussion.
- Contract quality: look for contracted capacity and Meta’s share of revenue.
- Peer discount logic: look for why a 25% discount to CoreWeave, not more or less.
- Founder selling: Oliver Curtis holds 13% and the founders plan significant sales after listing.
- Cornerstone holders: Nvidia (7.2%), Coatue, Blackstone and Jane Street are named; allocation sizes are not public.
Rapid index inclusion is expected given the size, though that is unverified. Allocation is institutional-led, so retail investors will usually buy on the secondary market after listing.
Because the biggest unknowns are answered only in the prospectus, you can reasonably wait for it and for early trading before forming a view. The bookbuild headlines are not the decision point.
What the Firmus debate changes, and what it leaves open
The valuation range reflects assumptions, not certainty. The structure, leverage plus fast-ageing assets, matters as much as the headline multiple.
The same problem of pricing earnings that have not yet arrived is playing out at far larger scale in AI IPO valuation debates around Anthropic and OpenAI, where private rounds near US$1.8 trillion combined carry no public financial disclosures.
Three things are worth watching: prospectus disclosures on debt and customers, first-day trading against the A$11 offer price, and the pace of founder selling.
The bull case rests on a scarce platform and a local AI champion. The bear case rests on no track record and bubble risk. Both can be argued from the same numbers, which is why the decision belongs to you, after the prospectus.
This article is for informational purposes only and should not be considered financial advice. Investors should conduct their own research and consult with financial professionals before making investment decisions. Valuations and forecasts are speculative and subject to change based on market developments and company performance.