AI capital expenditure is still climbing in headline dollar terms, and by a lot. Yet the number that actually drives economic momentum, the rate of change in that spending rather than its level, may already be shrinking. Bloomberg Economics has flagged exactly that gap.
This matters now for a specific reason. As of late September 2026, the Federal Open Market Committee holds a reportedly unanimous bullish view of the economy, and the indicators it leans on hardest, unemployment and core inflation, are flashing no warning at all. If a danger exists, it is invisible in the data the Fed is watching.
Here is the analytical lens that lets you read U.S. GDP momentum ahead of the headline releases, and here is what that lens currently shows about the AI investment economic impact heading into 2027. The signal is not in the level of spending. It is in the second derivative.
How AI became the engine, and potentially the entire engine, of U.S. growth
Start with a finding that reframes everything else. Anna Wong, chief economist at Bloomberg Economics, has calculated that in certain recent quarters AI accounted for more than 100% of U.S. nominal GDP growth. Every other sector, taken together, was a net drag.
Bloomberg Economics finding In certain recent quarters, AI investment contributed more than 100% of U.S. nominal GDP growth, meaning all other sectors combined subtracted from the total.
That is not how GDP is supposed to behave. The aggregate is meant to be diversified, a blend of consumption, investment, government, and trade. In those quarters, on a nominal basis, it was closer to a single concentrated bet.
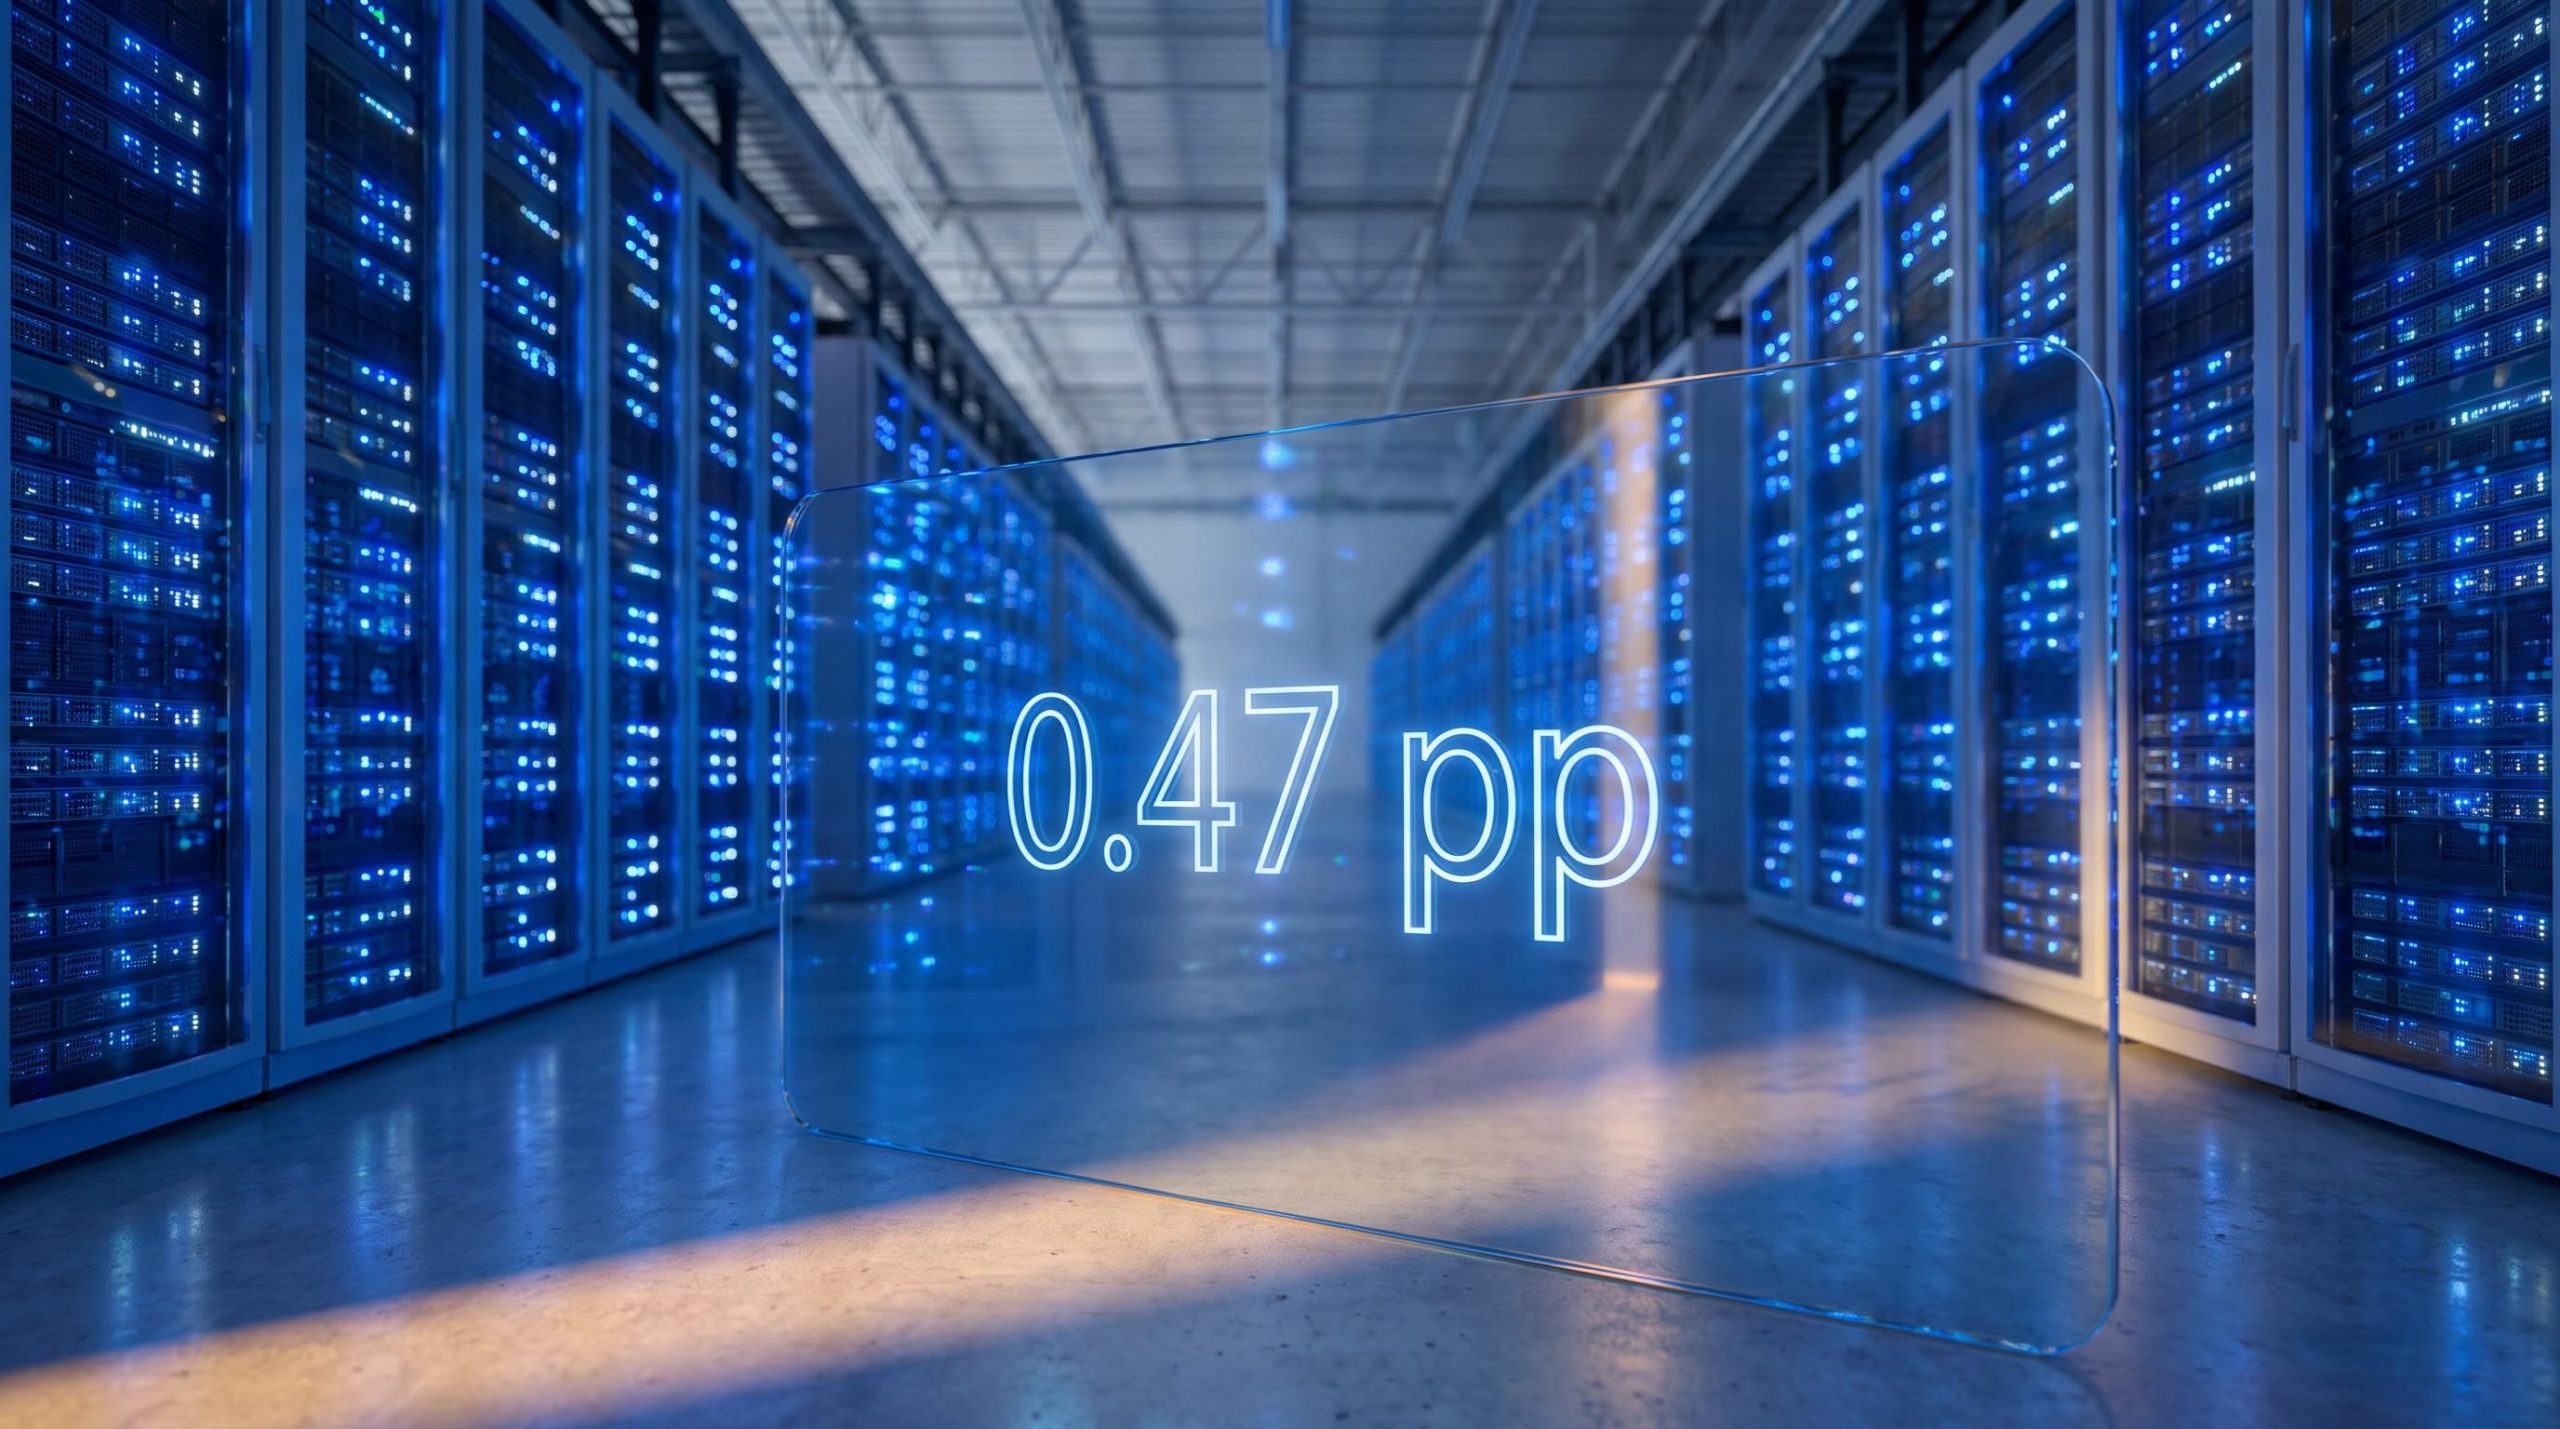
The picture softens considerably once you strip out inflation. JPMorgan Asset Management attributes roughly 0.47 percentage points of the recent 2.1% real GDP growth pace to a proxy for AI-related investment. That is about one-fifth of the total, with consumption contributing more than three times as much over the same window.
Nominal versus real: why both figures matter and what each one shows
These two numbers are not in conflict. They measure different things over different periods. Wong’s figure is nominal and covers specific quarters where AI was the sole positive contributor. JPMorgan’s figure is real, inflation-adjusted, and averaged across a broader stretch.
The real figure is also lower for a concrete reason: JPMorgan nets out imported hardware, which materially cuts the estimate of how much of this investment is genuinely domestic. That is a real measurement challenge worth holding alongside the headline. Neither figure is wrong; together they triangulate the same phenomenon from two angles.
The gap between the outsized nominal contribution and the more modest real one is the point. Growth is more concentrated, and more fragile, than the headline number communicates. That concentration is itself the risk.
How embedded has this become? Goldman Sachs projects U.S. AI-related investment at roughly $581 billion in 2026, equal to 1.8% of GDP, climbing from there.
AI investment as a share of GDP has now surpassed every prior technology cycle peak, with U.S. IT hardware and software spending reaching 4.9% of GDP in Q1 2026, well above the dot-com era high of approximately 4.2%, a threshold that reframes what it means for growth to become concentrated in a single investment theme.
| Year | U.S. AI investment | Share of U.S. GDP |
|---|---|---|
| 2026 | ~$581 billion | 1.8% |
| 2027 | Rising | 2.5% |
| 2028 | Rising | 2.8% |
One caveat frames all of this: the Bureau of Economic Analysis (BEA) does not publish a discrete AI investment category. Every figure here is an analyst-constructed proxy, not an official line item.
The BEA digital economy measurement framework acknowledges that traditional national accounts struggle to isolate the contribution of rapidly scaling technology investment, which is precisely why every AI investment figure cited here is an analyst-constructed proxy rather than an official line item.
When big ASX news breaks, our subscribers know first
The second derivative is what the Fed is not watching
Kevin Warsh, cited in the Bloomberg analysis, draws attention to a distinction that reorients the whole picture. What drives economic momentum is not the level of AI investment. It is the change in the rate of that investment’s growth.
Put plainly: spending can still be rising in absolute dollars while its growth rate falls, and when that growth rate decelerates sharply, the growth impulse to the economy weakens even as the cheques keep getting bigger. That is the second derivative. It is where momentum lives.
Here is the specific bearish signal. Bloomberg Economics found that on a real, inflation-adjusted basis, AI investment growth was already contracting or decelerating sharply in the second quarter of the most recently referenced year. That is a leading indicator, and it sits in direct contrast to still-solid headline GDP and unemployment figures.
The logic runs in three steps:
- AI was the dominant, and in nominal terms sometimes the sole, positive contributor to U.S. GDP growth.
- Real AI investment growth is already decelerating, visible in Q2 data.
- The lagging indicators the Fed watches will not capture this until quarters later.
That third step is the analytical blind spot. FOMC officials are reportedly focused on unemployment and core inflation. Both are lagging indicators. They will not reflect an investment deceleration until well after it has occurred.
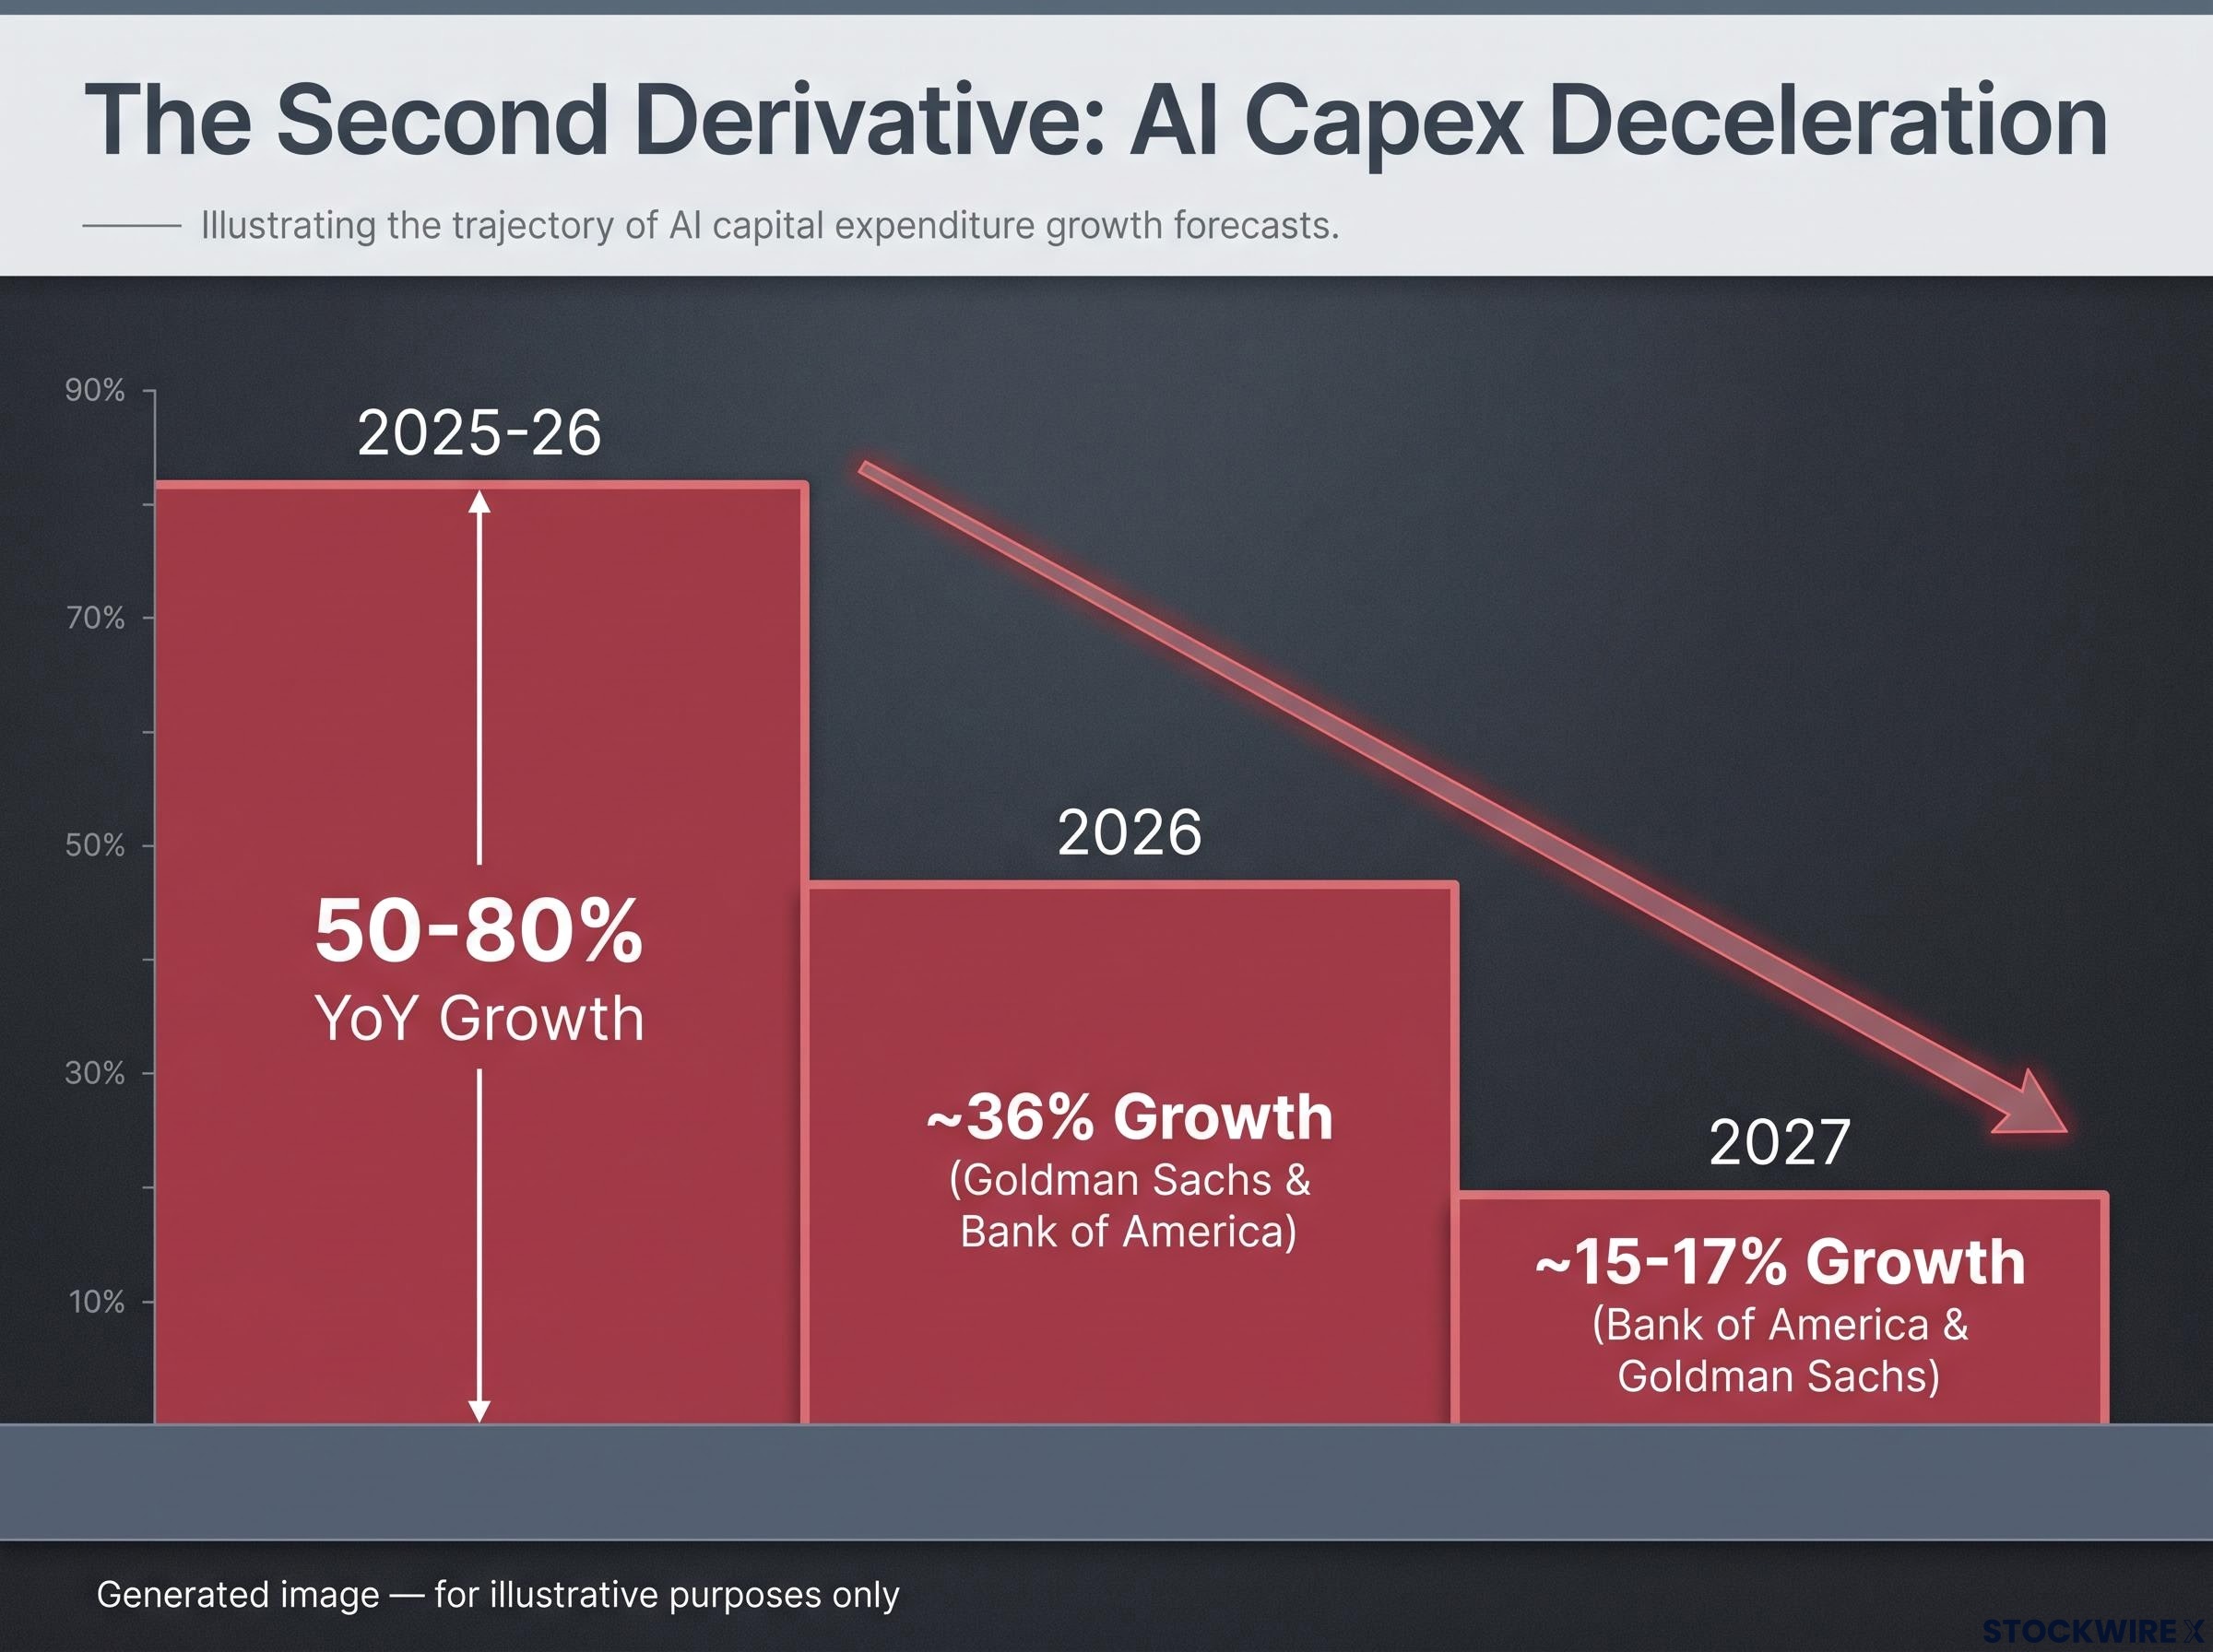
The forward numbers make the deceleration concrete. AI capex growth has run at roughly 50-80% year-over-year through 2025-26. Forecasts from Goldman Sachs, Bank of America, and RBC Wealth Management converge on a fall to the mid-teens by 2027.
What deceleration looks like in the data Growth compression from roughly 50-80% year-over-year in 2025-26 to mid-teens by 2027. Absolute spending stays very high; the growth impulse that feeds GDP thins out.
There is also a structural gap worth naming. Capex is growing at 50-80% a year while its contribution to real GDP registers at just 0.47 percentage points. That mismatch reflects how far official data lags forward-looking investment signals.
So the read you should take is this. When the primary driver of growth has shifted into deceleration, strong headline GDP stops being a reliable guide to near-term momentum. The damage shows up in official statistics only after the fact, which means by the time the Fed’s instruments register it, it will already be behind you.
Five channels through which an AI capex contraction reaches the broader economy
Most people file AI investment under “tech sector.” That framing is now too narrow to be useful. The transmission channels show that a capex slowdown would land simultaneously on construction, energy, semiconductors, employment, and corporate confidence.
Consider the multiplier that makes this concrete. Piper Sandler economist Nancy Lazar estimates that roughly $18 billion in data-center construction spending has already generated approximately $175 billion in incremental spending, equal to about 0.6% of GDP, through knock-on effects to contractors, equipment vendors, energy suppliers, and services.
That is a nearly tenfold multiplier on the direct figure. It is the clearest sign that the exposure is diffuse rather than concentrated.
The five channels break down as follows:
- Construction and Real Estate: Lazar’s multiplier analysis shows $18 billion in data-center construction generating roughly 0.6% of GDP, meaning a reversal hits construction employment and regional property markets far harder than the headline capex figure implies.
- Semiconductors, Hardware, and Equipment: Morgan Stanley projects the four largest hyperscalers will spend approximately $630 billion on AI data centres and chips in 2026, more than four times 2023 levels, so a demand pullback would compress revenue across chip, server, and networking supply chains.
- Power, Utilities, and Infrastructure: Utilities and grid operators have expanded capacity in anticipation of sustained data-centre demand, leaving those planned investments exposed if the buildout slows.
- Broader Investment and Confidence: Reuters Breakingviews warns that Big Tech AI spending may fall short of expectations, with spending surging faster than revenue, a mismatch that could force management teams to curb capex and dampen corporate confidence more widely.
- Employment and Regional Labour Markets: The multi-hundred-billion-dollar scale of infrastructure spending implies macro-relevant hiring in construction, engineering, and local services, concentrated in regions that have become AI-infrastructure hubs.
The capex-to-cash-flow ratio at the largest hyperscalers has reached a structural extreme: PIMCO estimates capital expenditure now absorbs 93-94% of operating cash flow, up from 33-40% in 2022-2023, which is the balance-sheet context behind Reuters Breakingviews’ warning that spending is surging faster than revenue.
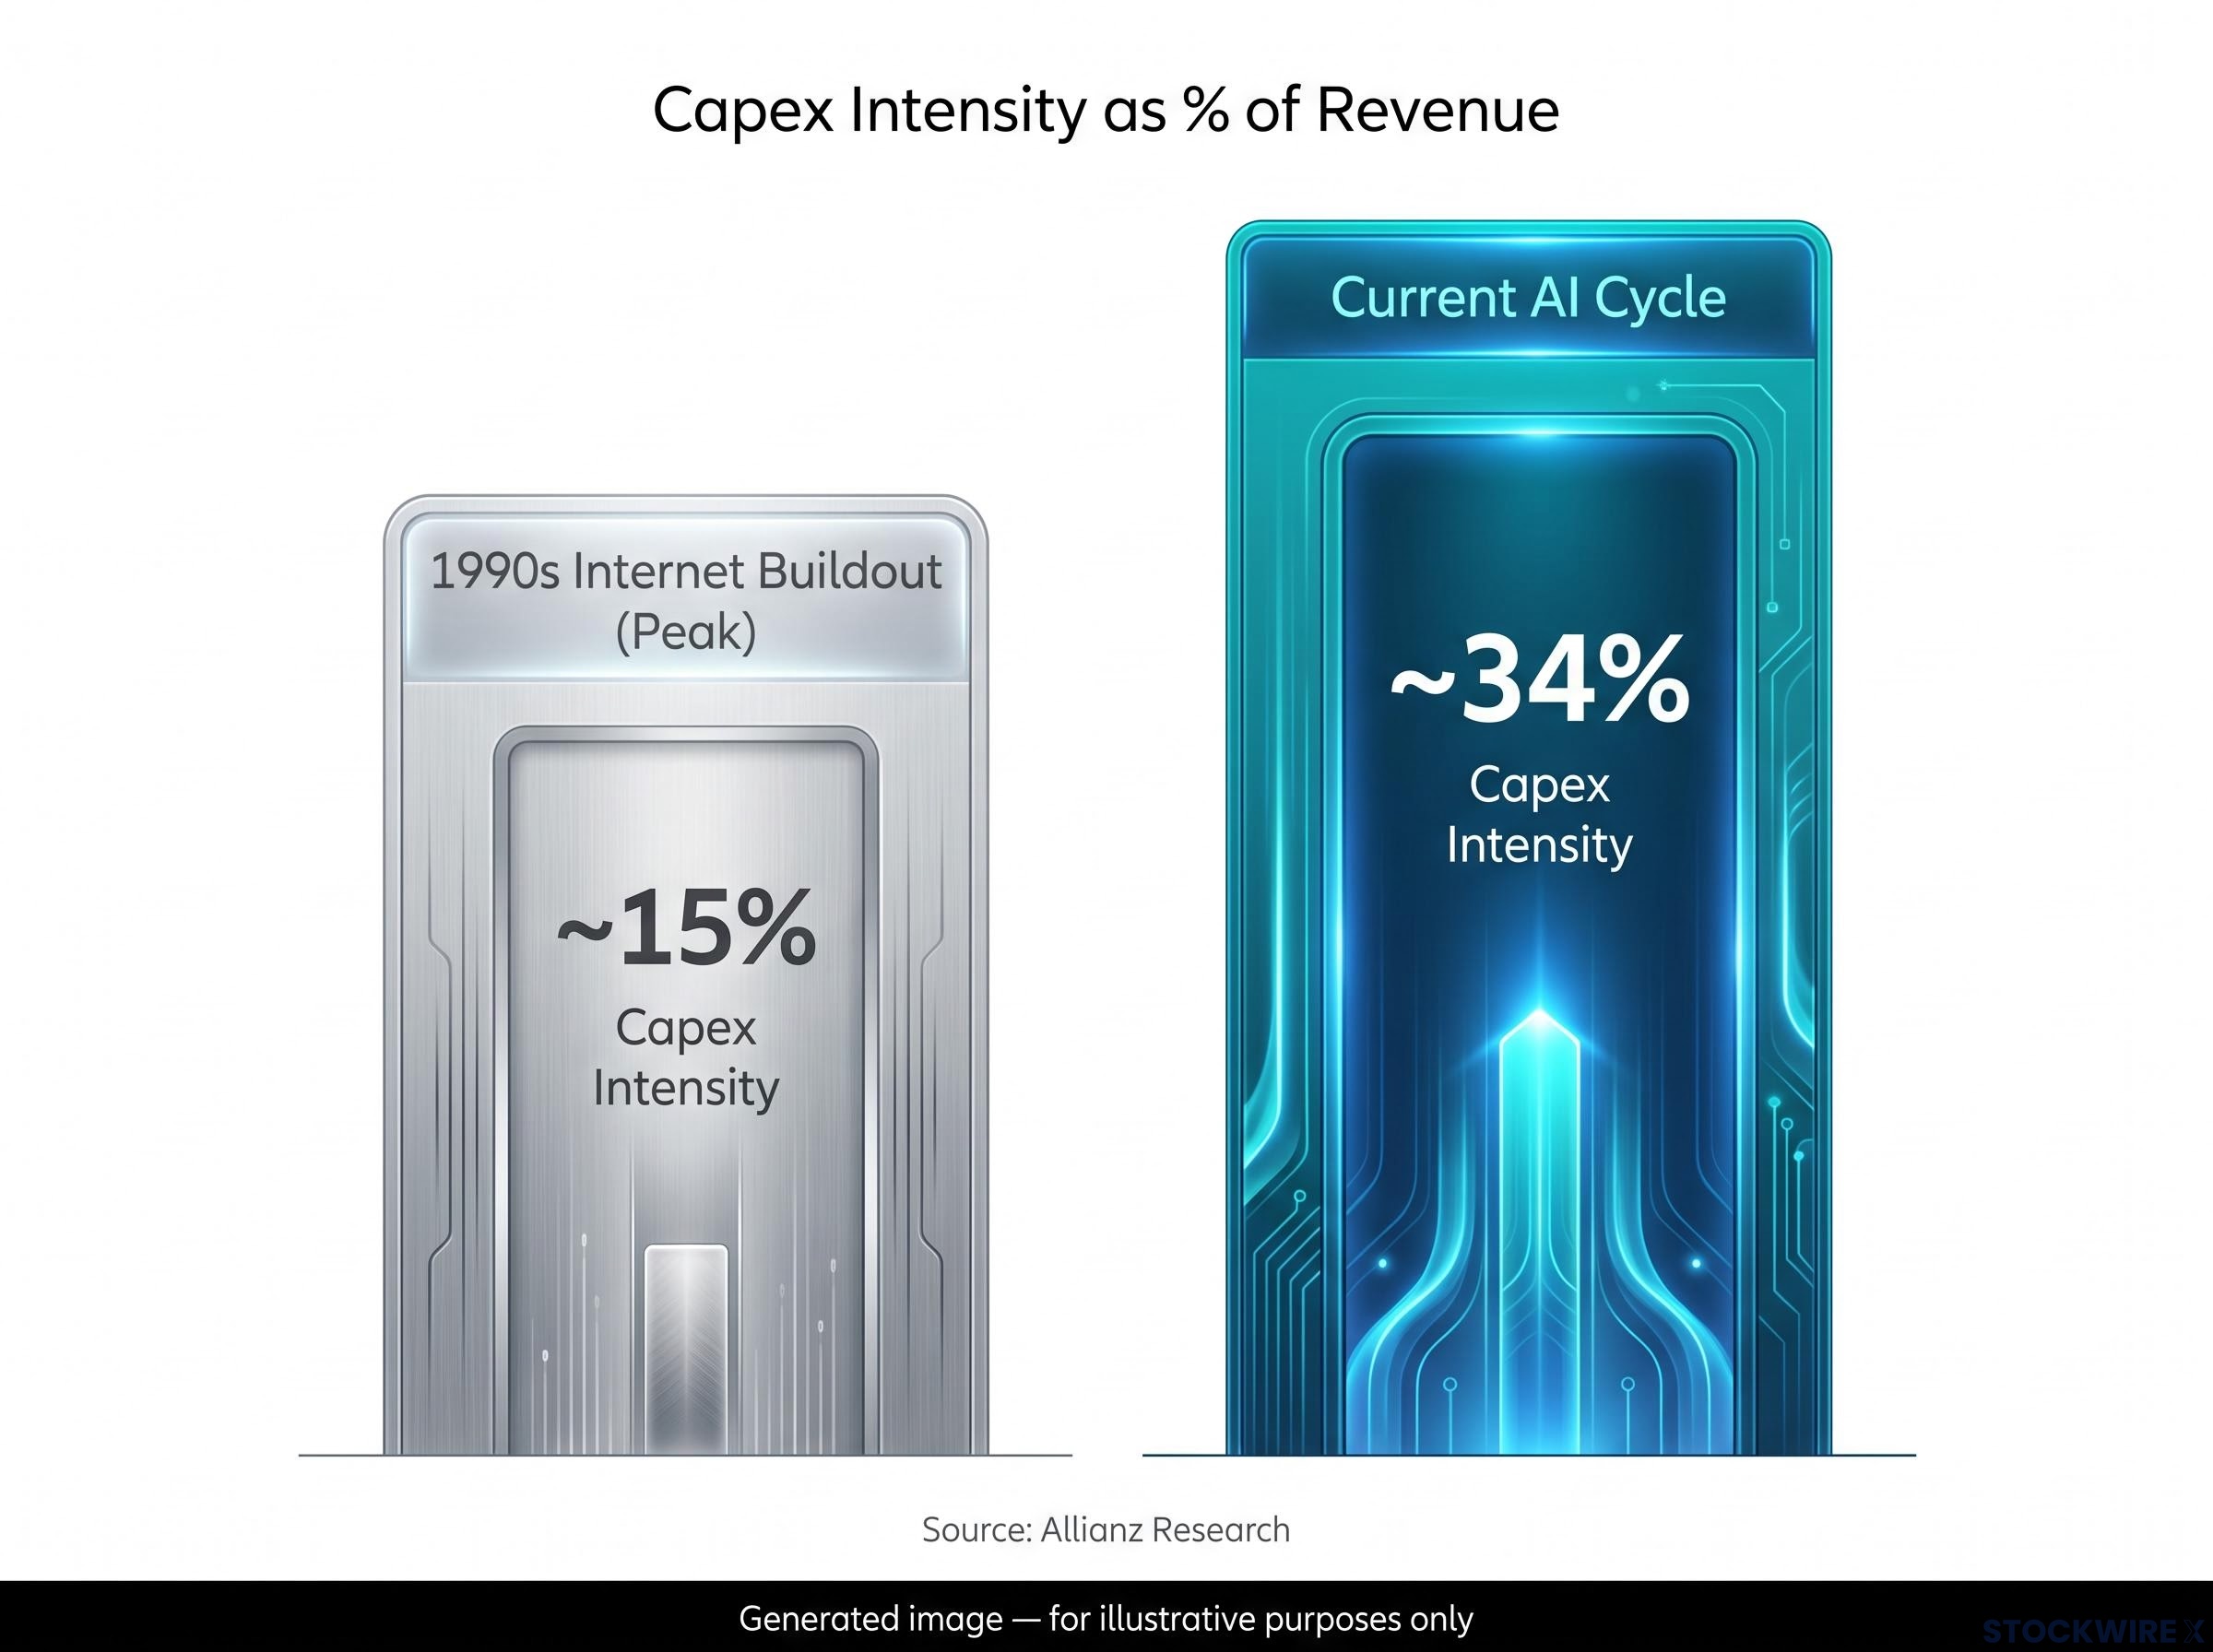
The intensity of this cycle is what sets it apart from prior tech booms. Allianz Research puts AI capex intensity at roughly 34% of revenue among the largest U.S. tech spenders, against a peak near 15% during the 1990s internet buildout.
| Cycle | Capex intensity (% of revenue) | Implied risk differential |
|---|---|---|
| 1990s internet buildout (peak) | ~15% | Baseline |
| Current AI cycle | ~34% | More than double, implying a larger correction if returns disappoint |
Allianz Research also notes that the five largest U.S. tech spenders have committed more than $2.1 trillion in capex across 2026 to 2028. So what does the multiplier data tell you? A slowdown here is not a Silicon Valley story. It is a story about construction crews, regional labour markets, utility capital plans, and forward expectations built across sectors that assumed the demand would hold.
Structural transformation or late-cycle overshoot: where the real disagreement lies
Both sides of this debate deserve to be taken seriously, because both have genuine evidence behind them. The disagreement is real, and it is not yet settled by the data.
The two cases lay out like this:
The structural case:
- Goldman Sachs frames the buildout as a sustained multi-year commitment, with U.S. AI investment rising to 2.5% of GDP in 2027 and 2.8% in 2028.
- Allianz Research describes the cycle as “war-proof for now,” pointing to more than $2.1 trillion committed across 2026-2028 by the five largest U.S. tech spenders.
- The secular demand argument: businesses across nearly every industry are embedding AI into core operations, creating durable demand that differs in character from narrower past tech cycles.
The structural optimists’ strongest counterpoint rests on contracted backlog data: more than $2.3 trillion in legally signed, undelivered cloud and AI commitments sits across the four largest hyperscalers, shifting the core risk question from whether demand will materialise to whether infrastructure can be built fast enough.
The cyclical risk case:
- Growth is set to decelerate sharply even under optimistic scenarios. Goldman Sachs projects roughly 36% growth in 2026 slowing to about 17% in 2027; Bank of America projects roughly 36% in 2026 falling to about 15% in 2027.
- Spending is surging faster than revenue at the hyperscalers themselves, and Reuters Breakingviews warns that markets are starting to notice the mismatch.
- The Bloomberg Economics leading signal, real AI investment already decelerating in Q2, is more bearish than the headline capex guidance suggests.
The most viscerally compelling piece of the skeptics’ case is historical.
Allianz Research capex intensity comparison AI capex intensity now sits at roughly 34% of revenue, against a peak near 15% during the 1990s internet buildout, more than double the intensity of a cycle that still ended in a boom-bust.
This debate does not resolve by picking a camp. It resolves through specific empirical variables: hyperscaler revenue growth relative to capex, the trajectory of real AI investment in the coming quarters, and how responsive the Fed proves to any investment deceleration.
Here is where that leaves you. The structural optimists may well be right over a decade. But the second-derivative signal and the revenue-versus-capex mismatch shift the burden of proof onto them, not onto the skeptics. The optimistic case now has more to prove.
What to watch before the Fed figures it out
If the deceleration thesis is right, it will show up in forward-looking data long before the Fed’s lagging indicators register the downstream effects. That gives you a set of instruments to track the thesis in real time.
Watch these four, ordered from most to least timely:
- Hyperscaler Q3 2026 capex guidance revisions. The next major update across Amazon, Microsoft, Alphabet, and Meta is the single most timely datapoint. Any softening in guidance is the earliest hard confirmation.
- Real AI investment in subsequent BEA proxy updates. The Q2 deceleration flagged by Bloomberg Economics needs to be confirmed or reversed in later readings.
- Data-centre construction activity and permits. Given Lazar’s 0.6% GDP multiplier, permit activity is a leading tell on the construction channel.
- Semiconductor order books and chip supplier guidance. Order books turn before revenue does, making them a forward read on the hardware channel.
The Fed’s timeline is the reason this matters. If real AI investment deceleration was already visible in Q2 data, the FOMC’s conventional indicators will not reflect the downstream effects for at least another one to two quarters. That opens a window in which policy may stay mis-calibrated against a reportedly unanimous bullish stance.
This is not a criticism of individual policymakers. It is a structural feature of how official data is built. Understanding that feature is what tells you why markets may move on this thesis before policy does.
The asymmetry that makes this worth watching even if the bull case holds
Here is the argument for tracking these indicators even if you accept the structural narrative. The downside of a capex reversal is sharper and faster than the upside of continued investment growth. The risk is asymmetric.
The next real test arrives with Goldman Sachs’ projected slowdown, from roughly 36% growth in 2026 to about 17% in 2027. That first year of mid-teens growth is when the structural demand thesis meets slower-growth conditions for the first time.
Note too that equity markets are already pricing some version of deceleration into high-multiple AI-adjacent names. The market is not uniformly bullish on the structural case, even while the hyperscalers’ own guidance stays optimistic.
Reading the cycle with the right instrument
The central argument here is methodological, not a market call. Headline GDP, unemployment, and core inflation are the wrong tools for detecting an AI-driven investment deceleration in real time. The second derivative and the transmission-channel map are the right ones.
The genuine uncertainty remains. The structural-versus-cyclical debate will only be settled by data that does not yet exist, and reasonable analysts land on different sides of it. Bloomberg Economics’ nominal contribution finding, JPMorgan’s 0.47 percentage point real figure, the deceleration from 50-80% to mid-teens growth, and Piper Sandler’s 0.6% GDP multiplier all point to concentration and fragility that the headline numbers hide.
So for the next two to three quarters, read Fed communications, GDP releases, and sector data differently. Treat Q3 2026 hyperscaler earnings as the first real test of whether capex guidance holds or begins to soften.
For readers wanting the empirical evidence behind the deceleration-versus-durability debate, our full explainer on AI investment bubble evidence covers peer-reviewed econometric research that detected speculative dynamics in all seven Magnificent Seven stocks, alongside the revenue foundation that separates the current cycle from the dot-com era.
This article is for informational purposes only and should not be considered financial advice. Investors should conduct their own research and consult with financial professionals before making investment decisions. Past performance does not guarantee future results, and financial projections are subject to market conditions and various risk factors. These statements are speculative and subject to change based on market developments.