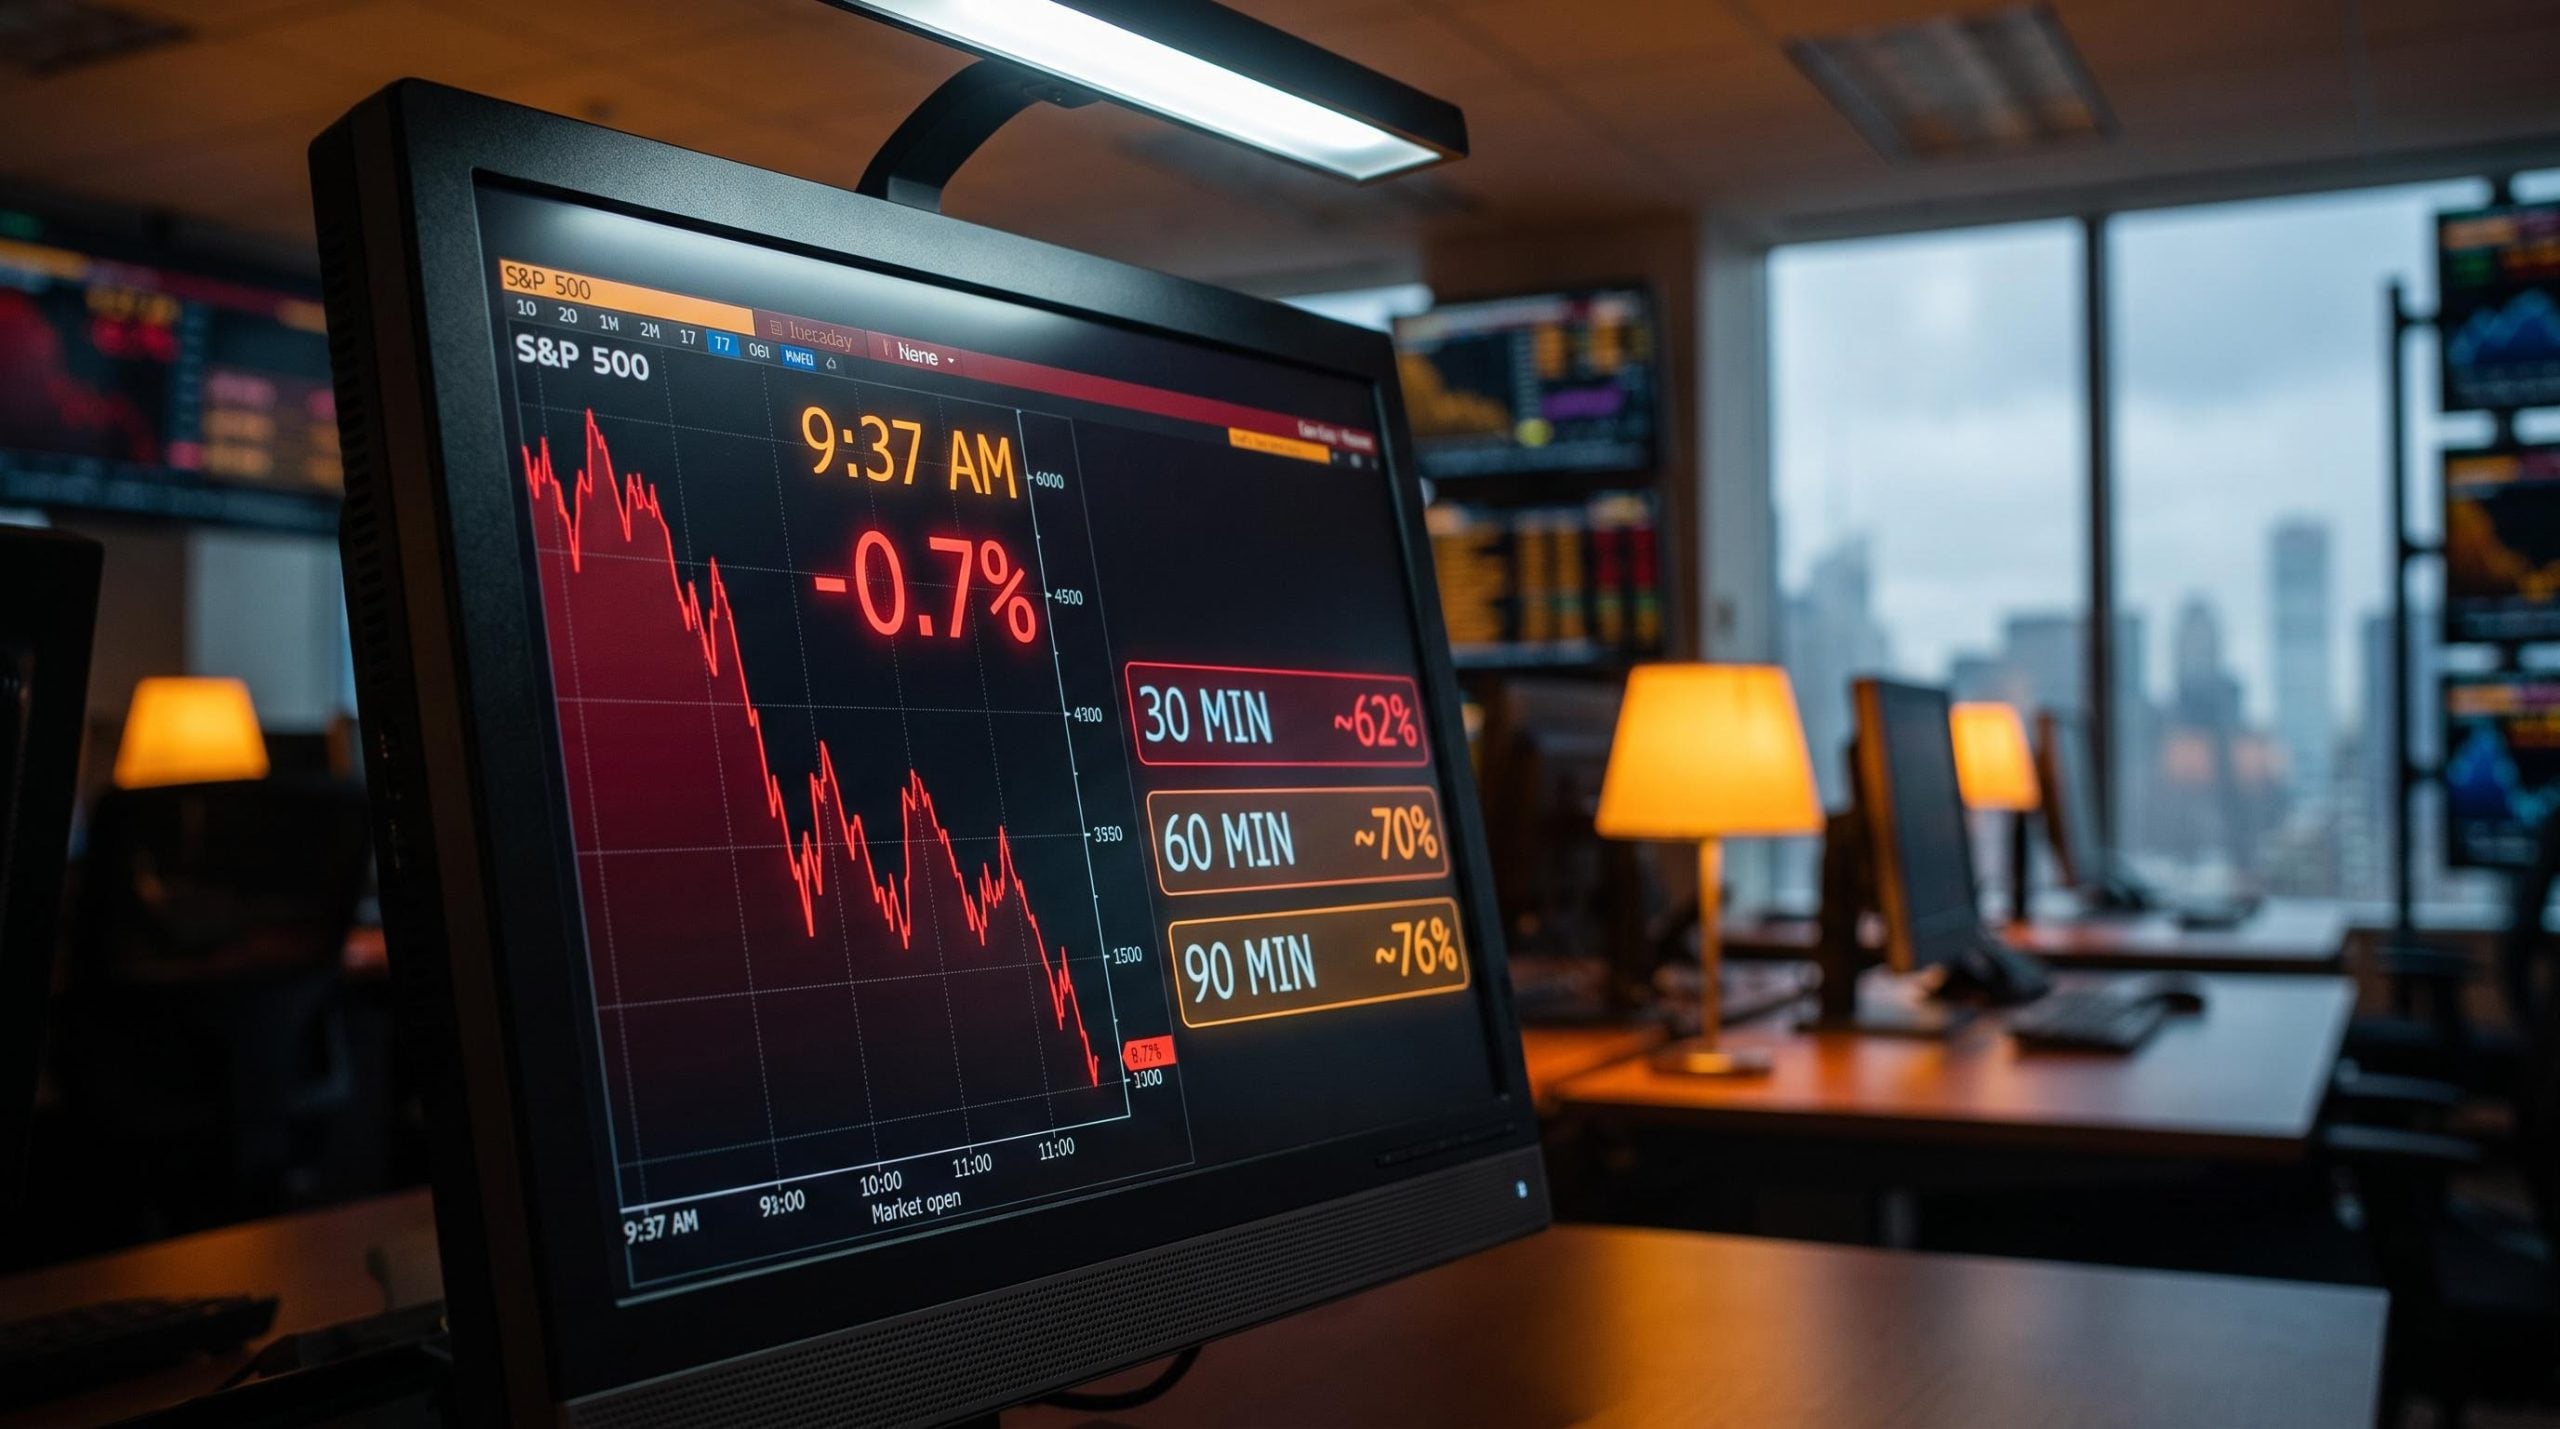
It is 9:37 in the morning, and the S&P 500 has just dropped 0.7% in the first twenty minutes of trading. You are watching the position you planned to open, and the question lands hard: do you act on what you are seeing right now, or do you wait?
Most active traders answer that question with their gut. They feel the move, they assume it will continue or reverse, and they commit. Very few are answering it with anything resembling data.
The opening 90 minutes of the US equity session is the most statistically rich period of the trading day, and also the least understood by the people trading through it. This piece gives you an empirical foundation for a decision you are already making every morning. You will come away with a time-layered way to judge whether an early move is likely to hold or fade, calibrated by exactly where you are in the 30-to-90-minute window, and by how much each checkpoint actually shifts the odds.
Why the opening period behaves like no other part of the trading day
Equity trading activity follows a consistent daily shape that market structure analysts describe as a U-shaped curve. Volatility and volume spike hard at the open, compress through the quiet midday hours, then spike again in the final 30 minutes as participants square up end-of-day positions.
The intraday momentum research in the Journal of Financial Markets confirms that U-shaped volatility and price impact patterns are structural features of equity sessions, driven by liquidity provision dynamics rather than random noise, which is why the opening period produces measurably different statistical outcomes than any other part of the day.
The first 30 minutes sits at the top of that curve. It carries the highest volume and the fastest price velocity of the regular session, according to Longbridge’s 2026 analysis of opening volatility.
Here is the part that matters for you: the shape of that curve is predictable, but the direction of price inside it is not. Longbridge frames this distinction deliberately. The opening will reliably be volatile; that volatility does not tell you where the session ends.
The three forces that load the open
So why is the open so distinct? Three reinforcing mechanisms queue up simultaneously every morning at 9:30 ET.
- Overnight order accumulation. During the roughly 17.5 hours the market is closed, orders pile up from global participants reacting to overnight events. At the bell, they resolve all at once.
- Pre-market news absorption. Earnings, economic data, and overnight geopolitical developments create directional order imbalances. Strong results generate buy pressure; negative surprises generate sell pressure.
- Concentrated institutional flow. Pension funds, mutual funds, and algorithmic systems often execute large portions of their daily activity at or just after the open, using that liquidity to move size without excessive market impact.
The overnight pile-up gets resolved through the opening auction, the opening cross that NYSE and NASDAQ both run in the minutes before 9:30. This auction matches accumulated buy and sell orders to set the opening price.
The tool that tracks this is the Net Order Imbalance Indicator (NOII), a measure of how lopsided buy versus sell orders are relative to the indicative auction price. Persistent buy or sell imbalances ahead of the auction push the opening price up or down, with the effect amplified when the imbalance is large relative to matched volume.
The price discovery mechanics behind the opening auction go deeper than the NOII indicator alone: passive limit orders sitting in the order book contribute approximately 45% to price discovery, more than completed trades, which helps explain why imbalance snapshots can shift so sharply before the final clearing price is set.
The institutional point is the one most traders miss. According to MEXC’s 2026 guidance, institutional participants who sat out the thin pre-market session re-enter at the open with a fuller information set, and they frequently reach different conclusions than the overnight move implied. Their two-sided flow reprices toward where informed capital actually wants to transact.
Order flow trading offers one framework for reading that institutional re-entry: rather than tracking price after the fact, it examines the live balance of aggressive buy and sell orders to infer where large participants are actually committed versus where they are simply testing liquidity.
The regular-session open, in MEXC’s framing, is “where the full market votes.” That distinguishes it from the pre-market, where a single order can move a price several percent without representing anything close to consensus.
Put those three forces together and the conclusion is clear. The opening period is not noisy by accident. It is structurally loaded with resolving information, which is precisely why it rewards understanding rather than avoidance.
When big ASX news breaks, our subscribers know first
What 15 years of data actually show about early moves
The mechanisms explain why the open behaves differently. The data tells you what that behaviour looks like in numbers. The figures below come from roughly 15 years of minute-level intraday data, measured at three checkpoints after the open, with a “large” early move defined as an absolute swing of 0.50% or more.
Start at the 30-minute mark. About 77% of large early upward moves were still higher after 30 minutes, while only about 62% of large downward moves were still lower. That gap is the asymmetry, and it traces back to the market’s long-term positive drift rather than to any edge you can trade in isolation.
The reversal numbers at this stage are the warning. Close to 48% of large downward moves that began in the first 30 minutes eventually crossed all the way back through the opening price. Average reversal timing landed around 11:21 a.m. ET for upside moves and about 11:12 a.m. ET for downside ones.
Move out to the 60-minute checkpoint and the picture shifts. Downside persistence climbs from 62% to roughly 72%, while upside persistence holds steady near 77%. A downward move that survives the first full hour is carrying meaningfully more conviction than it was 30 minutes earlier.
By 90 minutes, both directions reach their highest observed reliability. Around 79% of large upward moves held their direction, and about 76% of downward moves did too. Residual reversal probability fell to roughly 21% for upside and 24% for downside.
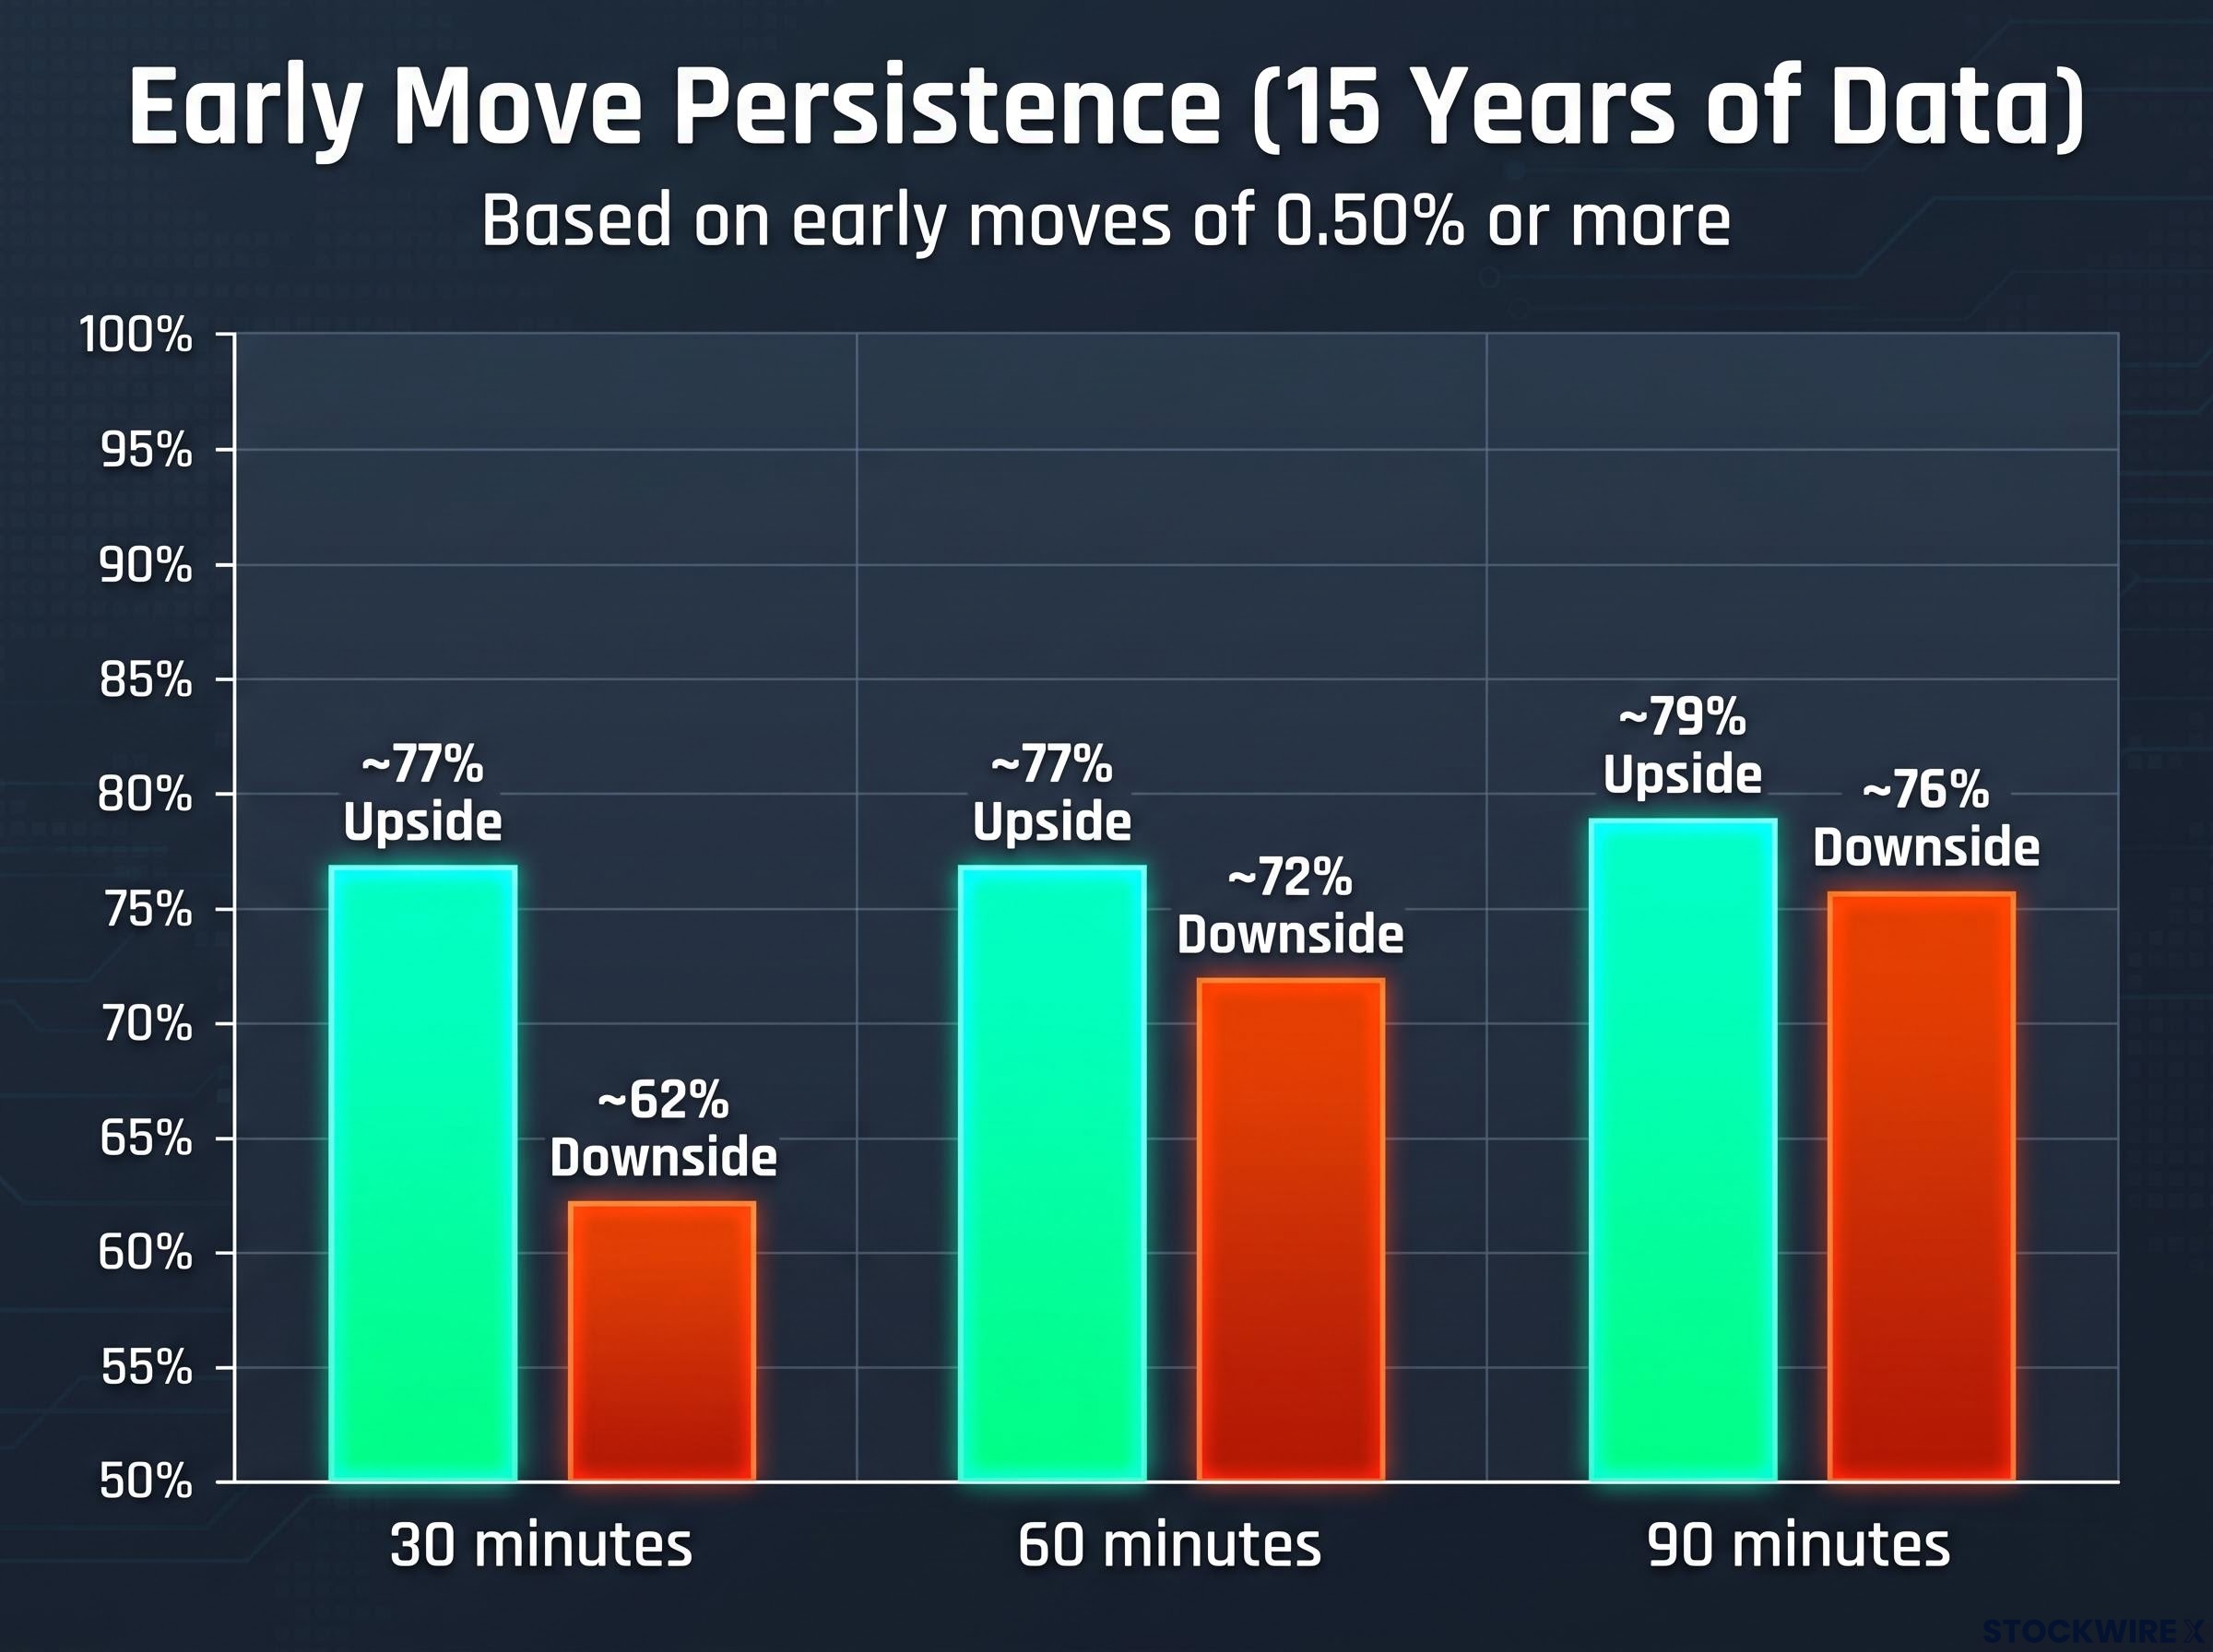
| Checkpoint | Upside persistence | Downside persistence | Downside full reversal rate |
|---|---|---|---|
| 30 minutes | ~77% | ~62% | ~48% |
| 60 minutes | ~77% | ~72% | Not reported |
| 90 minutes | ~79% | ~76% | ~25% |
The single most useful figure sits in that final column.
The share of large downward moves that fully reversed back through the opening price fell from roughly 48% at the 30-minute mark to about 25% once the move had held for 90 minutes. The reversal rate roughly halved.
That halving is what should change how you act. A downward move that has held for 90 minutes is not simply “still down.” It is carrying roughly twice the directional conviction of the same move at the 30-minute mark. Surviving each successive checkpoint is itself information, and the numbers let you weigh exactly how much.
When the signal is real and when it is not
Everything above describes statistical means across 15 years. No single morning is guaranteed to follow them, and knowing where the framework breaks down protects you from trusting it in the wrong conditions.
Data quality: pre-market noise and NOII instability
Two of the biggest traps sit in the data you look at before the open even settles.
Pre-market moves are the first. According to MEXC, extended-hours sessions run on a fraction of regular-session liquidity, and a single order can move a price several percent without representing consensus. The gap between where a stock trades at 8:00 a.m. and where it opens at 9:30 a.m. is exactly the window where most of that overnight noise gets resolved.
That transition is what separates traders acting on real information from those acting on a thin-market illusion. Overnight price changes on their own are not strong predictors of the full-day trend.
NOII imbalances are the second trap. Capital.com’s analysis is explicit that a large imbalance early in the auction does not mean it will persist to the final clearing price. Orders arrive, get modified, and get cancelled, so an early snapshot can shift materially before the auction settles. The imbalance is informative, but fragile.
Execution risks that the data does not price in
- Macro events and earnings. Around scheduled data releases and earnings, imbalances can swing sharply between the pre-market and the opening auction, and reversal-timing averages vary considerably in those conditions.
- Wide spreads. In the first 30 minutes, bid-ask spreads are wider and price swings larger than at any other time of day.
- Pre-market illusion. Extrapolating a thin overnight move into a regular-session trend can systematically mislead you.
- NOII drift. Acting on an early imbalance snapshot rather than its evolving picture carries specific risk.
The spread problem deserves its own warning because the persistence statistics do not account for it. If you chase an early move with a market order into a wide spread, your execution cost can quietly erode the very statistical edge you were trying to capture.
RSI divergence at structural levels is one of the few tools that has held up across extended live testing: a 2024 academic study of Nifty 50 equities found an 87.61% success rate when divergence occurred at confluence zones, making it a useful cross-check against a 90-minute persistence signal that is strong but not infallible.
The concrete discipline is simple. Use limit orders rather than market orders near the open. That one habit keeps slippage from eating the probabilistic advantage the data describes.
There is also a timing cue worth watching. Reversals for downside moves tend to lag upside reversals by about 10 minutes at the 30-minute checkpoint and roughly 25 minutes at the 90-minute checkpoint, with 90-minute move reversals clustering around early afternoon. That window is where you should be most alert to invalidation.
How to apply the 30-60-90 framework in practice
The data is only useful if you can run it live. The next time you are watching an early move, here is the sequence to walk through rather than a set of principles to translate on the fly.
- Pre-market orientation only. Treat overnight price action as context, never as a trading signal. Thin liquidity means it may reflect a handful of orders.
- The opening print. Use the opening auction and the first few minutes of regular trading as your first structured confirmation layer. This is where the full market votes.
- 30 minutes. Treat the signal as tentative, especially for downside moves where reversal risk still sits near 38%.
- 60 minutes. Downside persistence has climbed to roughly 72%. A surviving downward move is now meaningfully more reliable.
- 90 minutes. Both directions reach their highest supported conviction, around 76-79%. Act with the most confidence the data allows, while keeping residual reversal risk of roughly 21-24% firmly in view.
Volume confirmation is the layer most traders add next: a directional move that holds through the 60-minute checkpoint but is accompanied by declining participation is a different signal than one where volume sustains or expands, because shrinking volume into a surviving move raises the probability that conviction is fading rather than building.
That final checkpoint has a clock anchor worth committing to memory.
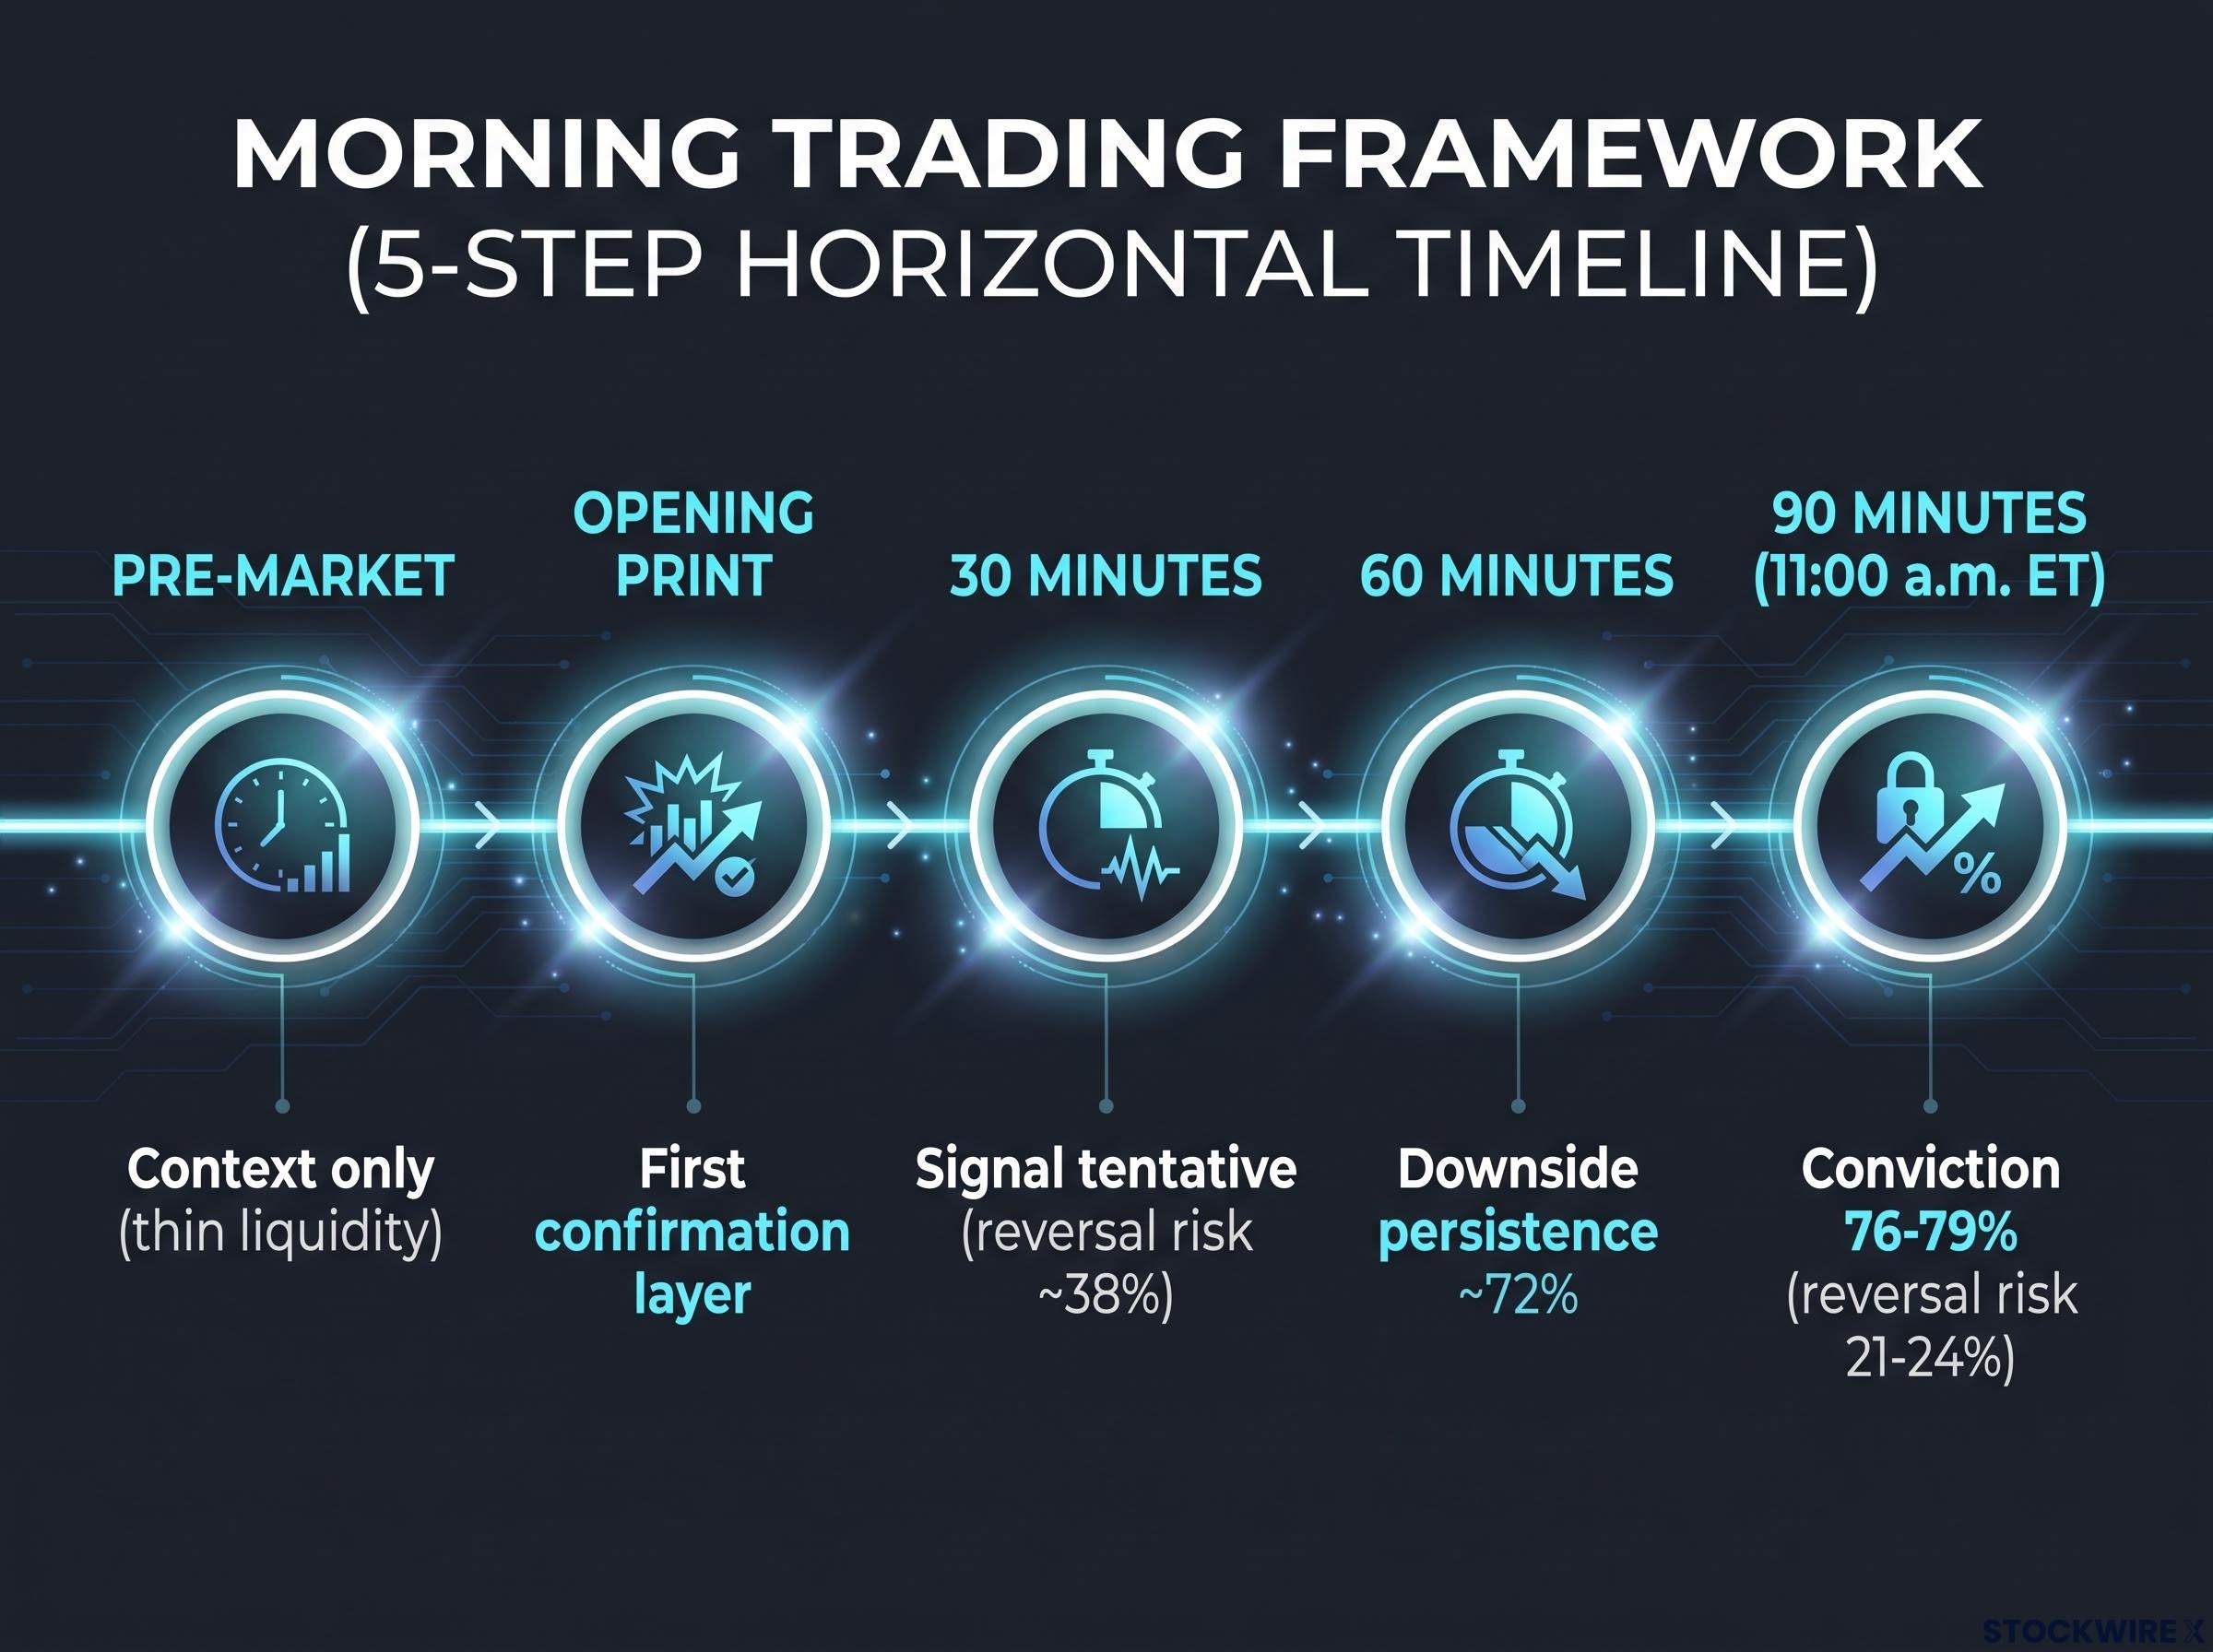
The 90-minute mark lands at approximately 11:00 a.m. ET. This is the empirically supported moment when the opening period has handed you the highest-quality directional information it is going to give. Committing fully with conviction before that is getting ahead of the data.
Sizing and stop discipline through the checkpoints
Your position should grow with your evidence, not ahead of it.
At 30 minutes, keep initial size small and stops tight, because the signal is tentative and the spread environment is punishing. As the move survives into the 60-minute and 90-minute marks, the strengthening persistence evidence justifies scaling in further.
One condition overrides all of it. If the session is flat, meaning the absolute price change stays within 0.25%, treat it as a no-signal environment. The persistence statistics were built on sessions with genuine directional character, so they simply may not apply when that character is absent.
The core discipline across every step is the same. Do not commit fully to a directional view based only on pre-market prices or the first few minutes of regular-session trading.
What the data does not change, and what it does
Back to the question you arrived with. Can you trust an early move? The honest answer is that early directional moves carry real but time-conditional information, and the 30-to-90-minute window is the period in which that information progressively sharpens, from roughly 62% reliability at the low end to about 79% at the high end.
That is a meaningful probabilistic edge, not an overwhelming one. The data cannot make residual reversal risk disappear, and it cannot substitute for macro-event awareness or disciplined execution. The framework does not generate trades. It structures when to trust what you are already seeing.
The most practically useful insight in the dataset is the asymmetry. Upside persistence stays stable throughout the window, while downside persistence rises sharply between 30 and 90 minutes. Translation: your instinct to act fast on a downward move is the exact moment you are most likely getting ahead of the evidence.
That is the recalibration worth keeping. You now know which checkpoint matters, and by how much.
This article is for informational purposes only and should not be considered financial advice. Investors should conduct their own research and consult with financial professionals before making investment decisions. Past performance does not guarantee future results, and the statistical patterns described are means drawn from historical data rather than predictions of any individual session.