
Most traders do the opposite of what the data rewards. When markets fall 3% in a day, the instinct is to step back from selling options and wait for calm. Yet a backtest spanning roughly 13 years shows that entries made on those exact 3% down days produced average profit and loss more than double that of entries made on any given day.
That gap raises an uncomfortable question for any premium seller. If the numbers favour selling into weakness, why does the impulse to sit on the sidelines persist, and what is the trade-off hiding behind that improved average? The study under examination used a specific vehicle: 16-delta strangles opened at roughly 45 days to expiration (DTE) and managed at 21 days remaining, tested across thousands of trades.
Here is what the data actually tells you about when selling options after a market down day works, when it does not, and what the numbers reveal about the risk you take on to capture that better average outcome. This is a data-grounded framework, not a simple yes or no answer.
What 13 years of strangle data actually shows about down-day entries
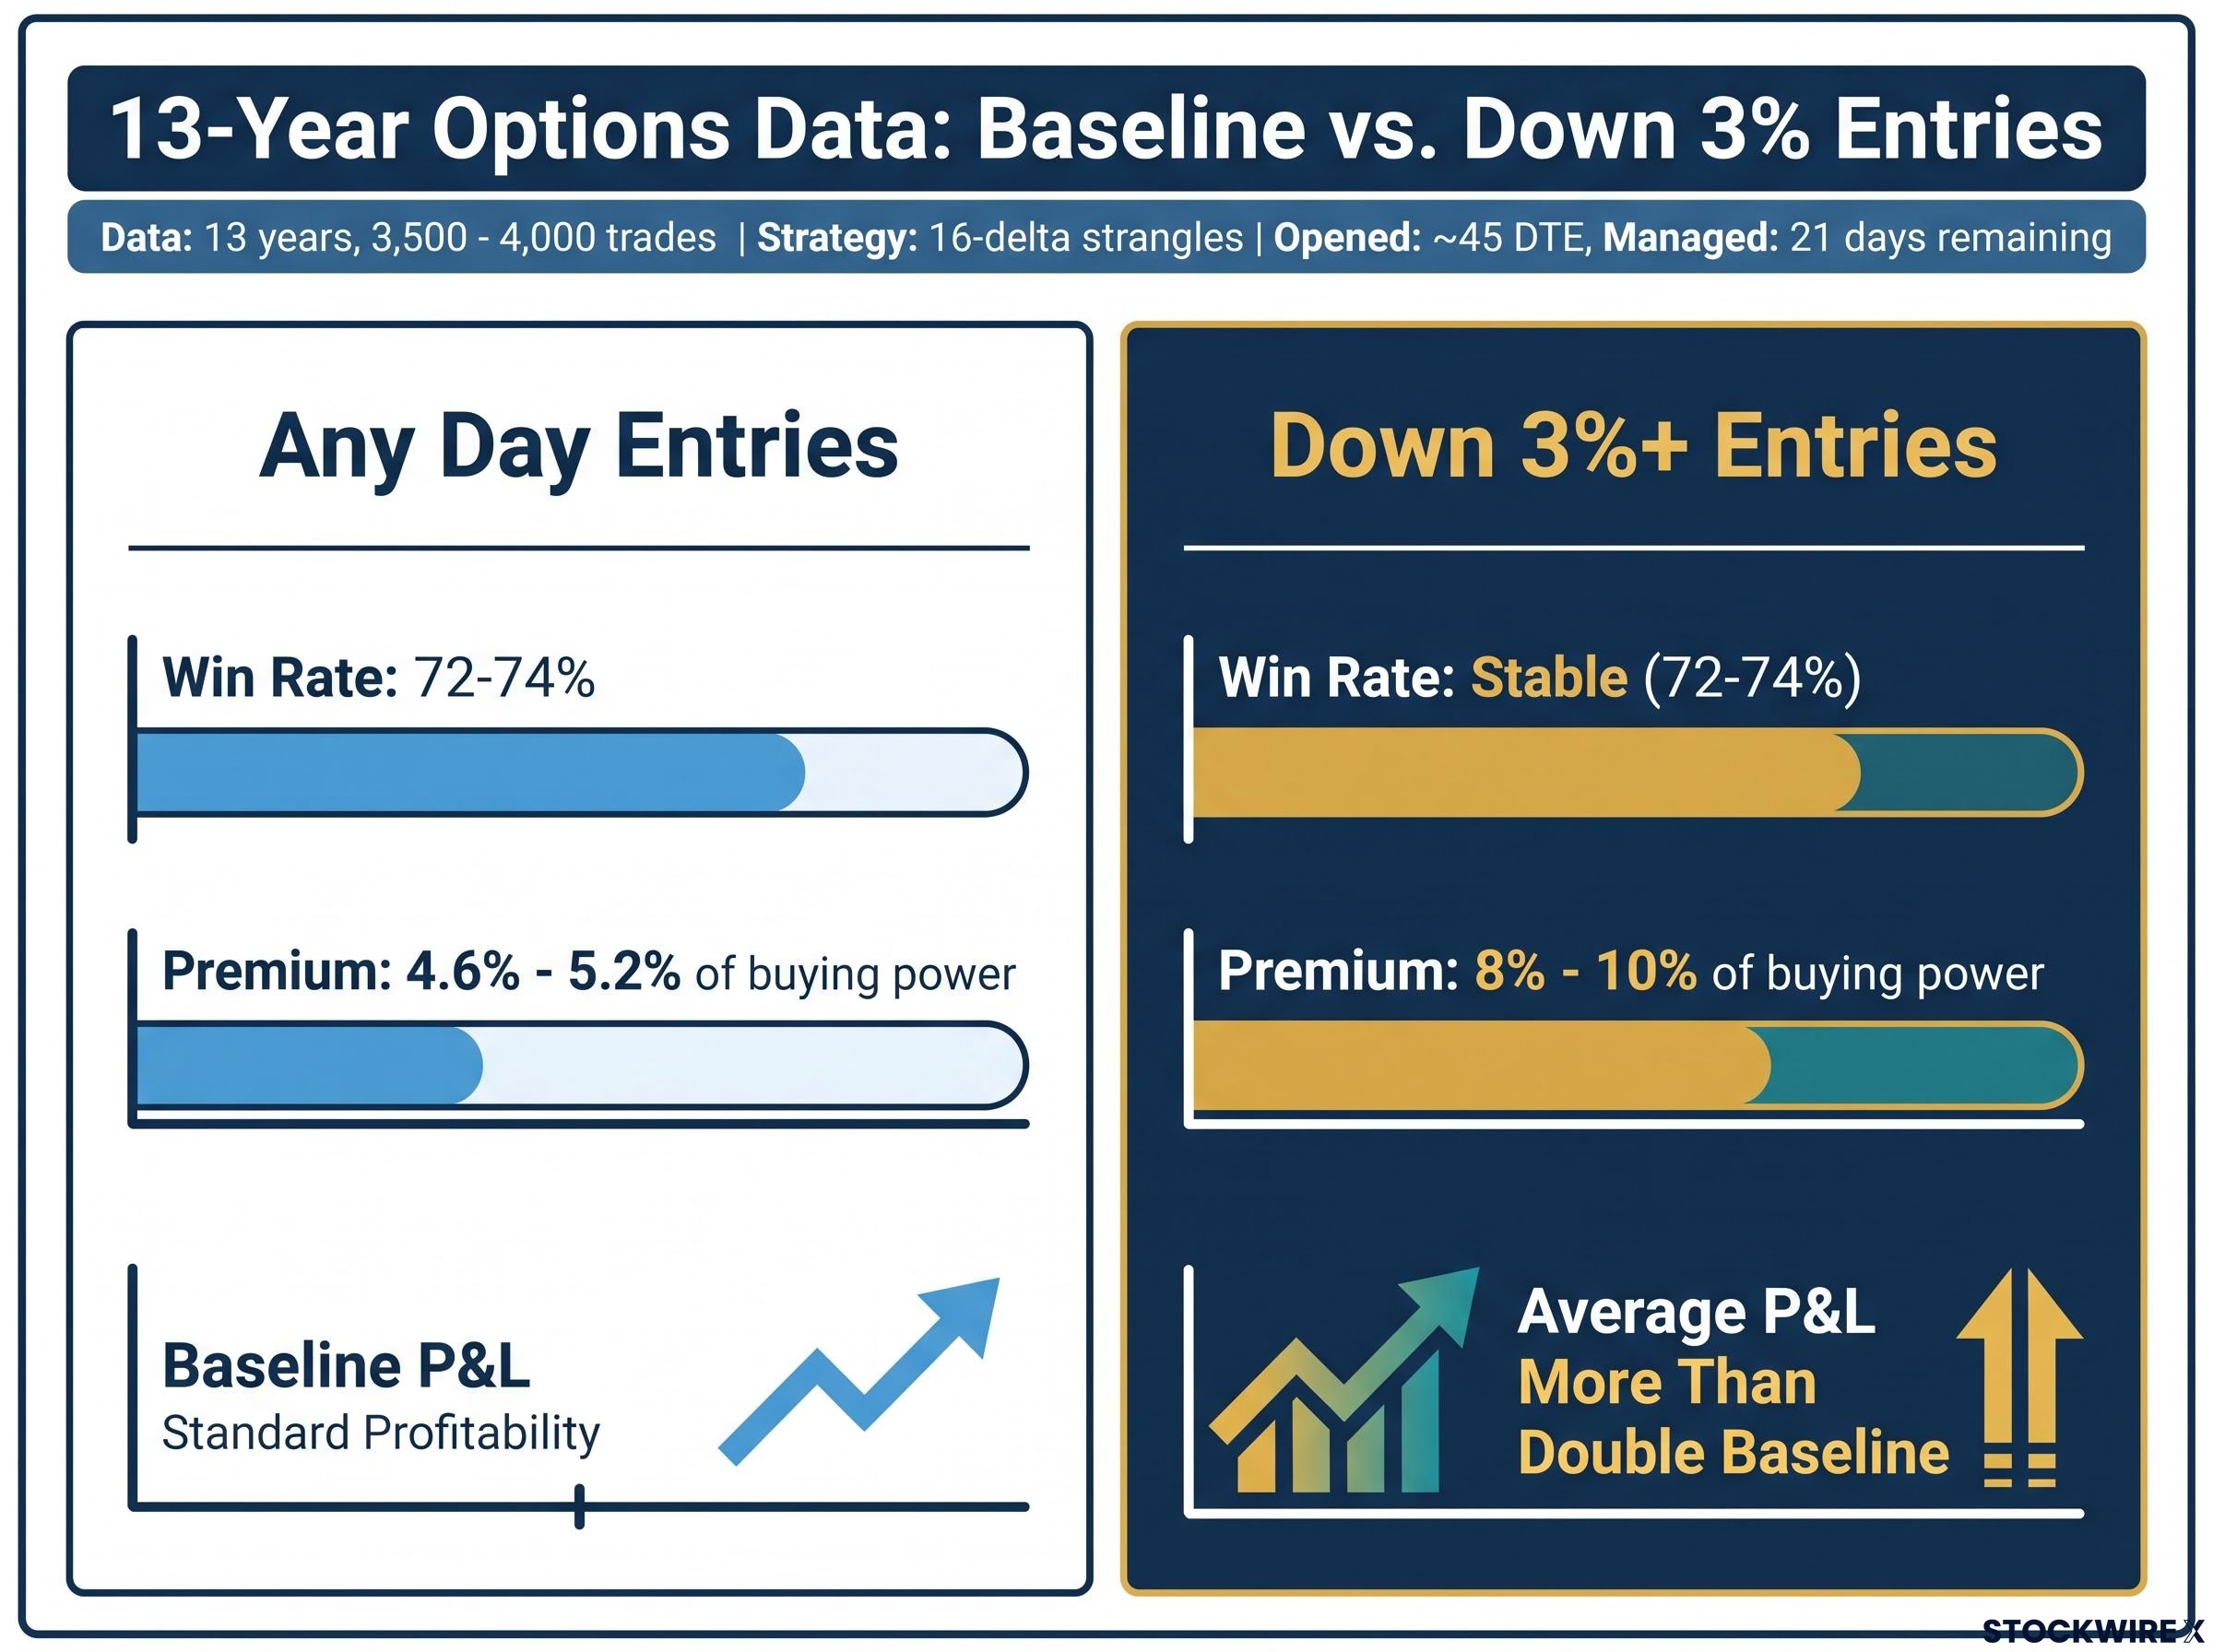
The tastylive research team built this study around a high-probability structure: a 16-delta strangle, which means selling a call and a put far enough out of the money that each has roughly a 16% chance of finishing in the money at expiration. Trades went on at approximately 45 DTE and came off at 21 days remaining, with somewhere between 3,500 and nearly 4,000 trades measured across about 13 years.
The trades were then sorted into buckets: any day, after a 1% down day, after a 2% down day, and after a 3% or greater down day. Walking through the metrics in that order is where the pattern becomes visible.
Start with average profit and loss. On neutral entries it sat at a baseline level, and as the selloff threshold deepened, the average climbed, until on 3% down days it had more than doubled relative to any-day entries.
Return on capital moved the same direction, rising from roughly 5% of buying power on ordinary entries to about 8% on high-volatility entries. Premium collected as a percentage of buying power followed suit: around 4.6% to 5.2% under all-conditions baseline, climbing to roughly 8% to 10% on the deepest down-day entries.
Then look at the win rate. It barely moved.
| Entry condition | Average P&L | Win rate range | Premium as % of buying power |
|---|---|---|---|
| Any day | Baseline | ~72-74% (full sample) | ~4.6-5.2% |
| Down 1% | Higher than baseline | Broadly stable | Rising |
| Down 2% | Higher again | Broadly stable | Rising |
| Down 3%+ | More than double baseline | Broadly stable | ~8-10% |
That stability in win rate is the detail that changes how you should read the headline number. If the average return doubled but you are not winning noticeably more often, the improvement is coming from the size of the winning trades, not their frequency. That distinction matters directly for how you size positions, because a bigger average built on bigger individual outcomes carries a different risk shape than one built on winning more consistently.
Full study versus post-COVID subset: why both periods matter
The research split into two windows, and the difference between them is instructive. The full 13-year sample included the COVID-19 crash, whose outsized losses dragged the overall averages lower.
The post-COVID subset, running from roughly 2020-2021 onward, showed substantially higher average profit and loss. A 2026 tastylive segment examining SPY strangles reported probability of profit in the 82% to 90% range across thresholds, notably higher than the 72% to 74% win rates seen across the full study. That discrepancy likely reflects the post-COVID subset versus the full sample, or a difference in structure, strangles versus puts-only tests, but both figures come from tastylive research.
The point is not that the post-COVID numbers are the new baseline. Both absolute gains and absolute losses are larger in that recent window, which tells you the macro volatility environment, not just entry timing, shapes short-premium outcomes.
When big ASX news breaks, our subscribers know first
The two structural reasons down days can favour premium sellers
The signal you can actually see on the screen after a selloff is a bigger credit. The question is what produces it, and the answer splits into two mechanisms that work on different timelines.
- IV expansion: a larger market drop pushes implied volatility higher, which inflates the premium you collect the moment you open the trade.
- Mean reversion: selloffs often precede rebounds, and holding for 21 days captures part of that recovery.
Implied volatility is the market’s forecast of how much the underlying will move. It rises when fear rises, through the well-documented inverse relationship between the S&P 500 and the VIX, Wall Street’s volatility gauge. When equities fall hard, the VIX climbs, and option premiums fatten along with it.
Implied volatility is the market’s forecast of how much the underlying will move, and it rises when fear rises, through the well-documented inverse relationship between the S&P 500 and the VIX. Traders who want to understand how implied volatility is extracted from live option prices and how to use it as a practical filter for strategy selection will find that foundational context directly relevant to reading down-day premium conditions.
The magnitude can be dramatic. According to Northern Trust’s Q4 2024 Options Commentary, the VIX reached an intraday high of 65.73 on 5 August 2024 after an SPX decline of roughly 3%.
On 5 August 2024, the VIX touched an intraday high of 65.73, one of the largest spikes outside the 2008-2009 crisis and March 2020, illustrating just how far implied volatility can expand on a single heavy down day.
Northern Trust also notes that selloffs steepen skew, meaning out-of-the-money index options command even richer credits for short premium sellers specifically. That is additional compensation layered on top of the broad IV lift.
The second mechanism plays out over the holding window. The tastylive data shows approximately 68% of all-condition trades posted higher returns at the 21-day mark than at entry, rising to roughly 74% for entries made after a 2% down day.
What this edge is not built on matters just as much. The tastylive research confirms the gambler’s fallacy, the belief that a down day must be followed by an up day, is not supported by the data. The improvement comes from IV structure and mean-reversion tendencies, not from a higher chance of a next-day bounce.
The Options Industry Council and Cboe primer frames the underlying logic cleanly: when options are overpriced relative to the volatility that actually materialises, sellers profit as implied volatility falls back toward realised volatility. The edge depends on estimating future volatility accurately.
AQR’s volatility risk premium research frames the seller’s edge as systematic compensation for bearing downside risk, meaning the improved average on down-day entries reflects a genuine premium for absorbing fear, not a free-lunch anomaly that disappears on inspection.
Separating these two forces matters because they have different durability. IV expansion hands you a better entry price immediately and reliably. Mean reversion only pays off if the underlying genuinely recovers within your 21-day window, and that recovery is not promised in every selloff.
The proportional increase in tail risk that the averages do not show you
A doubled average is a comforting number. It is also an average, which by definition smooths over the single worst outcomes, and in this strategy those outcomes get larger exactly as the entry conditions get more attractive.
Tail risk in short-premium strategies is structurally asymmetric: a win rate in the 65-75% range smooths over single events that can erase years of gains in one session, and the VIX spike to 65.73 in August 2024 confirmed that such events remain live risks in current market structure rather than historical curiosities.
The tastylive study found that the largest single loss as a percentage of buying power increased progressively as the entry threshold moved from 1% to 2% to 3% down days. The better average return arrives paired with a proportionally worse worst case. Three distinct layers of risk stack up here.
- Entry-day worst-case loss progression: the deeper the selloff you sell into, the larger your biggest potential loss becomes, because undefined-risk strangles have no capped downside.
- Duration risk during extended selloffs: if the market stays depressed rather than reverting, open positions accumulate mounting mark-to-market losses, and consecutive down-day entries can cluster those losses across several positions at once.
- Regime-shift risk: a policy or macro shock can reprice volatility abruptly, catching positions that were entered on a mean-reversion assumption.
That third layer has a concrete illustration. Northern Trust reports that on 18 December 2024, after the Federal Reserve signalled fewer 2025 rate cuts, the VIX spiked approximately 74% to close at 27.62, with equity spot/vol beta surging to 3.3. A trade opened expecting a smooth recovery would have met a regime change instead.
Institutional researchers have been consistent on this asymmetry. AQR’s paper “Chasing Your Own Tail Risk” argues that concentrating exposure into high-volatility regimes amplifies tail risk even when near-term premiums look richer.
Portfolios that maintain or reduce risk when forecast volatility is high tend to achieve better risk-adjusted returns, according to AQR’s “Chasing Your Own Tail Risk.”
Acadian Asset Management makes the structural version of the same point: short-volatility strategies carry asymmetric risk-reward, with outsized downside in turbulent conditions. The takeaway for you is specific, not generic. Selling options on a 3% down day is not a better version of the same trade. It is a structurally different risk profile, and your position size needs to reflect that before you enter, not after the loss arrives.
A risk framework for acting on down-day conditions without overexposing yourself
Knowing the edge is real does not tell you how to act on it safely. Four constraints, applied together, let you capture improved down-day conditions while controlling the specific pathways through which the tail risk actually shows up.
- Position sizing comes first. The tastylive research flags capital allocation as critical precisely because extended selloffs cluster losses. TradeStation advocates sizing inversely to volatility: larger in calm periods, smaller when volatility is elevated, to keep risk roughly constant.
- Use the 21-day rule as a duration cap. Exiting well before expiration limits your exposure to the scenario where the market stays depressed and open positions bleed. It is a built-in brake on duration risk.
- Hold profit-target discipline. Taking gains at a set fraction of maximum profit stops a winning trade from cycling back into loss if volatility re-spikes after an initial calm.
- Run a suitability check. Undefined-risk structures demand active monitoring and the capacity to meet margin calls during extended declines.
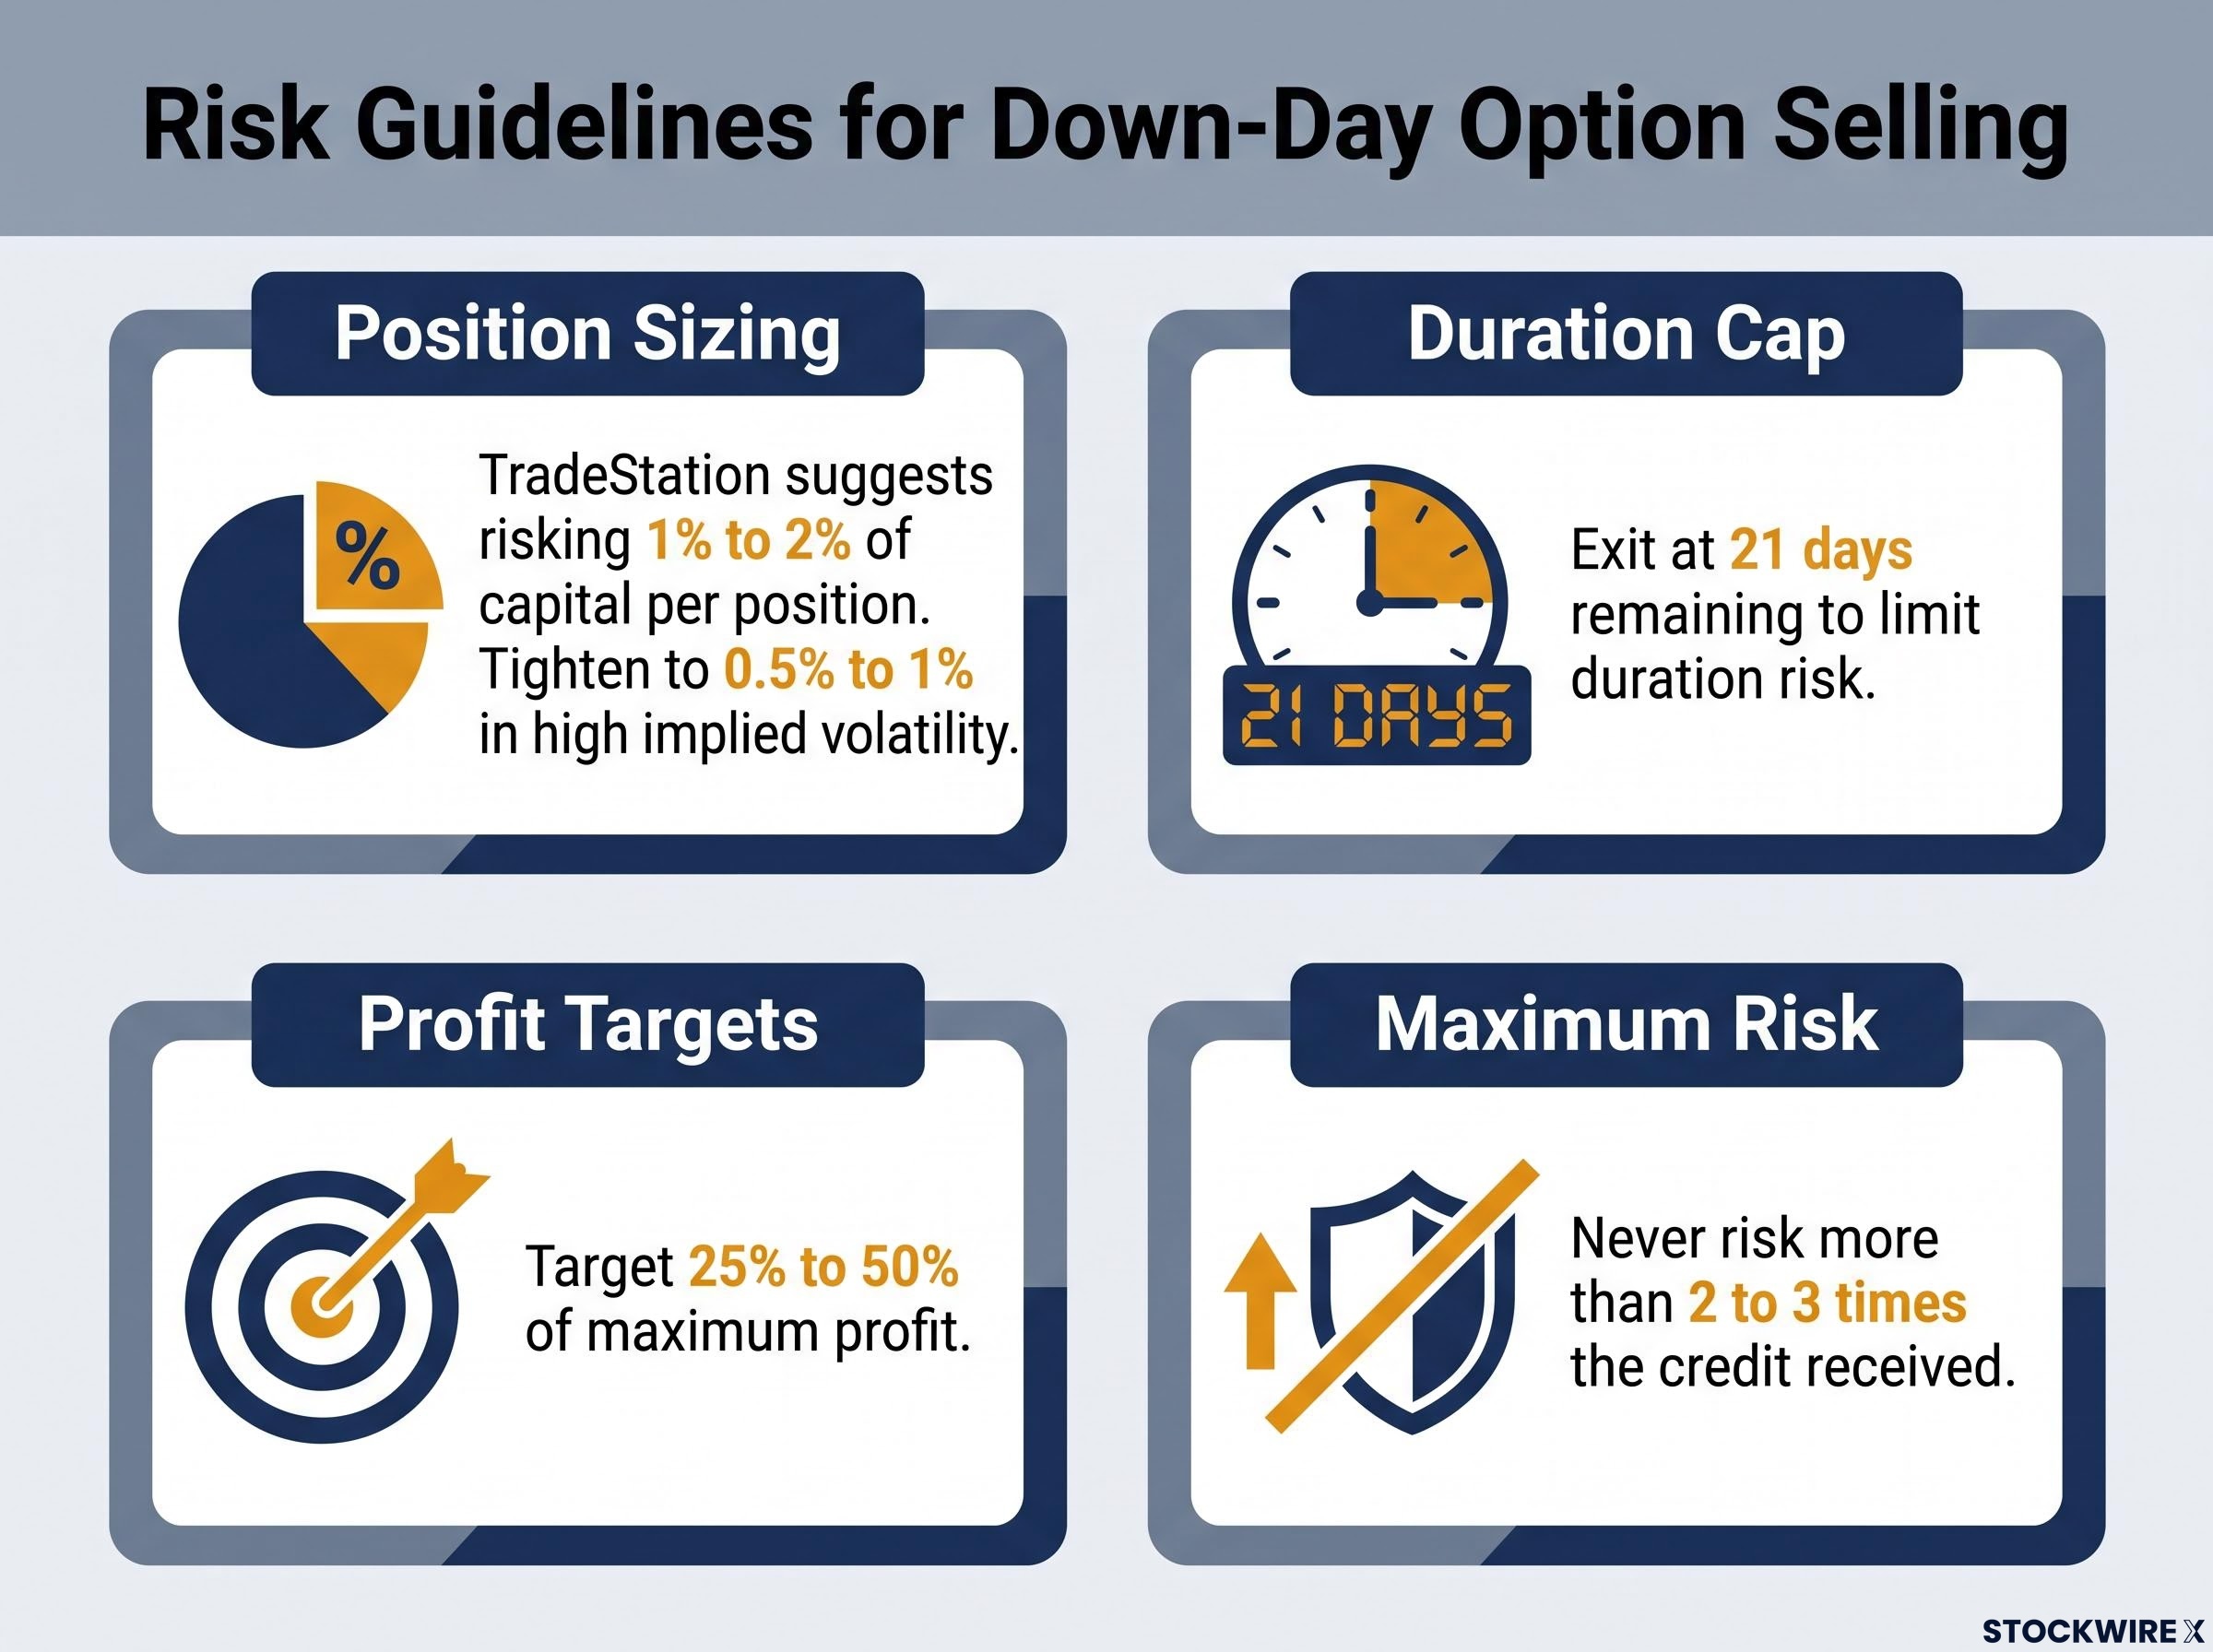
As practitioner guidelines rather than confirmed study findings, TradeStation suggests risking no more than 1% to 2% of trading capital per position, tightening to 0.5% to 1% when implied volatility runs above historical norms. It also points to targeting 25% to 50% of maximum profit and never risking more than 2 to 3 times the credit received. Treat these as professional rules of thumb, not backtested certainties.
Acadian adds the portfolio dimension: size each short-volatility position by its contribution to overall tail risk, so its nonlinear payoff cannot dominate your results in a turbulent stretch.
For investors wanting a concrete pre-entry framework to apply alongside the 21-day management rule, our dedicated guide to setting a loss exit rule walks through the credit-multiple method with exact buyback thresholds and shows how to automate the exit with a GTC order at the moment you open the position.
When the data says to wait rather than sell
Not every down day fits the conditions the backtest was built to capture. Extended multi-day declines, policy-shock regime shifts, and situations where margin pressure could force you out before mean reversion plays out all sit outside the comfortable middle of the historical sample.
This is exactly the scenario AQR and Acadian warn against: entering or concentrating short-volatility positions during high-forecast-volatility regimes just because the historical average looks attractive. Wealth Professional reinforces the suitability point, noting that undefined-risk strategies require robust models, disciplined execution, and acceptance that models can fail in unusual crises. If you cannot monitor positions or meet potential margin calls through an extended selloff, the improved average is not yours to collect.
This article is for informational purposes only and should not be considered financial advice. Investors should conduct their own research and consult with financial professionals before making investment decisions. Past performance does not guarantee future results. Financial projections are subject to market conditions and various risk factors.
What the data settles, and what it leaves open for every individual trade
The 13 years of data resolves more than most traders assume, and less than the headline figure implies. Hold those two truths at once and you read the study correctly.
What the data settles:
- IV expansion and mean-reversion tendencies are structural, not coincidental.
- Down-day entries produced improved average outcomes, with average P&L more than doubling on 3% down days and return on capital rising from roughly 5% to 8%.
- Win rates stayed broadly stable, in the 70% to 90% range depending on dataset, so entry timing does not disrupt the fundamental edge of premium selling.
What remains a judgment call per trade:
- The specific cause of any given selloff.
- Whether mean reversion will actually play out within 21 days for that event.
- Whether today’s volatility regime resembles the sample or represents a structural shift.
IV regime relative to an asset’s own historical range is the filter that determines whether a down-day entry represents a genuine premium-selling opportunity or a volatility trap: when absolute IV sits below 20%, the credit available may not justify the undefined-risk structure regardless of the recent market move.
Institutional voices, AQR, Acadian, and Wealth Professional, converge on a shared caution: even robust backtests can overstate timing edges because of data-mining, model error, and the under-representation of tail events in historical samples. The study’s real value is not a mechanical rule to sell after every 3% down day. It is a better-calibrated starting point for the one decision that preserves or loses the edge: how much to size each entry.