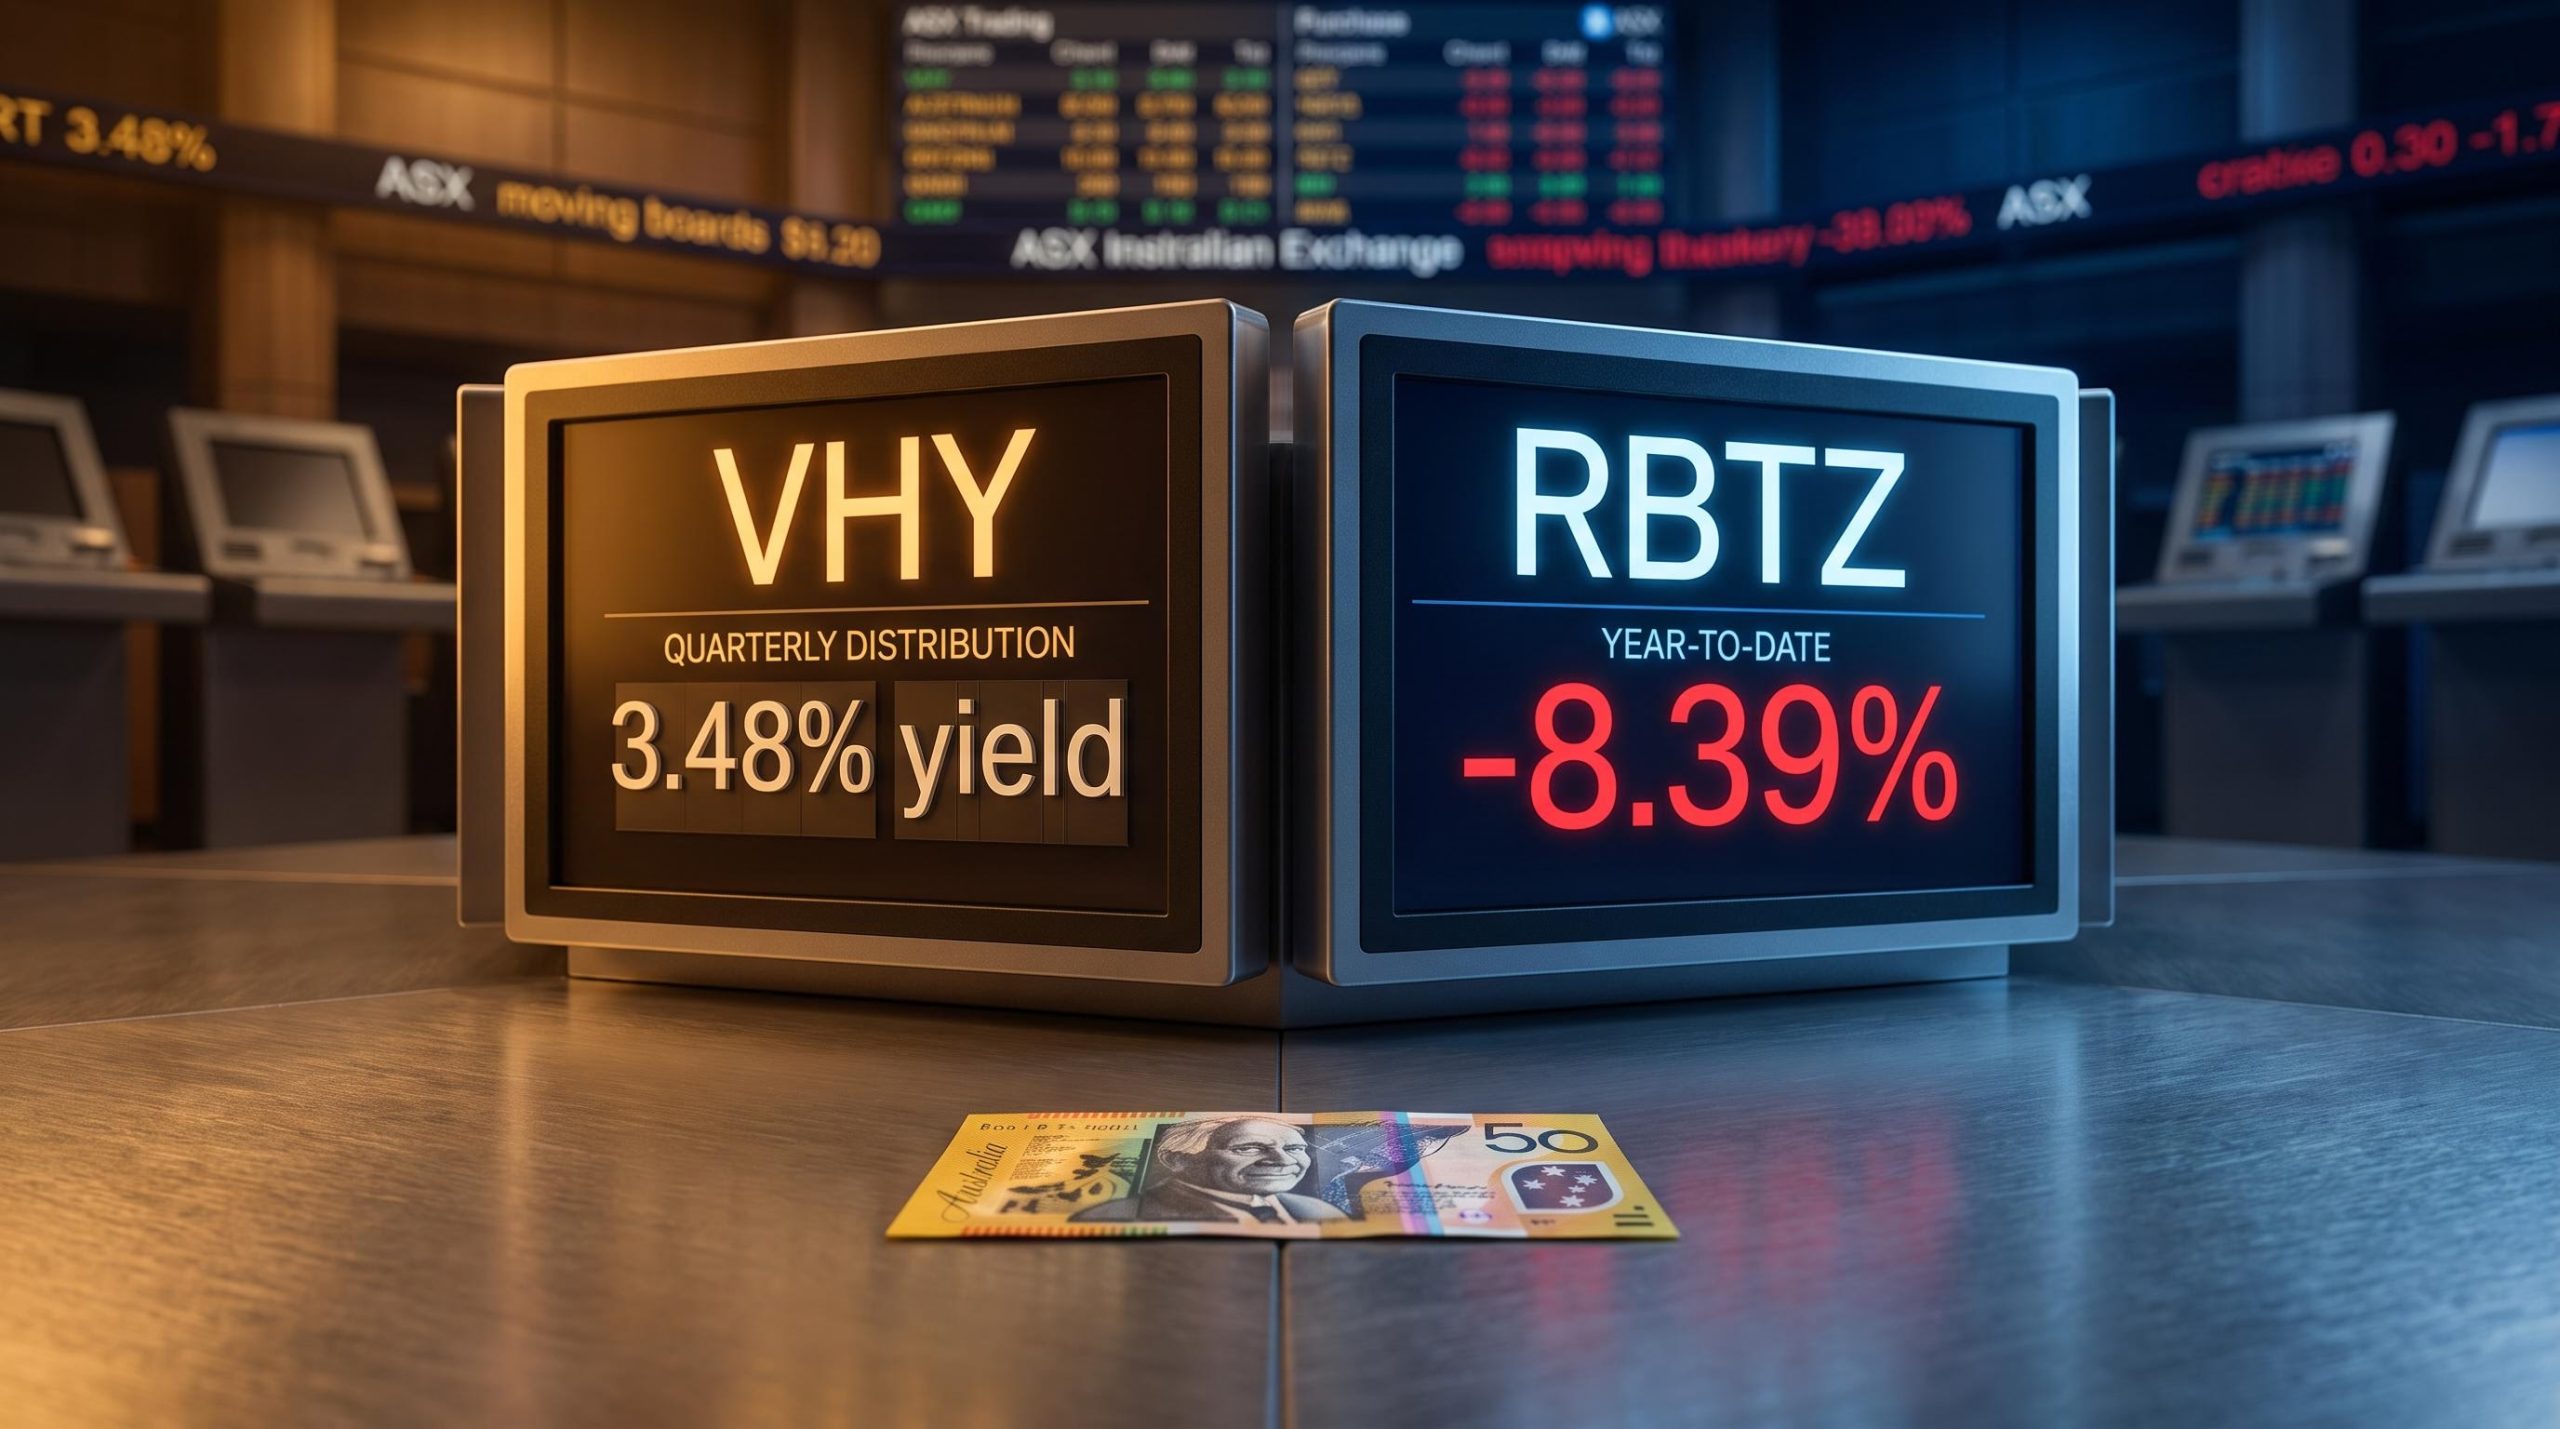
Picture an Australian investor with fresh capital, scrolling two ETFs on the same exchange. One pays quarterly cash straight into a bank account. The other has lost 8.39% this year alone. Both wear the same three-letter “ETF” label, yet they could not be more different in what they are built to do.
That difference is the whole point. In October 2026, income assets and growth themes are being re-priced at the same time: a rate-plateau environment is weighing on the valuation of long-duration technology holdings, while franked dividend income keeps its structural tax advantage for Australian taxpayers. The reader staring at these two funds is not choosing between “safe” and “risky” in any simple sense. They are choosing between two entirely different portfolio roles.
Here is the useful way to look at it: not which fund wins, but which job each one actually does, and whether that job is the one you need filled.
What each fund is actually built to do
Before comparing a single yield or fee, understand this. VHY (Vanguard Australian Shares High Yield ETF) and RBTZ (BetaShares Global Robotics and Artificial Intelligence ETF) are not two versions of the same product. They are two different machines solving two different problems.
VHY is an income machine. It tracks the FTSE Australia High Dividend Yield Index, holding mature ASX-listed companies forecast to pay above-average dividends, and it delivers quarterly distributions that carry franking credits where available. Its primary mechanism of return is cash in your hand, not price appreciation.
RBTZ is a growth machine. It tracks the Indxx Global Robotics and AI TR USD Index, a concentrated global basket of companies tied to robotics, automation, and artificial intelligence. Its 0.05% yield is not a disappointment; it is a signal. This fund is designed around capital growth alone.
Neither is a generic “equity ETF.” VHY restricts any single industry to a maximum of 40% and excludes Australian REITs entirely. RBTZ excludes almost everything outside its narrow thematic universe, including most of the technology sector.
| Fund | Index tracked | Yield / MER | AUM | Focus |
|---|---|---|---|---|
| VHY | FTSE Australia High Dividend Yield | 3.48%-3.60% yield / 0.25% MER | $8.14 billion (31 Aug 2026) | Australian income, quarterly franked |
| RBTZ | Indxx Global Robotics & AI TR USD | 0.05% yield / MER not disclosed in sources | $292.06 million (27 Sep 2026) | Global robotics & AI growth |
Key structural features of VHY:
- Caps any single industry at 40% and any single company at 10%
- Excludes Australian REITs (A-REITs)
- Pays quarterly distributions including franking credits
Key structural features of RBTZ:
- Narrow thematic scope: industrial automation, medical robotics, AI hardware and software, unmanned systems
- Primarily developed-market, heavily US-listed holdings
- Negligible income by design
Now look at the size gap. VHY holds roughly 28 times the assets of RBTZ. That is more than a liquidity footnote. It tells you how the broader Australian market is actually using these instruments: there is vastly more capital sitting in the income-first mandate than in the thematic-growth one. Register that gap, because it frames everything that follows.
When big ASX news breaks, our subscribers know first
The franking credit advantage and why it reshapes the income calculation
A 3.5% headline yield sounds modest. For most Australian taxpayers holding VHY, the true figure is higher, and the reason is franking credits.
Franking credits are tax credits attached to dividends paid by Australian companies that have already paid corporate tax on their profits. The company pays tax at the 30% corporate rate, then passes a credit for that tax to shareholders alongside the dividend. Vanguard explicitly structures VHY to pass these credits through in its quarterly distributions where available.
The franking credit gross-up formula divides the cash dividend by 0.70 to produce the grossed-up yield, but the practical value of the credit depends on the investor’s marginal rate, with pension-phase SMSFs capturing the full 30% credit as a refundable ATO cash payment.
RBTZ offers none of this. It holds primarily US-listed companies that pay little or no dividend, so Australian investors receive no franking benefit and face foreign withholding tax on the negligible distributions that do occur. On income alone, the two funds are not in the same conversation.
How the grossed-up yield calculation works in practice
The mechanics are worth walking through, because the maths is where the advantage becomes real.
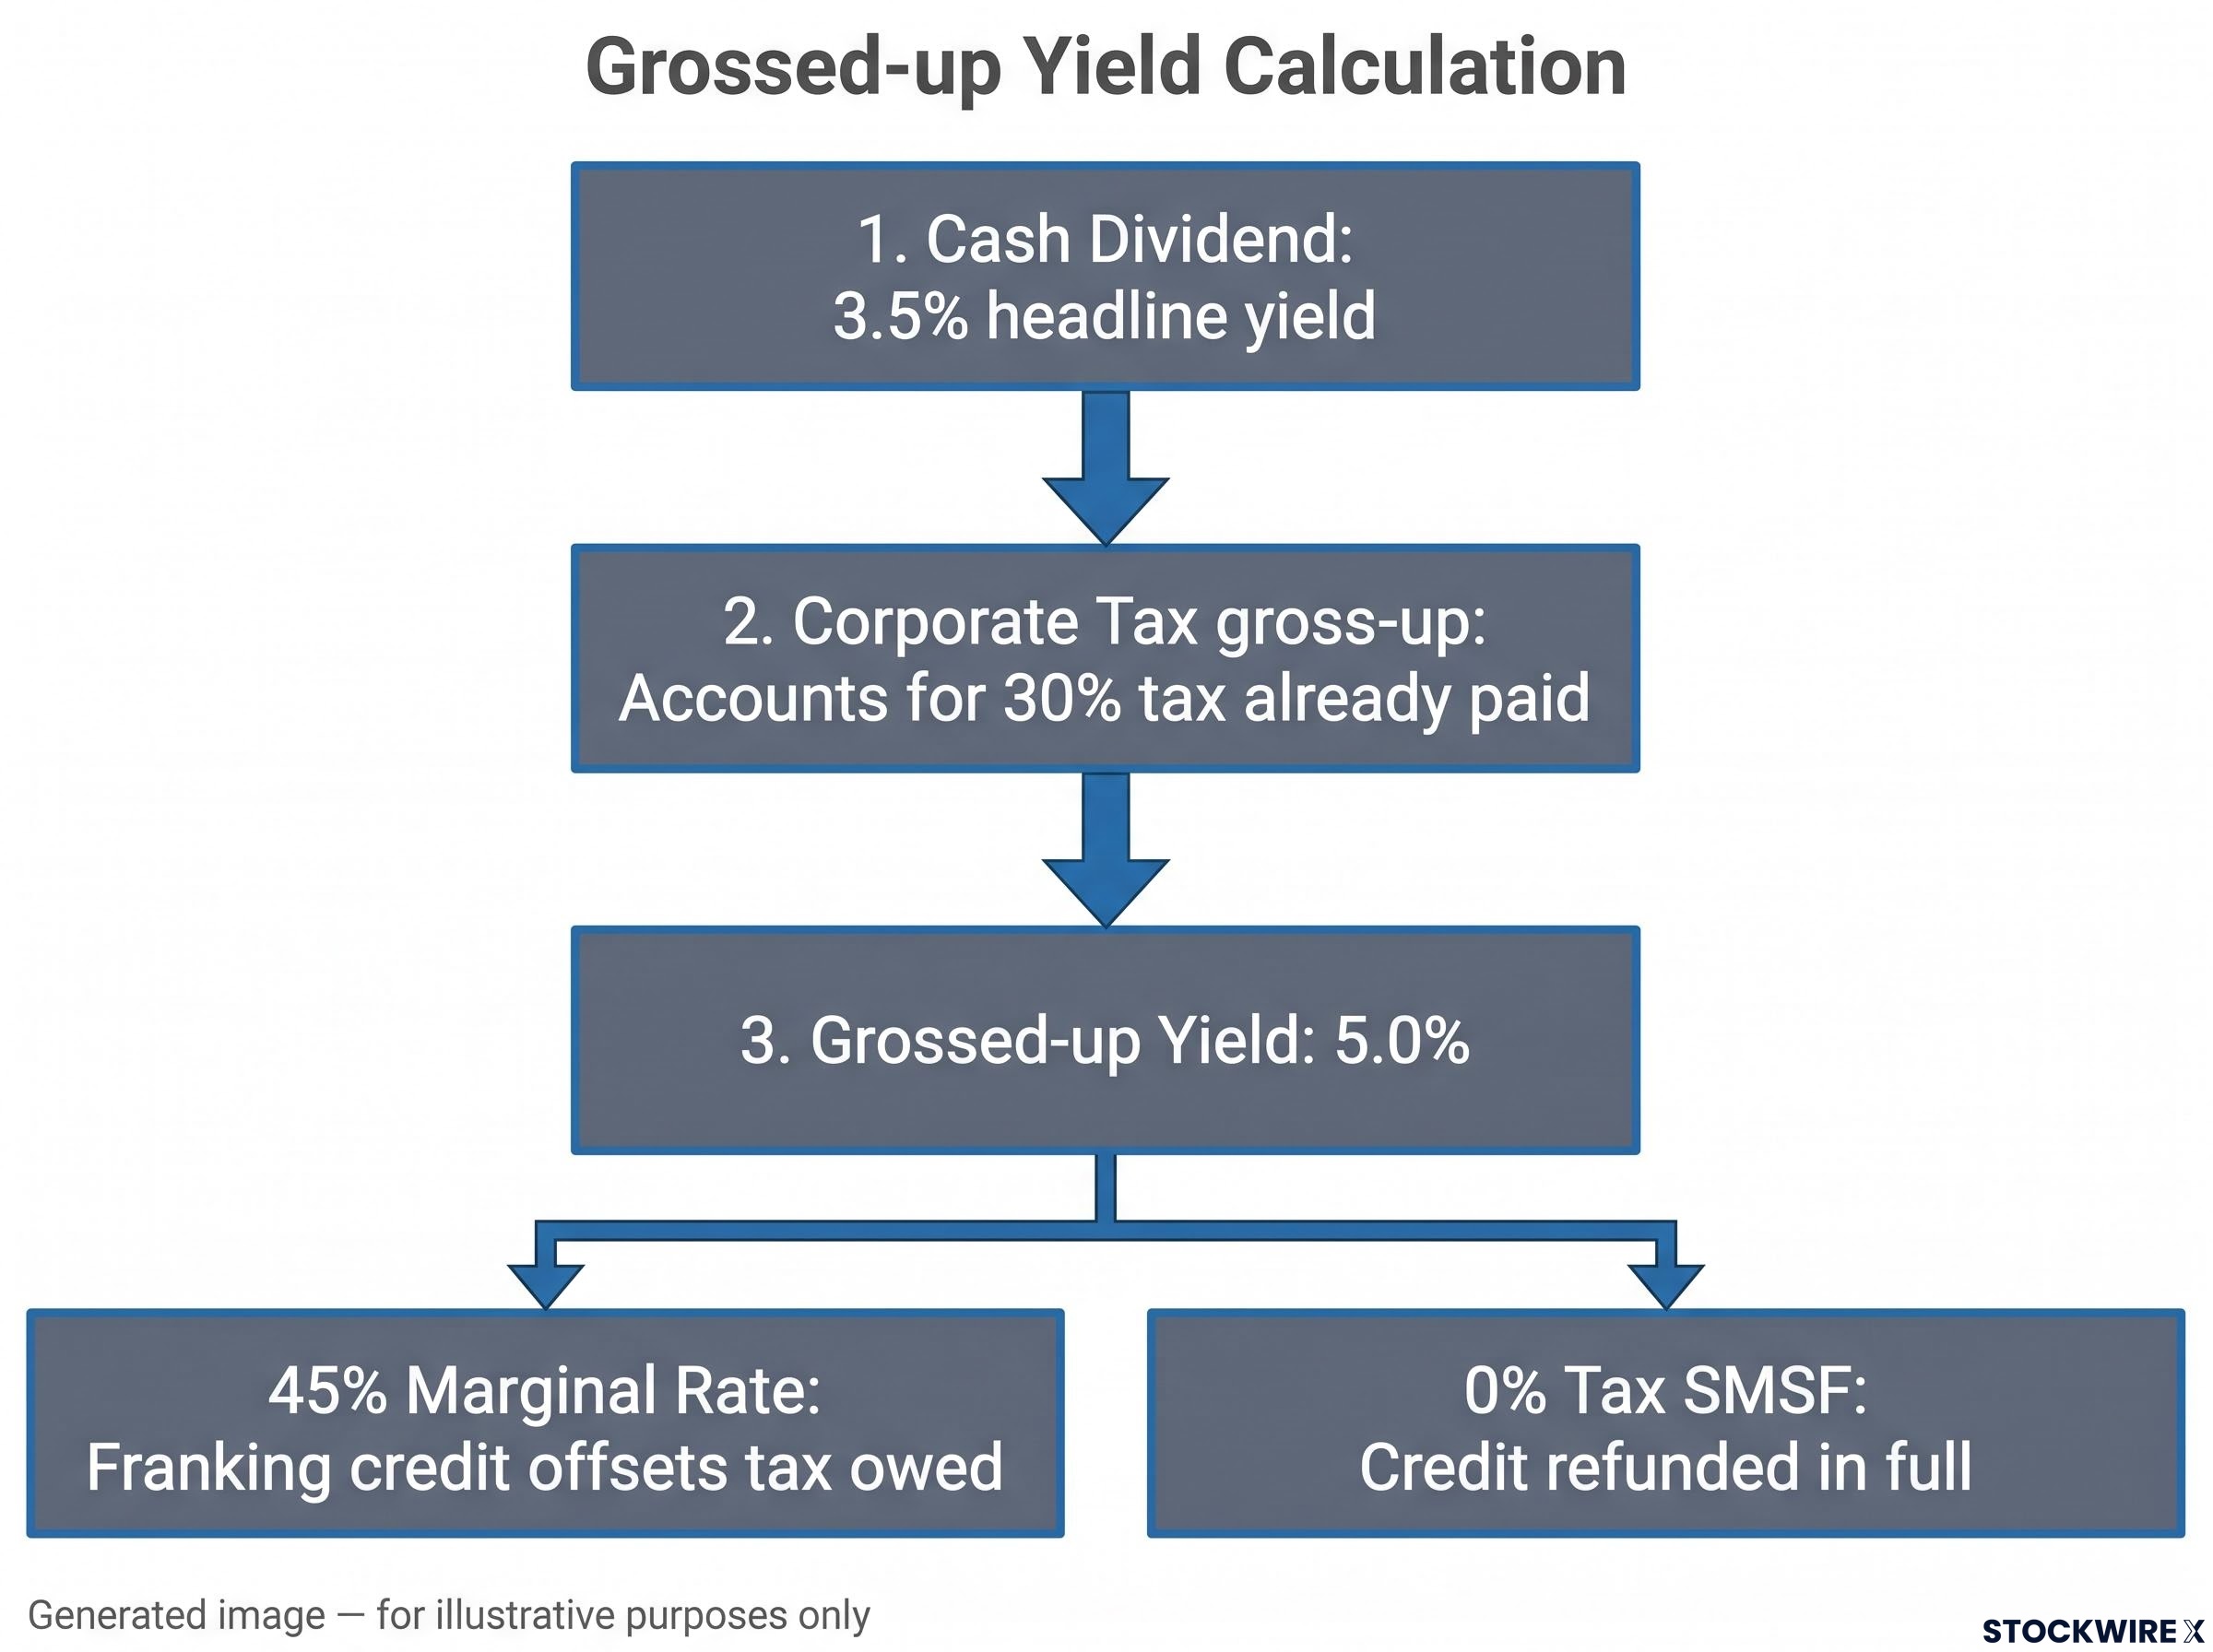
- Start with the cash dividend. Say VHY pays a 3.5% headline yield on your units.
- Gross it up for the tax the company already paid. The formula is: grossed-up dividend = cash dividend / (1 – corporate tax rate). At the 30% rate, that is 3.5% / 0.70.
- This produces a grossed-up yield of 5.0% on a fully franked basis, before considering your own tax position.
- Apply your marginal tax rate. For an investor on a 45% marginal rate, the franking credit offsets part of the tax owed, lifting the effective after-tax yield well above the 3.5% cash figure. For a 0% tax entity such as an SMSF in pension phase, the credit can be refunded in full, pushing the effective yield toward that grossed-up 5.0%.
An important caveat: these figures are illustrative. The exact average franking percentage on VHY’s distributions is not disclosed in current public sources, and the actual franking level varies by distribution. The fund’s annual tax statement is where the real numbers appear.
For an investor drawing income from superannuation in pension phase, or an SMSF receiving refundable franking credit offsets, VHY’s effective after-tax yield can sit materially above the headline figure. That gap can be decisive when comparing it against any unfranked alternative, including RBTZ.
The takeaway is simple. If you accept VHY’s headline yield at face value, you are underestimating what it does for you. Run the gross-up at your own marginal rate before you compare it to anything else.
What “long-duration” means for RBTZ investors and why the rate environment matters
RBTZ’s 8.39% fall this year is not random noise. It is a structurally predictable response to a specific macroeconomic condition, and understanding why requires one concept: duration.
The mechanics of long duration
In equity valuation, a company’s worth is the present value of its expected future cash flows. To calculate present value, those future cash flows are discounted back using a discount rate tied to interest rates.
A “long-duration” asset is one whose value is concentrated in cash flows many years out rather than in near-term earnings or dividends. The further away the cash flow, the more sensitive its present value is to the discount rate. When rates rise, discount rates rise, and distant cash flows get marked down hardest.
Equity duration mechanics explain why a one-percentage-point rise in the discount rate can cut less than 1% from a near-term cash flow but roughly 17% from one expected in 20 years, a mathematical asymmetry that directly drives the outsized rate sensitivity visible in RBTZ’s 2026 performance.
This is why growth themes behave the way they do. Robotics and AI companies in RBTZ’s index, names such as NVIDIA Corp in AI hardware and software, or Intuitive Surgical in medical robotics, derive much of their current market value from expected growth over the coming decade. That makes them acutely sensitive to interest rates and shifts in risk appetite.
VHY sits at the other end of the spectrum. Its tilt toward financials and resources means more of its value rests in near-term earnings and dividends, making it comparatively less sensitive to discount-rate changes. It is not immune, though. Those cyclical sectors carry their own business-cycle and dividend-cut risk.
There is a competing read worth holding. Some analysts argue that strong structural AI adoption can offset higher discount rates for the profitable, cash-generative leaders, meaning RBTZ’s rate sensitivity is real but not uniform across every holding.
- Primary return driver: VHY, dividends and franking. RBTZ, future capital growth.
- Rate sensitivity: VHY, lower. RBTZ, high.
- Volatility profile: VHY, moderate. RBTZ, high with multi-year drawdown potential.
- Time horizon assumption: VHY, medium to long. RBTZ, a decade-plus thesis.
How rate sensitivity played out for RBTZ in 2026
The 8.39% year-to-date loss (as at 30 August 2026) lands squarely in a rate-plateau environment. That is the mark-to-market reality.
The RBA’s Statement on Monetary Policy provides the central bank’s official assessment of the rate-plateau conditions that form the macroeconomic backdrop for both funds, including the inflation and labour market dynamics that inform the direction of the discount rates weighing on long-duration growth assets like RBTZ.
BetaShares frames the fund around a long-term structural narrative: in a March 2026 note, it described physical AI and humanoids entering the stage as the next leg of the theme. The tension is obvious. The long-term thesis is measured in years, while the share price is marked every single day.
One honest limitation: RBTZ’s one-year and three-year trailing performance figures are not available in current public sources, so the year-to-date number is a partial picture, not a verdict.
RBTZ’s negative year-to-date return is not, on its own, a reason to buy or to avoid the fund. It is a reminder that the thesis here is measured in years, not quarters. An investor without the conviction and time horizon to hold through drawdowns of this scale should not be in the position at all.
How to think about combining these funds in a single portfolio
The better question is not “which one.” It is “how much of each, and why.”
The standard practitioner answer is the core-satellite framework. VHY sits in the core, providing the bulk of domestic equity exposure and income. RBTZ sits as a satellite, sized to your risk budget and your conviction in the growth theme. Common guidance puts thematic satellites in the 5-20% of equities range depending on risk tolerance.
For investors in or near retirement, an income-growth bucket approach reframes the same idea. VHY sits in the income bucket, funding spending over the next 5-10 years. RBTZ sits in the growth bucket, tasked with long-term appreciation that replenishes the income bucket over time.
Sequencing risk is where this gets serious. If you rely on distributions, build a robust income core before adding volatile thematic positions. A large RBTZ drawdown early in retirement cannot be recovered through its distributions, because it barely pays any.
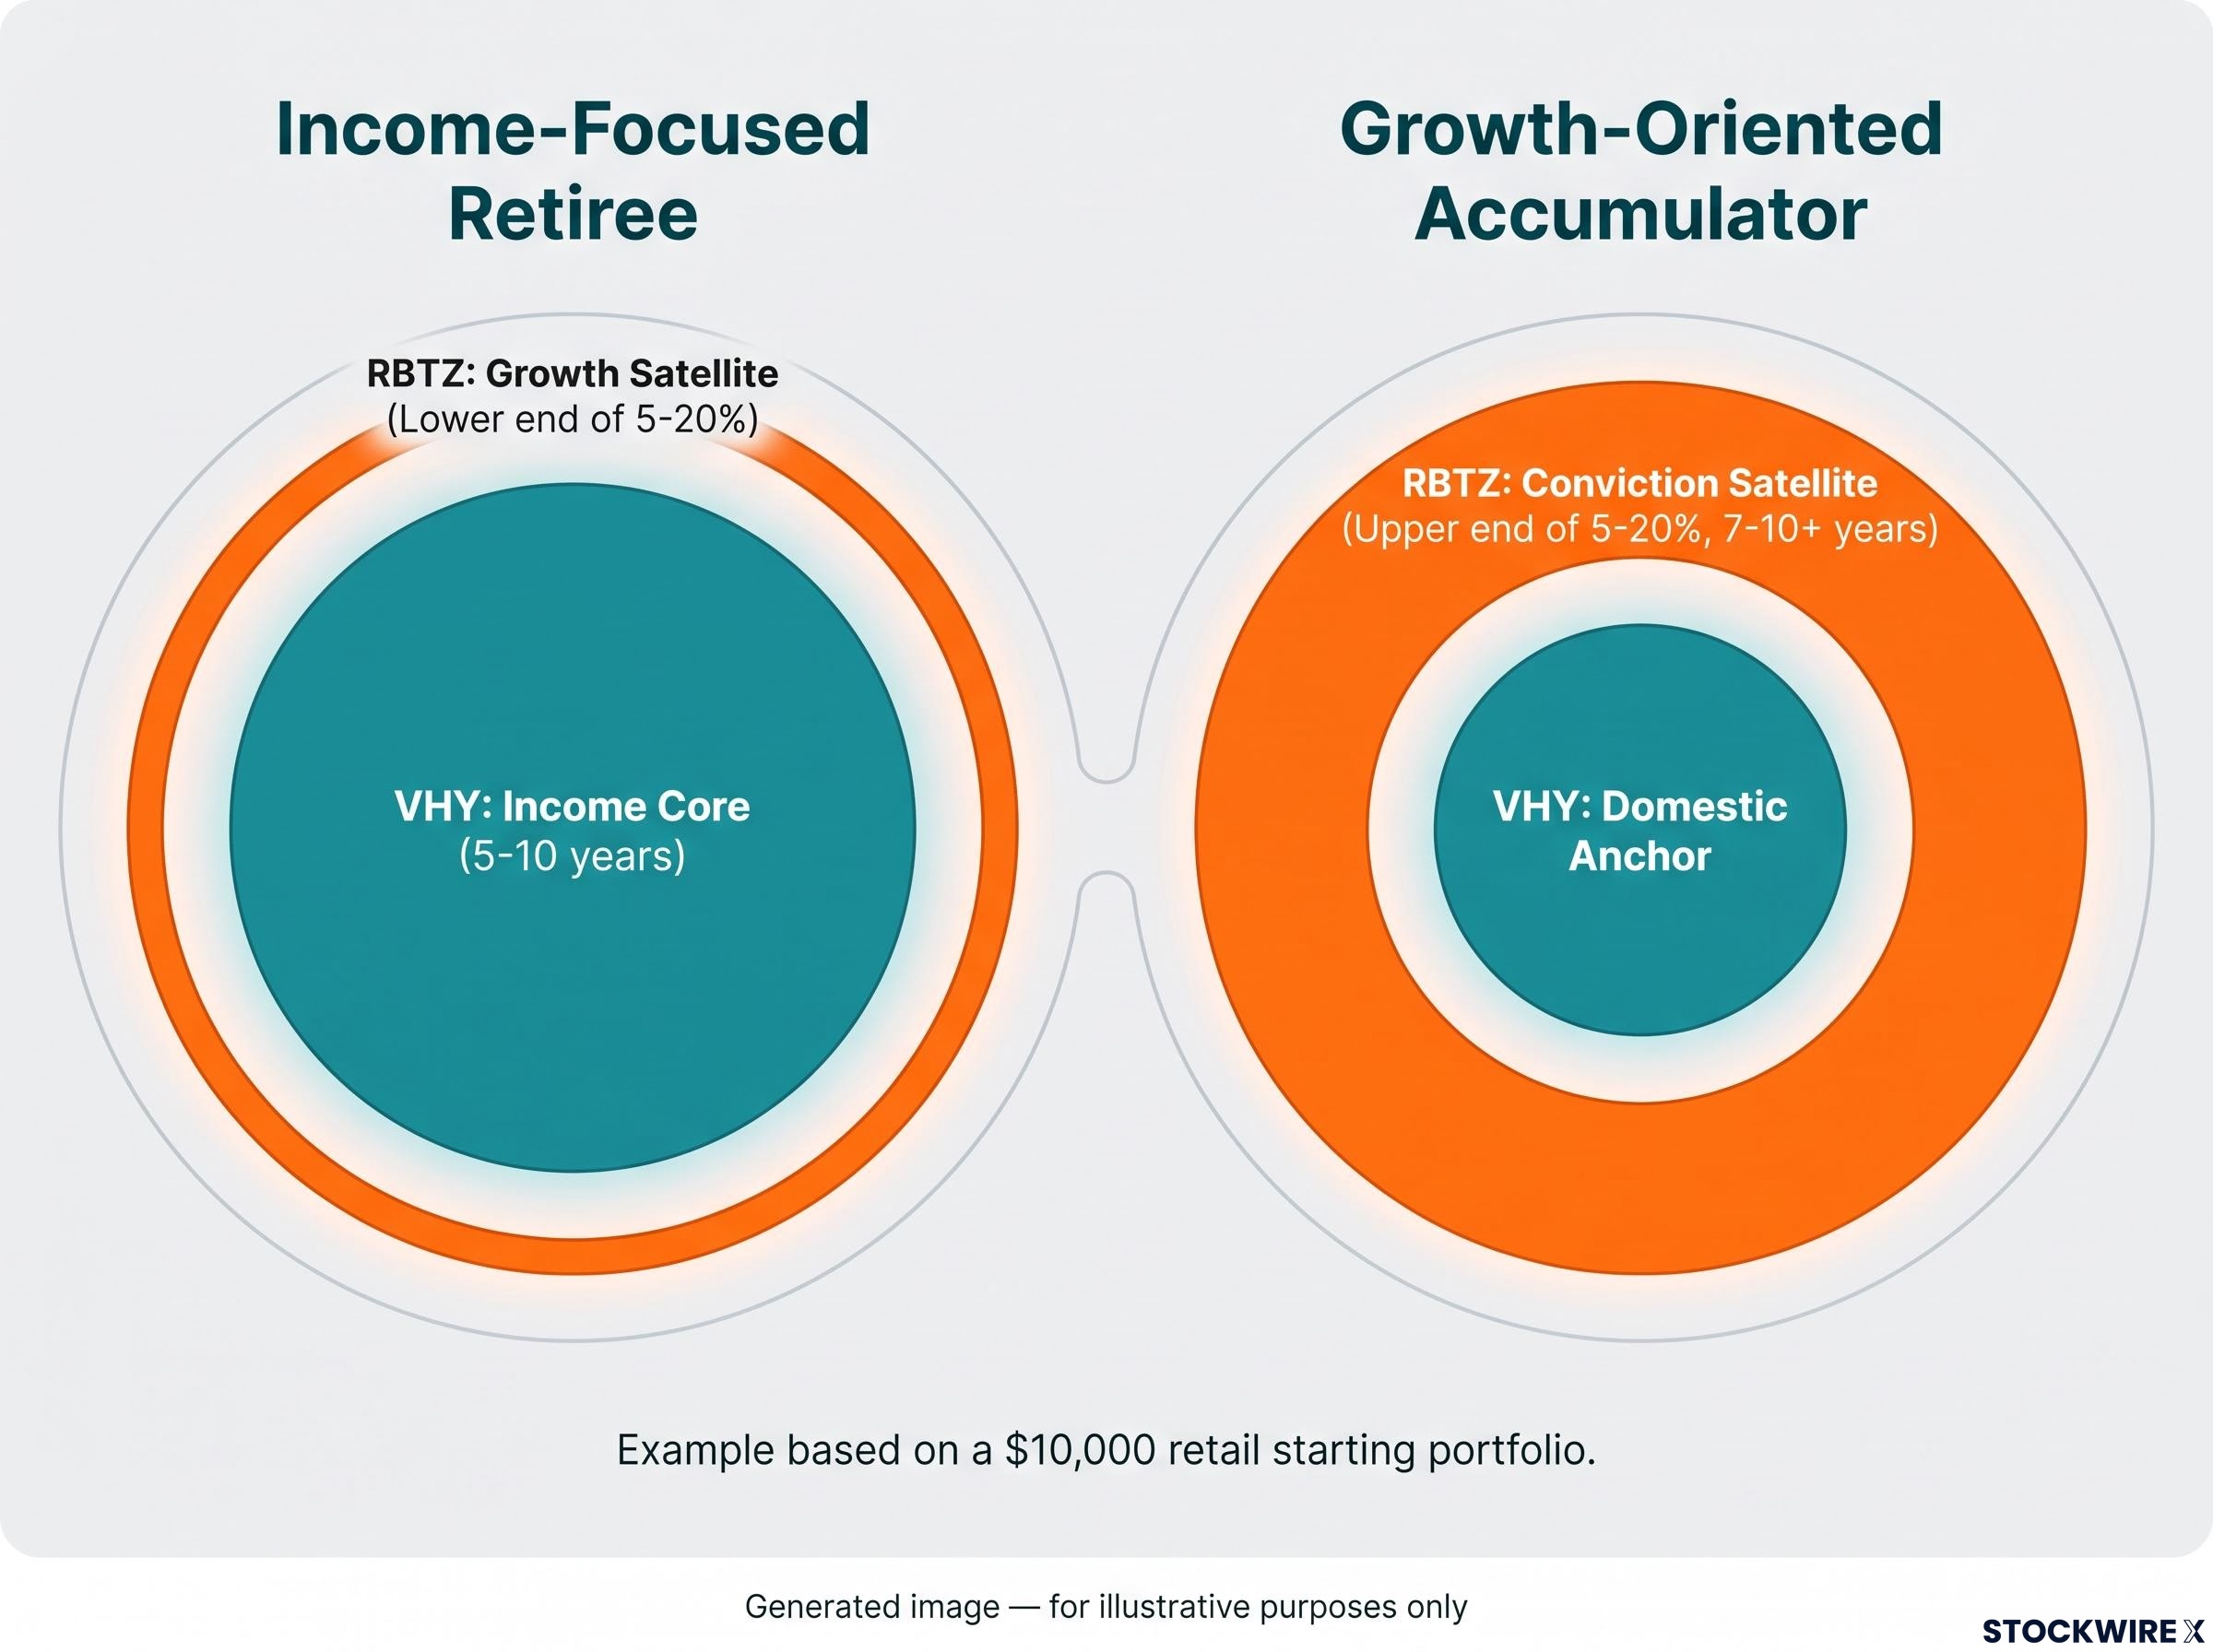
| Investor type | VHY role | VHY weighting | RBTZ role | RBTZ weighting |
|---|---|---|---|---|
| Income-focused retiree | Income core | Large core allocation | Small growth satellite | Lower end of 5-20% |
| Growth-oriented accumulator | Domestic income anchor | Smaller, alongside global equity | Conviction satellite | Upper end of 5-20% |
Three rules of thumb keep this disciplined:
- Keep themes small. RBTZ is spice, not staple.
- Respect sequencing risk. Secure the income foundation first.
- Rebalance mechanically. Trim thematic positions after strong runs, top up after large drawdowns, strictly within a pre-set risk budget rather than in reaction to headlines.
For a retail investor starting with, say, $10,000, the practical implication is direct. RBTZ belongs in the portfolio only after the income foundation is secure. If you cannot state what share of your total equities RBTZ represents, and what drawdown you are prepared to absorb, the position is not yet sized correctly.
For investors wanting to operationalise the framework with specific ASX ETFs and allocation rules, our dedicated guide to core-satellite portfolio construction covers how to size the core, set satellite position limits, and manage rebalancing triggers without incurring unnecessary capital gains events.
What kind of investor belongs in each fund
Strip away the mechanics and the question becomes personal: where do you sit on the income-to-growth spectrum?
The VHY investor profile:
- Income-reliant or income-focused, needing regular distributions
- Longer holding horizon for domestic equity
- Tax-sensitive, particularly SMSF or high marginal rate investors who benefit most from franking
- Comfortable with concentration in Australian financials and resources
- Not trying to make a specific bet on a technology theme
The RBTZ investor profile:
- Growth-oriented, with a time horizon of at least 7-10 years
- Comfortable with high volatility and multi-year drawdowns
- Treating the position as a satellite, never a portfolio anchor
- Holding genuine conviction in AI and robotics adoption as a structural driver
One practical note on size. RBTZ’s $292.06 million in assets sits well below VHY’s $8.14 billion. Before transacting, particularly in larger order sizes, verify market maker support and check bid-ask spreads, as liquidity in a smaller thematic fund can tighten in stressed conditions.
ASX robotics and AI ETF alternatives to RBTZ carry meaningfully different underlying exposures: GXAI tilts 79% toward US technology mega-caps while RBTZ sits 48% in industrials with heavy Japan and Switzerland weighting, a structural difference that produces distinct risk profiles even at an identical 0.57% MER.
The most common mistake in ETF selection is a mismatch between investor and mandate. A retiree pulled into RBTZ by recent AI headlines, or an accumulator holding VHY as a core when the real gap is global diversification, are both misaligned.
The clearest signal you are in the wrong fund is a mismatch between why you bought it and what it is delivering. If a VHY holder is frustrated by limited capital growth, or an RBTZ holder is alarmed by the absence of income, the fund is working exactly as designed. The problem is the allocation decision, not the fund.
When fund and investor are well matched, the fund’s behaviour across different market conditions becomes expected rather than alarming. That alignment is what separates investors who hold through volatility from those who sell at the bottom.
Making the call in an income-plateau, AI-cycle environment
The core finding of this analysis is that VHY and RBTZ are not substitutes. They operate in different portfolio dimensions, and “which one” is only the right question if you have a single slot to fill.
For most investors, the real work is monitoring the variables that will move each fund from here.
For VHY, watch:
- The trajectory of Australian bank and resources dividends, which drive the income
- Any franking credit policy changes, a standing policy risk for every franked domestic holding
- Broader domestic sector conditions affecting dividend sustainability
For RBTZ, watch:
- The pace at which AI adoption converts into actual monetisation
- The direction of long-term interest rates, given the fund’s duration sensitivity
- The resolution, or escalation, of AI regulatory headwinds
Stress-test BetaShares’ physical AI and humanoids thesis against the live 8.39% year-to-date drawdown. The honest question is when a decline of that scale shifts from a buy-the-dip opportunity to a thesis-breaking signal. That is the judgement no table can make for you.
In October 2026, the investor who has done this analysis correctly is not choosing between the two funds. They are deciding how much of each to hold, and they can articulate clearly what would cause them to change that allocation. Before allocating a dollar, be able to say whether you need income now, growth over a decade, or both, and if both, size each position within a structured framework.
This article is for informational purposes only and should not be considered financial advice. Investors should conduct their own research and consult with financial professionals before making investment decisions. Past performance does not guarantee future results, and financial projections are subject to market conditions and various risk factors.