Alphabet just posted 24% revenue growth and 82% cloud expansion, and its stock has been falling for four straight months.
That dissonance is where this analysis begins. At $344.08 as of 30 September 2026, Alphabet Class A (GOOGL) sits roughly 15.8% below its 52-week high of $408.61, barely 1-2% above its 200-day moving average, and has just recorded its longest consecutive monthly losing streak since 2015. The underperformance stops looking mysterious the moment you stop looking at revenue and start looking at where the cash is going.
A $6.73 million options bet placed across two call positions offers a precise window into how professional traders are reading this setup. This piece shows you exactly what is weighing the stock down, what the options structure reveals about professional conviction, and what would genuinely need to change for a recovery to take hold.
The paradox at the heart of GOOGL’s losing streak
Four consecutive months of negative closes is not noise. It is the longest such streak since 2015, and that alone warrants attention, even if it is not cause for alarm.
Here is the uncomfortable part. Those four red months arrived while the business underneath was running at full speed.
- GOOGL price: $344.08, versus a 52-week high of $408.61 (a 15.8% drawdown, within a wider 52-week range down to $235.84)
- Four consecutive monthly losses, the longest streak since 2015
- Q2 2026 revenue: $119.8 billion, up 24% year-over-year, with Google Cloud at $24.8 billion, up 82%
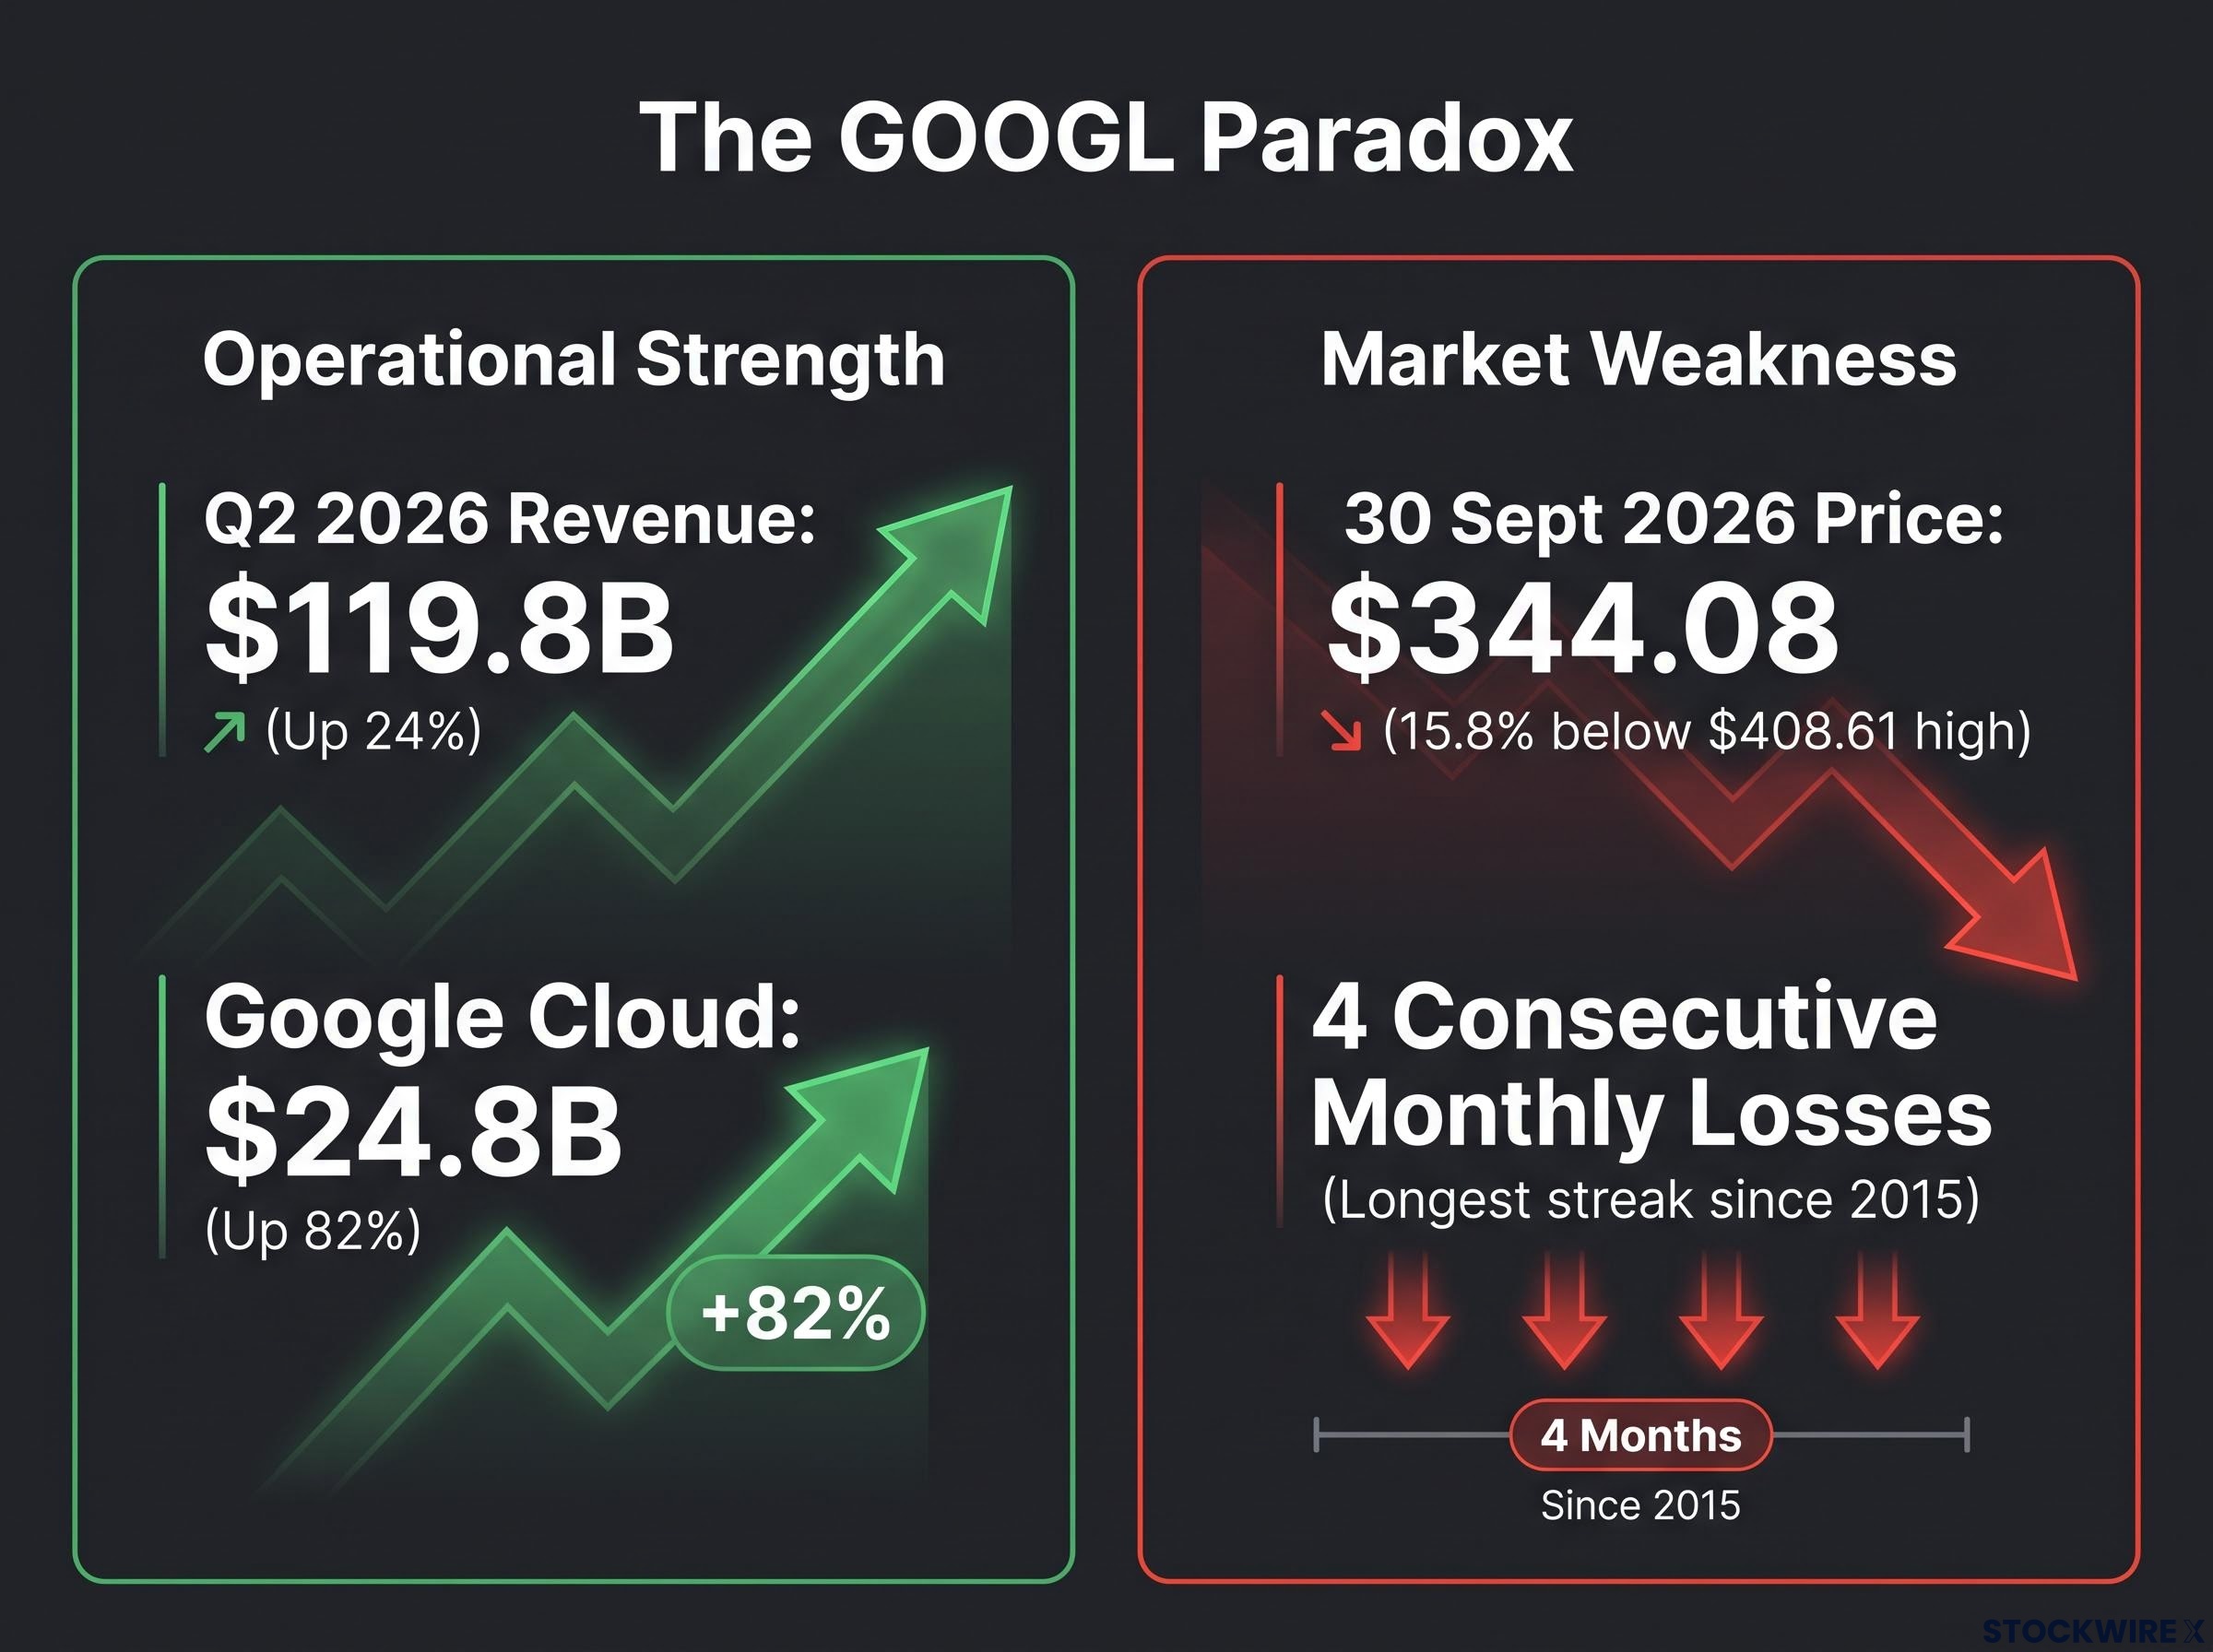
That is not a company in trouble. Cloud growth of 82% is among the strongest numbers Alphabet has ever printed, and a quarter approaching $120 billion in total revenue is operational strength by any measure.
The streak of four consecutive monthly declines is Alphabet’s longest run of losses since 2015, playing out against record cloud growth.
So why is the stock being sold? Because top-line growth is not the lens institutional investors are currently using to price this name. The stock sits just above its 200-day moving average (Yahoo Finance cites $338.44, Investing.com $342.59), a technical level that matters precisely because the fundamental story has shifted beneath it.
The juxtaposition tells you something specific. This is not a story about Alphabet’s business deteriorating. It is a story about the market repricing what that business is worth given how it now chooses to spend its money.
Alphabet’s AI repricing from a search incumbent to a vertically integrated AI operator was already underway in Q1 2026, when Google Cloud posted 63% year-over-year growth and a backlog approaching $460 billion, numbers that set the context for why the subsequent capex acceleration landed so hard on the share price.
When big ASX news breaks, our subscribers know first
What a $195 billion capex commitment does to a stock’s investment profile
The capital expenditure story is best read as a sequence, because the sequence is where the deterioration becomes visible.
It started with a ramp. FY2025 capital expenditures hit $91.4 billion, up roughly 74% year-over-year. That alone absorbed nearly all of the year’s incremental operating cash flow: FY2025 free cash flow came in at $73.3 billion, up just 0.7%, despite operating cash flow growing around 31.5%.
Then the ramp accelerated into 2026. Quarterly capex climbed from $27.85 billion in Q4 2025 to $35.67 billion in Q1 2026, then surged to $44.92 billion in Q2 2026.
| Period | Capex | Operating Cash Flow | Free Cash Flow |
|---|---|---|---|
| Q4 2025 | $27.85B | Not disclosed | Not disclosed |
| Q1 2026 | $35.67B | Not disclosed | Not disclosed |
| Q2 2026 | $44.92B | ~$39.1B | ~-$5.9B |
| FY2026 (guidance) | $195B-$205B | Not disclosed | Not disclosed |
By Q2 2026, the trajectory reached its logical endpoint. Capex of $44.92 billion exceeded operating cash flow of roughly $39.1 billion, producing negative free cash flow of approximately -$5.9 billion. For a company that has reliably thrown off tens of billions in free cash, a negative quarter is a visible break from pattern, and it is exactly the kind of inflection that shifts institutional perception of a company’s cash generation profile.
The Q2 2026 result marked the first time since Alphabet’s 2004 IPO that the company posted negative free cash flow, a threshold that carries symbolic weight beyond the single-quarter figure because it signals the infrastructure cycle has outpaced the business’s ability to self-fund.
Management then raised full-year 2026 capex guidance to $195-$205 billion. That is more than double the FY2025 figure, and it signals the pressure is not easing; it is scaling.
The buyback machine that stopped running
The second shift is quieter but arguably more consequential for the share price.
Alphabet repurchased no stock in Q1 or Q2 2026, ending a 33-quarter consecutive buyback streak. First-half repurchases were $0, against $28.31 billion in the comparable 2025 period.
Buybacks had been doing three jobs for the stock: shrinking the share count over time, absorbing dilution from employee stock compensation, and providing steady mechanical demand for the shares. Losing all three at once, at the exact moment capex surges, removes a structural floor.
Critically, this was not forced. Roughly $69.5 billion of buyback authorisation remains, so the halt was a deliberate reallocation, not an exhausted budget.
What this signals matters more than the lost demand itself. Management is telling you it views infrastructure spending as the highest-return use of capital right now, a bet that pays off in years rather than today. And without that mechanical buyer, downside moves no longer have a cushion, which raises the volatility risk for anyone holding the stock through a soft patch.
What two options trades reveal about the state of professional conviction
Options positioning does not predict the future. It maps the specific shape of the uncertainty professional traders are carrying, and the Alphabet structure is unusually revealing.
Two call positions were placed, and the architecture of the pair tells the story.
| Expiry | Strike / Premium | DTE | Implied Volatility | Breakeven |
|---|---|---|---|---|
| 23 October | $350 / $2.11M | 22 | 31% | ~$357.97 |
| 18 December | $375 / $4.62M | 78 | 34% | ~$387.87 |
The October position is the short-dated probe. At 22 days to expiration, a $350 strike, and just $2.11 million in premium, it buys exposure in the window before earnings without betting the farm.
The December position is the main event. At 78 days, a higher $375 strike, and $4.62 million in premium, it extends runway well beyond the earnings report, meaning the thesis does not require an immediate post-results pop to work.
Combined premium across both positions totals roughly $6.73 million, described as less than a quarter of the size of a single Lumentum trade in the same analytical window. By institutional standards, this is a modest bet.
That modesty is the tell. This is not conviction buying. It reads as a low-conviction recovery hedge, structured to survive a muted earnings outcome while keeping upside alive if conditions improve.
The allocation seals the read. Nearly 70% of the premium sits in the longer-dated December contract, and the December breakeven of $387.87 sits roughly 13% above the 30 September close of $344.08. These traders are not betting on a catalyst they can name before earnings. They are buying time to see whether the capex narrative shifts, and marking the price level, around $388, where a recovery thesis starts to look credible.
For investors wanting to apply this framework beyond the GOOGL positions, our dedicated guide to reading institutional options flow walks through the four structural markers that distinguish genuine directional bets from hedges, using a $12.34 million AMD cluster as the worked example.
What Alphabet actually has to offer investors who are new to this trade (and why it matters here)
If you have never traded options, this activity is easy to misread as stronger bullishness than it represents. Here is the toolkit to read it accurately.
- What buying a call signals. A call option gives the buyer the right to purchase a stock at a set “strike” price before a set expiry date. Paying for calls is a directional bet that the stock rises; the trader profits only if the price climbs high enough to cover what they paid.
- What implied volatility measures. Implied volatility is the market’s estimate of how much a stock might move, baked into the option’s price. The GOOGL calls carry 31-34% implied volatility, which is elevated. A calm large-cap typically sits closer to 15-20%, so these figures reflect genuine uncertainty around the capex trajectory and earnings.
- What breakeven requires. Breakeven is the price the stock must reach by expiry for the trade simply to avoid a loss. For the October calls that level is $357.97; for December it is $387.87. The stock has to clear that mark for the position to profit, which makes breakeven a direct read on how much movement the trader is counting on.
The difference between the two positions comes down to time. At 22 days to expiration, the October call is a near-term catalyst bet. At 78 days, the December call is a slower thesis trade that can ride out an inconclusive quarter.
Applying the framework back to the GOOGL positions
Put the pieces together and the two trades translate into a specific view.
The October $350 call is a near-term probe: cheap, short-dated, positioned to catch any pre-earnings move. The December $375 call is the main thesis bet: larger, longer, and built to capture a shift in the capex narrative rather than a single data point.
Once you understand what breakeven actually asks, the December target reframes the whole thesis. The $387.87 breakeven is not a modest bounce. It requires a 13% move in under three months, which is a meaningful ask given the structural headwinds still in place. The structure is consistent with hedged optimism, not conviction buying.
What would actually have to change for this recovery thesis to hold
This is a decision point, not a verdict. Several specific conditions would need to move before the recovery thesis becomes something you could underwrite with confidence.
- Free cash flow normalisation. With Q2 2026 FCF at roughly -$5.9 billion and FY2026 capex guided to $195-$205 billion, investors need a credible path back toward positive, growing free cash flow before the cash generation worry eases.
- Evidence of Gemini monetisation. The entire capex case rests on AI products eventually paying for the infrastructure. Traction has to become visible.
- A buyback signal. Roughly $69.5 billion of authorisation remains, so the capacity exists. A resumption, or even a clear signal of one, would restore a structural support the stock currently lacks.
The competitive picture complicates the monetisation leg directly. ChatGPT, Claude, Grok, and newer entrants such as Muse are all pulling at the same user base Gemini needs to win, and that pressure is real rather than theoretical.
Analyst conviction on GOOGL has not collapsed despite the negative FCF print: Phillip Securities upgraded the stock to BUY on 31 July 2026 while cutting its price target from $450 to $425, framing the move as a timing adjustment rather than a thesis reversal.
Public figures for Gemini user penetration and market share are not available in the sources reviewed. That absence is itself a meaningful data gap for anyone assessing the monetisation thesis.
Here is the core tension. The missing Gemini data is not a neutral blank; it means investors are being asked to underwrite a roughly $200 billion infrastructure commitment on faith in management’s execution rather than confirmed product traction. The December breakeven of $387.87, about 13% above the current price, crystallises the recovery ask into a single milestone, and the next earnings cycle is the moment the capex narrative could shift in either direction.
This article is for informational purposes only and should not be considered financial advice. Investors should conduct their own research and consult with financial professionals before making investment decisions. Past performance does not guarantee future results. Financial projections are subject to market conditions and various risk factors.
The capex bet still has to prove itself, and the market knows it
Three threads converge into one clear picture. Technically, GOOGL sits just above its 200-day moving average (around $338-$343) and about 15.8% below its $408.61 high. Structurally, the capital allocation shift, surging capex and a halted buyback, explains the underperformance. And in the options market, the $6.73 million positioning captures professional uncertainty without strong conviction.
The bull case is genuine and worth stating plainly. Revenue growth of 24% and cloud growth of 82% are real, the $69.5 billion buyback authorisation is intact, and that 200-day moving average could act as support if sentiment turns.
The December $375 call, expiring 18 December with runway beyond earnings, is built precisely to catch any thesis shift that emerges. But one quarter is unlikely to settle a $195-$205 billion capex question on its own.
The stock just above its 200-day line, paired with options that buy time rather than name a catalyst, tells you the market is in a wait-and-see posture. Not fleeing, not chasing. Watching for three things:
- A clear free cash flow trajectory
- Evidence that Gemini monetisation is gaining ground
- A signal on when buybacks return