The dollar keeps climbing, and you already know it. What you might not be able to put into words is why. The US Dollar Index is sitting near 101.5 as of 1 October 2026, headline inflation is running at 3.4%, and the market is now pricing in close to 100 basis points of additional Federal Reserve tightening over the next year.
Those three numbers are not a coincidence. They are a signal, and once you learn to read it, the dollar’s behaviour becomes far more legible than the daily headlines make it feel.
Currency moves are not random, and they are not driven by mood. US dollar strength follows a logic rooted in three measurable forces: interest rate differentials, relative growth, and the dollar’s structural role in global finance. The same forces have appeared in every major dollar rally over the past four decades, which is exactly why understanding the mechanism is worth more than reacting to any single data release.
Here is what you will walk away with. After this, you will be able to look at a Fed rate decision, a GDP print, or an inflation reading and connect it directly to its likely effect on the dollar, without needing a finance degree to make the link.
What the numbers are telling you right now
Start with the number everyone quotes but few interpret. The US Dollar Index (DXY), which measures the dollar against a basket of major currencies, is trading near 101.5-101.6 as of 1 October 2026, according to real-time quotes from Investing.com and Seeking Alpha. Think of that level as the market’s live verdict on how the US economy is doing relative to everyone else.
Right now, that verdict is firmly positive, and the growth data explains why.
The third and final estimate for US second-quarter real GDP was revised up to 2.2% on a seasonally adjusted annualised rate basis, with domestic demand driving the upgrade, according to analysis by Elias Haddad of Brown Brothers Harriman. The Atlanta Fed’s GDPNow model projects an even stronger 3.7% annualised pace for the third quarter. Real personal consumption climbed 0.6% month-over-month in August, up sharply from 0.1% in July.
The BEA third estimate for Q2 2026 GDP confirmed real output grew at a 2.2% seasonally adjusted annualised rate, with upward revisions to personal consumption providing the bulk of the upgrade and reinforcing the picture of an economy running ahead of expectations.
That is not an economy that is slowing. It is one that is accelerating.
Now layer in inflation. Headline Personal Consumption Expenditures (PCE) inflation, the Fed’s preferred measure of how fast prices are rising, held at 3.4% year-over-year in August, with core PCE (which strips out volatile food and energy) at 3.0%, both confirmed by the Bureau of Economic Analysis and the Dallas Fed.
Core PCE: 3.0% The Fed’s preferred inflation gauge remains a full 100 basis points above its 2% target, which is precisely why the market has not stopped expecting more tightening.
| Indicator | Value | Period | Implication for USD |
|---|---|---|---|
| DXY (US Dollar Index) | ~101.5-101.6 | 1 Oct 2026 | Near cyclical peak; broad USD strength |
| Q2 real GDP (final) | 2.2% SAAR | Q2 2026 | Solid growth supports the dollar |
| Atlanta Fed GDPNow | 3.7% | Q3 2026 | Accelerating growth; bullish |
| Headline PCE (YoY) | 3.4% | Aug 2026 | Above target; keeps Fed tight |
| Core PCE (YoY) | 3.0% | Aug 2026 | Sticky inflation; dollar-supportive |
| Market-implied rate increases | ~100 bps | Next 12 months | Expected tightening lifts USD now |
Read together, these figures tell you something specific. The dollar is not rising on sentiment or speculation. It is rising because the US economy is running hotter and tighter than markets expected, and the Fed’s response to that heat is what makes US assets more attractive to global capital.
When big ASX news breaks, our subscribers know first
The three forces that move the dollar
If you want a mental model you can reuse, here it is. Nearly every sustained dollar rally comes down to three interacting forces, and they compound rather than simply add up.
- Interest rate differentials: When US interest rates sit higher than those in other major economies, dollar-denominated assets pay more, pulling global capital toward the US and bidding up the currency.
- Growth exceptionalism: When the US expands faster than its peers, investors expect stronger corporate earnings and more resilient credit, drawing equity and bond inflows that support the dollar independent of rates alone.
- Structural reserve role: As the world’s dominant reserve and invoicing currency, the dollar attracts safe-haven demand during uncertainty and a baseline of structural buying that never fully switches off.
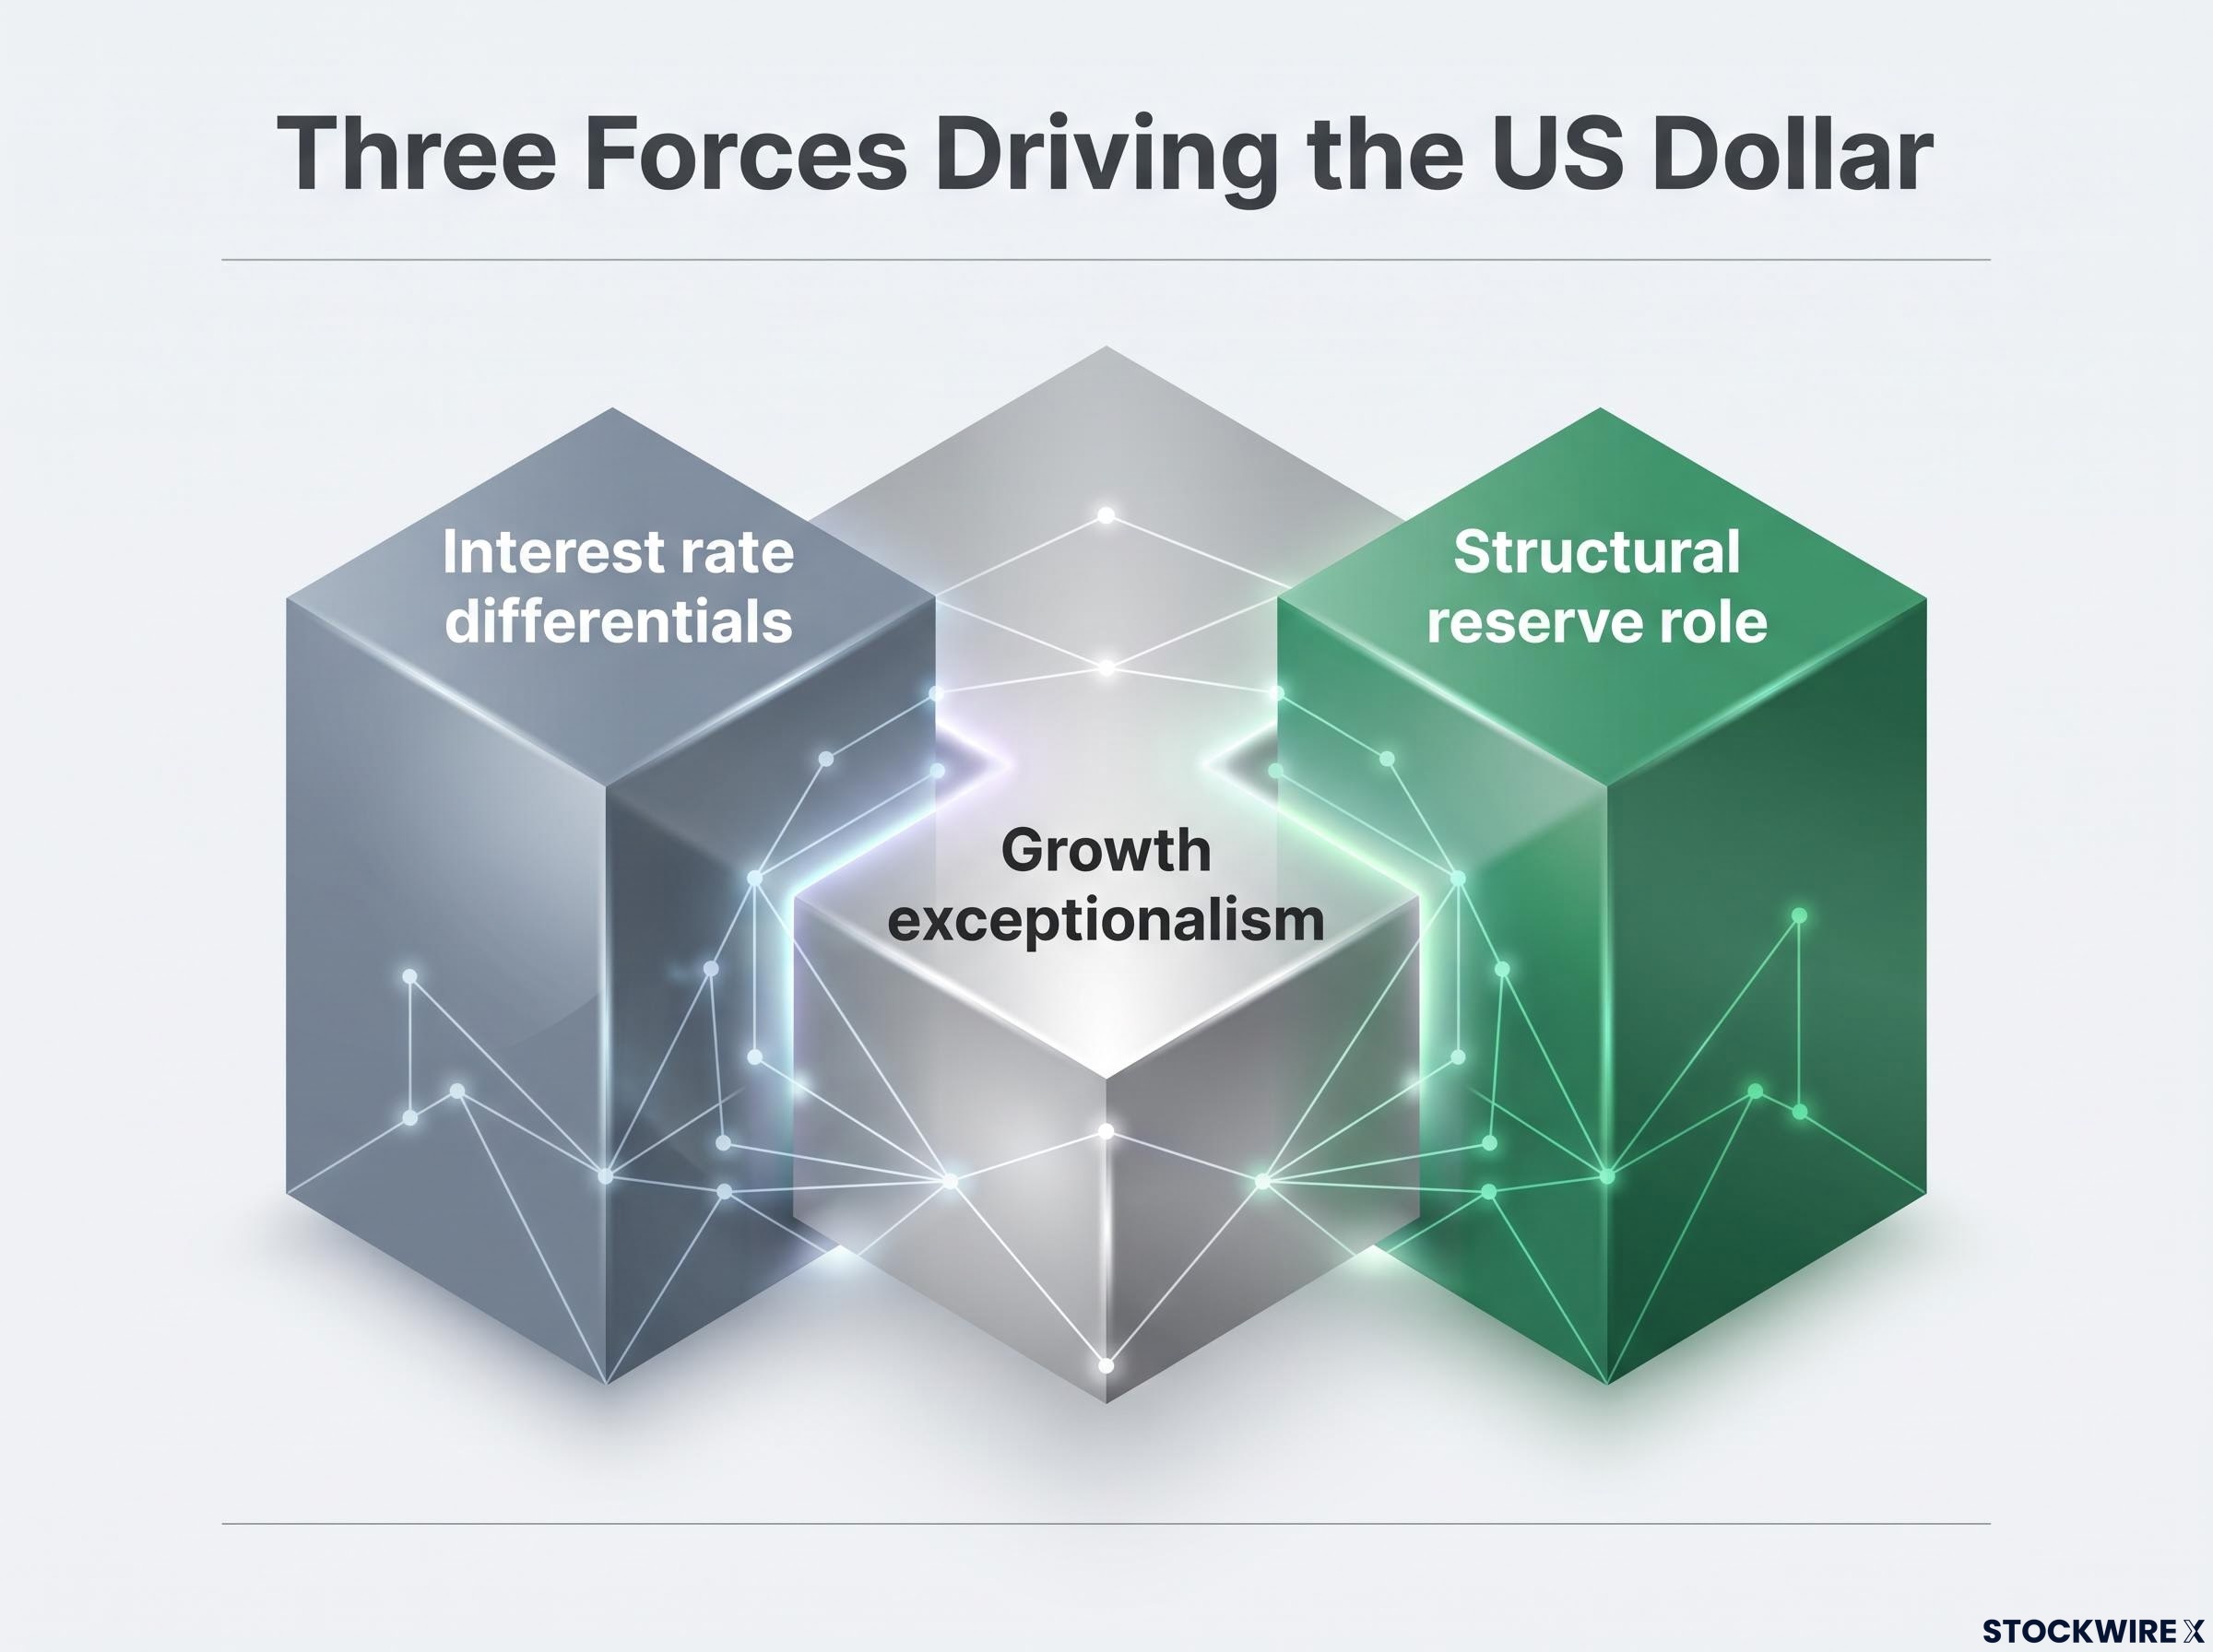
Start with the most intuitive. Widening interest rate differentials between the US and other major G6 economies are explicitly cited as a dollar driver in the Brown Brothers Harriman analysis. FX strategists at Goldman Sachs and JPMorgan described similar periods in 2022 and 2023 as “rate-differential driven,” because higher US yields increase the carry, the extra return, earned by holding dollars over lower-yielding currencies like the euro or yen.
Central bank divergence is the mechanism that converted the Fed-ECB rate gap into a 22% euro decline over seven months in 2014-2015, and the same forward-expectations channel, not the size of any individual decision, is what separates currency moves that last from those that reverse quickly.
The second force builds on the first. According to IMF analysis, when US growth outpaces other G7 economies, investors expect stronger earnings and more resilient credit, which reinforces inflows. The current data fits: resilient consumer activity, an improving labour market, and persistent inflation are all keeping the Fed tighter for longer than its peers.
The dollar’s structural role: a force that does not switch off
Here is where it gets less obvious but more durable. Rate differentials narrow whenever central banks converge. The dollar’s reserve currency status does not.
Research from the Bank for International Settlements (BIS) and the IMF shows the dollar remains the dominant reserve, invoicing, and funding currency, which creates a standing floor of demand that persists across every cycle. During stress, that role intensifies. BIS work on global dollar credit notes that a stronger dollar can tighten financial conditions worldwide, which itself pushes investors further into dollars during periods of fear.
Understanding all three together explains something the headlines rarely capture. The dollar can keep rising even when global risk appetite improves, because rate attraction and safe-haven demand are separate mechanisms. Right now, both point the same way.
Why the Fed’s expected path matters more than its current rate
Here is the shift in thinking that separates a casual reader from someone who actually understands currency markets. The dollar does not just respond to where rates are today. It responds to where investors believe rates will be twelve months from now.
That distinction matters more than it sounds.
The roughly 100 basis points of additional Fed tightening currently priced into markets, per the Brown Brothers Harriman analysis, is already doing work on the dollar today. The expectation alone makes dollar assets more attractive, because global investors position ahead of moves rather than waiting for them to happen. Not a single additional hike needs to occur for that anticipation to lift the currency.
The pace of Fed tightening shapes asset outcomes as much as the direction does: aggressive cycles have produced S&P 500 losses of roughly 6% while mild ones delivered gains as high as 18%, a spread that makes classifying the current cycle’s character a more actionable question than tracking its endpoint.
~100 basis points of expected tightening This is not just the current rate at work. The market’s expectation of where the Fed is heading is a live force sustaining the dollar’s present level.
What keeps that expectation alive is inflation. With headline PCE at 3.4% and core PCE at 3.0%, both sitting above the Fed’s 2% target, there is little reason for markets to price in early rate cuts. Add in real consumer spending accelerating to 0.6% month-over-month in August from 0.1% in July, and you have an economy showing no sign of the demand slowdown that would push the Fed toward easing.
For you, this reframes what to watch. The Fed’s scheduled meetings matter less than the data that arrives before them, because that upstream data is what shifts rate expectations in real time. Three figures do most of the moving:
- PCE inflation: The closer it drifts toward 2%, the weaker the case for further tightening, and the less support the dollar gets.
- Real consumer spending: Resilient spending keeps the Fed cautious; a sharp slowdown opens the door to cuts.
- GDP growth: Strong growth sustains the higher-for-longer narrative; a meaningful deceleration undermines it.
Track those, and you will often see the dollar’s direction forming before the Fed says a word.
How past dollar cycles ended, and what that means for this one
Every sustained dollar rally in living memory has eventually reversed. Not because the data lied, but because the forces driving the rally shifted. Treating history as a pattern-recognition exercise, rather than a lecture, is the honest way to think about whether today’s strength lasts.
The most structurally comparable precedent is the 2014-2015 Fed normalisation cycle. Expectations that the Fed would lift rates off near-zero, combined with widening yield differentials and stronger relative US growth, drove a substantial dollar rally against the euro and yen. The appreciation slowed once normalisation was underway and other central banks began adjusting.
The extreme case sits further back. During the early 1980s Volcker disinflation, very high nominal rates drew capital into the US and produced a powerful dollar surge, one strong enough that it eventually required coordinated international action, the 1985 Plaza Accord, to reverse. That episode shows how far appreciation can overshoot before policy intervenes.
Then there is the cautionary tale. The 1994-1995 tightening cycle saw aggressive Fed hikes strengthen the dollar and contribute to emerging-market stress, including financial strain in Mexico, according to BIS and academic studies. It illustrates how US dollar strength can export tight financial conditions abroad and eventually create feedback risks.
| Historical Cycle | Primary Driver | What Ended It |
|---|---|---|
| Early 1980s (Volcker) | Very high nominal rates drawing in capital | Coordinated policy action (1985 Plaza Accord) |
| 1994-1995 | Aggressive Fed hikes, rising yields | EM stress and eventual Fed pause |
| 2014-2015 | Fed lift-off expectations, growth gap | Other central banks adjusting, divergence slowing |
What the current cycle shares with its predecessors, and where it diverges
Today’s rally shares the rate-differential and growth-exceptionalism drivers with the 2014-2015 cycle. The key difference is the backdrop.
This time the tightening is more globally synchronised. Other major central banks are also raising rates, which limits how far the US can diverge from its peers, and divergence is historically what narrows most quickly. That matters for timing, because reversals have tended to coincide with rate differentials narrowing rather than with the Fed simply beginning to cut.
There is also a longer-run wrinkle. The US fiscal deficit and a negative net international investment position are structural vulnerabilities that featured less prominently in earlier cycles, according to IMF commentary. They are not immediate catalysts, but they are worth keeping on your radar.
The signal to watch, then, is not the first Fed cut. It is any sign that European or other central bank tightening is accelerating relative to the Fed, because that is what closes the differential.
Where the risks to continued dollar strength sit
A one-sided view of the dollar leads to over-exposed or under-hedged decisions. So here is the honest accounting of what could interrupt the rally, grouped into three distinct categories.
- Cyclical risk (rate convergence): FX strategists at HSBC and BNP Paribas have argued the dollar is close to or past its cyclical peak. Once the Fed nears the end of tightening and other central banks catch up, the rate differential narrows and the primary driver of this rally fades.
- Structural risk (fiscal and external position): The US fiscal deficit and negative net international investment position are longer-term vulnerabilities, per IMF and academic commentary, that could deepen any reversal if global investors start demanding higher risk premiums on US assets.
- Global feedback risk (EM stress and trade): A stronger dollar raises the local-currency cost of dollar-denominated emerging-market debt and can tighten global financial conditions, creating feedback effects that eventually loop back into US growth.
US fiscal vulnerabilities have grown more concrete in 2026: federal debt has crossed $40 trillion, supplemental Pentagon spending tied to the Iran conflict has pushed deficit projections toward 8% of GDP, and 30-year Treasury yields are climbing toward 5.3%, giving the structural risks flagged by IMF commentary a live market expression.
That last category deserves the most attention right now.
The most immediate global transmission risk IMF Global Financial Stability Reports warn that a stronger dollar raises the debt-service burden on emerging markets with large unhedged dollar liabilities, while BIS research notes it can reduce their access to rollover funding, sometimes forcing pro-cyclical tightening or triggering crises.
There is a domestic cost too. Federal Reserve and BEA-linked analysis has long noted that a stronger dollar makes US exports pricier and imports cheaper, which can widen the trade deficit and weigh on manufacturing and export-heavy sectors. If that pressure eventually moderates US growth, it could shift the Fed’s own calculus.
The honest take is this. The dollar’s current strength is well-founded in the data, but the same data defines the conditions that would reverse it. Watch PCE drifting toward 2%, watch rate differentials narrowing, and watch for emerging-market stress signals as the early indicators that the cycle is turning.
Reading the dollar with the right tools
The lasting value here is not the October 2026 snapshot. It is the framework, because once you understand the three forces and the data that moves them, every future Fed meeting, GDP release, and inflation print becomes easier to place in context.
Your ongoing lens stays simple: rate differentials, growth exceptionalism, and the dollar’s structural reserve role. When all three point the same way, as they do now, the dollar tends to stay strong. When one softens, you know exactly where to look.
To track how the current conditions evolve, monitor four signals:
- PCE inflation: Currently 3.4% headline and 3.0% core. A sustained move toward 2% weakens the case for tightening and the dollar.
- Fed rate-path expectations: Currently around 100 basis points of implied tightening. A sharp drop in that pricing signals fading support.
- US GDP versus peers: With Q3 GDPNow at 3.7%, meaningful deceleration relative to other G7 economies would narrow the growth gap.
- EM stress and policy divergence: Signs that other central banks are tightening faster than the Fed are what history shows closes the differential.
You cannot know when the rally ends. But you can now identify the conditions that would signal a change, and that is a materially stronger position than guessing.
This article is for informational purposes only and should not be considered financial advice. Investors should conduct their own research and consult with financial professionals before making investment decisions. Past performance does not guarantee future results, and financial projections are subject to market conditions and various risk factors.