


Technology stocks now account for somewhere between 37.9% and 39.9% of the S&P 500 by market-cap weight, depending on which index provider you trust. If that figure does not concern you, it may be because the last decade has trained investors to treat concentration as a feature rather than a flaw.
One school of economic thought reads that concentration very differently. It argues the dominance of tech is not evidence of durable value creation but the late stage of a credit-fuelled boom that has been running since 2009. If that diagnosis holds, the investors who have ridden the rally without questioning the forces beneath it may be positioned for a decade of near-zero real returns at precisely the wrong moment. The commodity complex, meanwhile, has spent 10 to 20 years near multi-decade lows relative to equities, building what valuation-focused analysts describe as a mathematical case for mean reversion.
This piece lays out the Austrian economic argument for why the gap between commodities vs tech stocks exists, what conditions would close it, how mainstream strategists read the same data, and what a practically minded investor might actually do about it. After reading, you will have a framework to judge whether the rotation thesis holds for your own situation, including how to think about debt when inflation is in play.
A 16-year boom built on borrowed conditions
Start with the interpretive lens, because the data means very different things depending on which one you use. According to Dr. Mark Thornton of the Mises Institute, the current U.S. expansion is being held aloft by Federal Reserve policy and federal deficit spending rather than organic productivity alone.
Austrian business cycle theory, the framework Thornton works within, holds that when a central bank suppresses interest rates and expands credit beyond the level of real savings in the economy, it channels capital into new technologies and industries that would not otherwise attract it. The boom that follows is real while it lasts. The theory’s claim is simply that it carries the seeds of its own correction.
The debt dimension of the tech boom has intensified since 2024, when the AI build-out shifted from cash-funded to debt-funded: hyperscaler bond issuance exceeded $100 billion in one recent six-month period, and Goldman Sachs estimates close to $500 billion in AI-related debt issuance in 2026 alone, making the AI debt boom directly interest-rate sensitive in a way the sector was not two years ago.
The Austrian view treats the boom and the bust as two halves of a single sequence: credit expansion past the point of real savings produces an investment surge that must eventually unwind.
Trace the current equity boom back and you land around 2009, in the wreckage of the 2008 financial crisis. That makes it roughly 16 years old as of late 2026, built on a long stretch of artificially low rates and expanding credit rather than productivity growth alone.
The historical parallels are what give the argument its weight. The booms of the 1920s and the 1960s both featured rising equity markets, very low unemployment, and surface-level strength that masked structural imbalances underneath. Both ended badly for investors who mistook the surface for the foundation.
There is a further wrinkle that should trouble anyone who leans Keynesian. Mainstream Keynesian theory holds that deficit spending belongs in recessions and should be offset by surpluses during growth. That is not happening. Deficits are expanding alongside positive GDP growth, which suggests the distortion runs deeper than monetary policy on its own.
Here is why the mechanism matters to you. If the boom were built on fundamentals, the case for rotating out of concentrated tech exposure would be weak, and recent returns would be a reasonable guide to future ones. If it was manufactured by policy, the expected payoff for holding the index at today’s concentration is not what the last decade suggests.
When big ASX news breaks, our subscribers know first
What the valuation gap between commodities and tech actually shows
Set the theory aside and look at what the numbers describe on their own. The concentration is not subtle, and neither is the valuation gap sitting next to it.
The Information Technology sector alone is reported at 37.9% of the S&P 500 by S&P Dow Jones Indices, with independent trackers placing it slightly higher: 38.26% at US500 and 39.9% by Chartrow’s estimate. Add Communication Services at roughly 9.5%, which houses the large digital-platform names, and the tech-adjacent weight climbs toward 47% to 50% once the platform components of Consumer Discretionary are counted.

| Sector | Approximate Weight | Notes |
|---|---|---|
| Information Technology | 37.9% to 39.9% | Range reflects differing index-provider methodologies; roughly 75 constituent companies |
| Communication Services | ~9.5% | Houses major digital-platform names, adding meaningful tech exposure |
| Consumer Discretionary | ~9.1% | Includes tech-platform components that lift effective tech weight |
| Financials | Second-largest sector | Part of the top-three cluster making up ~61% combined |
| Energy, Materials, Real Estate | Low single digits each | Among the smallest index weightings; the real-asset side of the ledger |
The top three sectors combined, Technology, Financials, and Communication Services, make up roughly 61% of the entire index. What that means in practice is uncomfortable: a 47% to 50% effective weight in tech-adjacent sectors makes your passive U.S. equity exposure a concentrated bet on a single sector thesis, whether you chose that bet consciously or inherited it by buying the index.
Index fund concentration is more extreme than sector-weight figures suggest: five mega-cap stocks controlled approximately 23% of the broad U.S. market as of mid-April 2026, a level that has surpassed the 1930s historical peak, and the cap-weighted S&P 500 returned 86% over three years versus 43% for its equal-weighted version, with the entire performance gap driven by valuation expansion rather than superior earnings growth.
Now look at the other side. Commodity indices, precious metals, oil, and energy equities have delivered below-average returns for the prior 10 to 20 years, both against broad equities and against their own long-term histories.
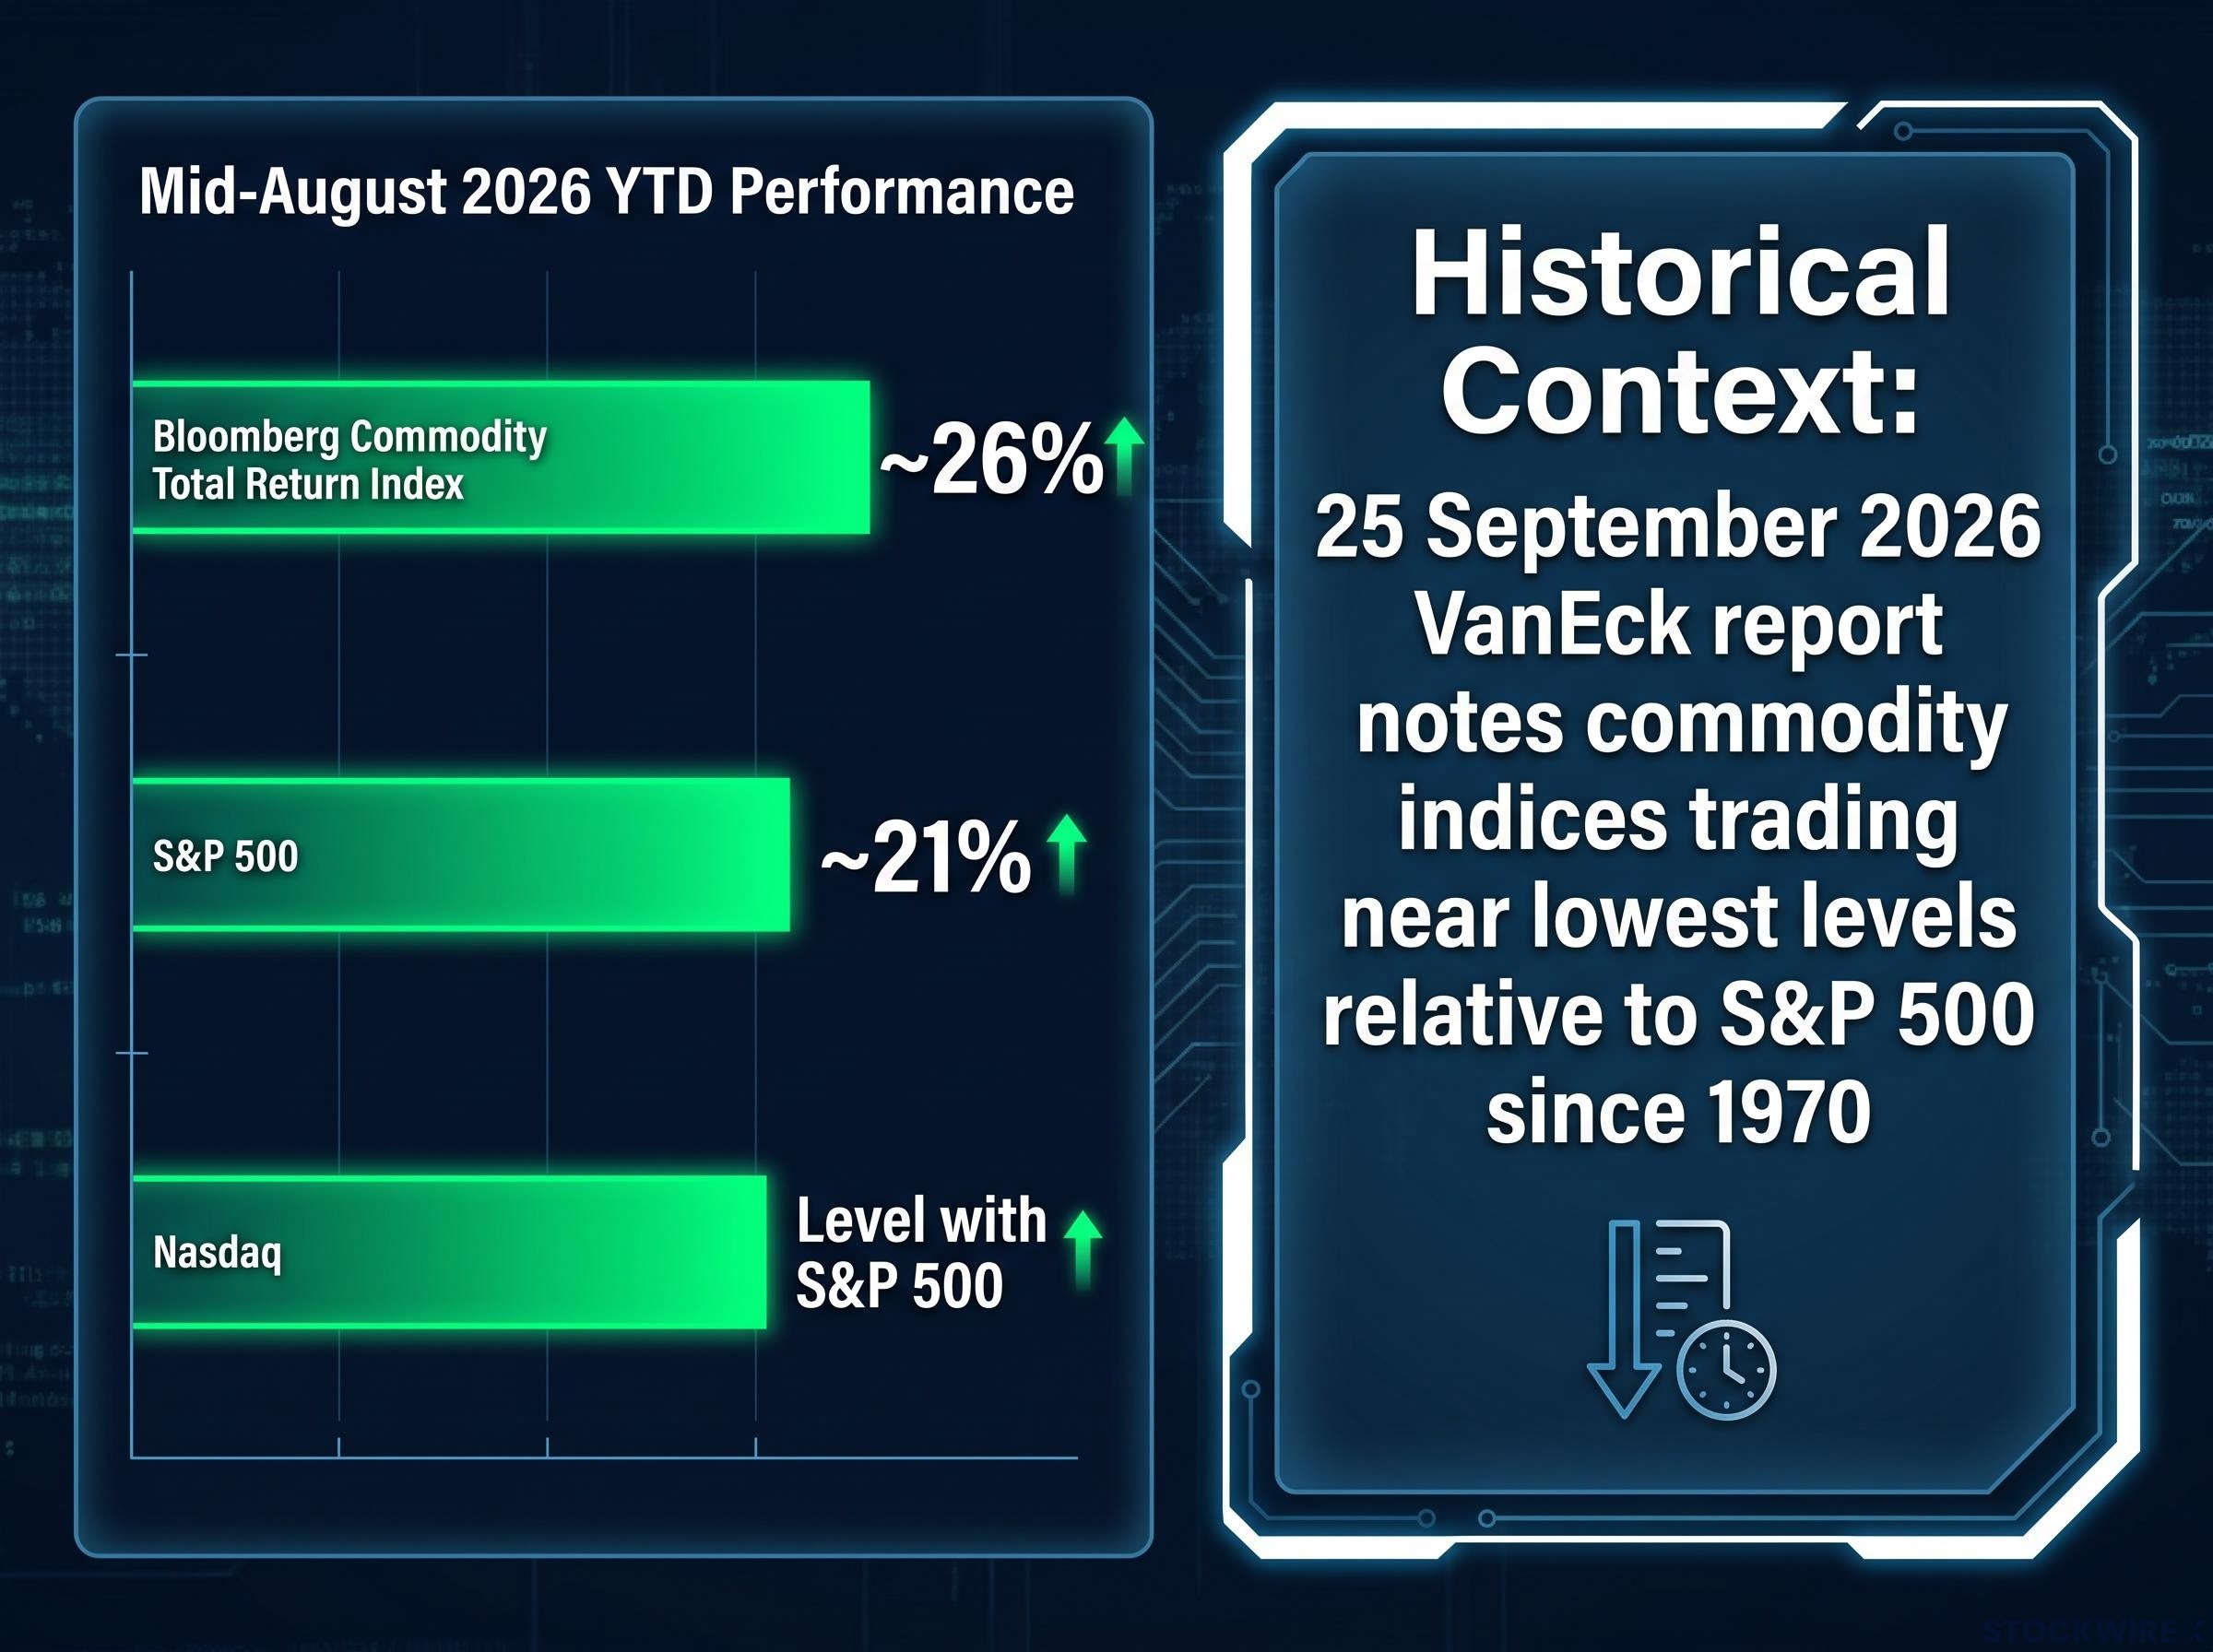
According to a report from VanEck dated 25 September 2026, both the S&P GSCI and the Bloomberg Commodity Index are trading near their lowest levels relative to the S&P 500 since 1970.
That is more than five decades of relative underperformance. The mean-reversion logic follows from the arithmetic: when an asset class has lagged for that long, the base for above-average future returns grows, assuming historical ratios eventually normalise. That is a conditional, not a certainty, and it is worth holding it loosely.
Short-term momentum has already begun to shift, which is where the structural picture gets interesting. As of mid-August 2026, the Bloomberg Commodity Total Return Index was up roughly 26% year-to-date, ahead of the S&P 500 at approximately 21% and level with the Nasdaq. The structural valuations remain extreme even as the recent tape has started to move. Whether that is the beginning of the reversion or another false start is the question the next section turns to.
What it would take to close the gap, and what could keep it open
The honest answer is that both outcomes are plausible, and which one wins depends on which structural forces dominate. Hold the tension rather than reaching for a tidy conclusion, because the data supports genuine disagreement.
The case for commodities gaining ground
Austrian and mainstream analysts converge on three conditions that would need to hold for a sustained rotation into real assets.
- Persistent inflation and deficits. Continued deficit spending, borrowing, and money creation are structural rather than cyclical forces, and they tend to support commodity and real-asset prices over time.
- Resource scarcity. Saxo Markets, writing in August 2026, points to broadening scarcity themes: structural underinvestment in resource extraction, demand from the energy transition, and geopolitical constraints on supply.
- Valuation compression in technology. Any meaningful rise in interest rates, a liquidity squeeze, or a run of earnings disappointments could reprice growth stocks and shift index weights toward real assets.
What makes these catalysts notable is that scarcity and deficit dynamics are structural, not the usual short cyclical swing. Structural forces have more staying power, which is the strongest argument the rotation case has.
Institutional commodities allocation has moved from tactical to structural: Societe Generale lifted its commodities exposure from 5% to 20% of a model portfolio in a single step on 18 June 2026, citing electrification, AI infrastructure demand, defence spending, and reshoring as policy-locked, multi-year consumption drivers rather than cyclical price signals.
Why the trade has disappointed before and could again
The counterarguments deserve equal weight, because dismissing them is how macro rotation trades go wrong.
- Roll-yield risk. Morgan Stanley Investment Management warns that broad commodity futures indices are not market-cap weighted and rely on proprietary schemes, which can produce unintended sector concentration and outcome profiles that resemble leveraged trading rather than a clean inflation hedge. Roll costs can quietly erode returns.
- Demand-side weakness. Bloomberg explicitly cites a deflating China as a headwind. Soft demand in a major consuming economy can cap prices regardless of how tight supply becomes.
- Extended relative cheapness. The fact that commodities sit at their lowest relative level versus the S&P 500 since 1970 is itself proof that the mean-reversion call has been premature or wrong for decades. Cheap assets can stay cheap for a long time.
- Volatility and cyclicality. Commodities swing hard with the business cycle and geopolitics, which means real drawdown risk.
The short-term record reinforces the caution. In one recent quarter, the Bloomberg Commodity Spot Index gained roughly 1% while the S&P 500 delivered around 10% in total return, a reminder that the structural thesis and the quarterly tape can point in opposite directions.
Where does that leave you. The valuation case for commodities is genuinely strong, but timing is unknowable. That reframes the decision. The question is not whether to rotate but how much exposure makes sense given your own time horizon and tolerance for volatility.
Building a practical response without betting the portfolio on a macro call
Analysis is only useful if you can act on it, so this is where the thesis becomes a set of decisions. Two broad approaches exist, and they differ mainly in conviction and sizing.
The mainstream approach treats commodities as a diversifier and inflation hedge, not a replacement for equities. It keeps core U.S. equity exposure intact, adds a modest sleeve, and rebalances periodically to avoid chasing whichever asset class ran last. VanEck groups broad commodities, energy equities, materials, natural-resource producers, and precious metals into a single real-asset sleeve meant to act as a valuation-driven complement.
The Austrian approach goes further, expecting tangible assets to outperform financial and technology assets over the long term under persistent inflation and rising deficits. The Mises Institute framework identifies precious metals as the most practical starting point for individual investors, followed by shares in commodity producers, copper, nickel, and energy, as accessible proxies.
That second point matters for execution. Most individuals cannot store bulk industrial commodities, so commodity producer equities become the realistic vehicle for gaining exposure to copper, nickel, and energy without a warehouse.
| Approach | Core Thesis | Asset Vehicles | Sizing Guidance |
|---|---|---|---|
| Mainstream Diversification | Commodities as inflation hedge and diversifier, not an equity replacement | Broad commodity and real-asset sleeve; periodic rebalancing | Single-digit to low-double-digit allocation alongside core equities |
| Austrian Tangible Asset | Tangible assets expected to outperform financial and tech assets long term | Precious metals first, then commodity producer equities (copper, nickel, energy) | Meaningful overweight to real assets relative to the index |
Debt belongs in this conversation, because an inflationary environment changes the maths on your balance sheet.
High-interest consumer debt, such as credit card balances, should be cleared first, because inflation does not erode its real cost. Fixed-rate mortgage debt is a different category entirely: inflation organically depreciates its real value over time, which makes aggressive paydown less urgent as a strategic priority.
That distinction matters to you directly. Your fixed-rate mortgage is quietly getting cheaper in real terms every year inflation runs, which changes whether paying it down aggressively should compete with building commodity exposure for your available capital.
The inflation wealth transfer mechanism explains why fixed-rate mortgage holders benefit while nominal savers are systematically disadvantaged: since 1940, cumulative U.S. inflation has reached approximately 2,200%, eroding roughly 96 cents of every dollar held in nominal savings while reducing the government’s real debt burden by the same proportion.
A practical sequence looks like this:
- Assess the current tech concentration already sitting in your portfolio.
- Clear high-interest consumer debt before adding any new positions.
- Establish a real-asset sleeve, starting with precious metals and commodity producer equities.
- Size it against your time horizon and risk tolerance, with single-digit to low-double-digit allocation a defensible starting range.
- Set a rebalancing schedule so you are not chasing momentum in either direction.
Even if the Austrian framing leaves you unconvinced, the diversification and debt logic stands on its own.
Where the weight of evidence points for the next decade
Pull the threads together and the picture is coherent, if uncomfortable. A 16-year policy-driven equity boom has concentrated the S&P 500 into a single sector thesis at the very moment real assets sit at their lowest relative levels since 1970.
The uncertainty is irreducible, and pretending otherwise would be dishonest. The relative-valuation trap is real, timing is genuinely unknowable, and the Austrian framework has been directionally right before while being wrong on when.
Dr. Mark Thornton frames the projected 10-year forward return on the S&P 500 as mathematically close to zero, on the logic that the prior decade so far exceeded long-term historical averages that reversion is overdue.
The asymmetry is what makes this worth taking seriously even for a sceptic. If the rotation never comes, a modest real-asset allocation costs you some upside in a continued tech rally. If it does come, the investor with no commodity exposure is sitting in an index with near-zero projected returns and nothing to offset it. That trade-off, not the macro theory, is the practical reason to look hard at your own concentration.
This article is for informational purposes only and should not be considered financial advice. Investors should conduct their own research and consult with financial professionals before making investment decisions. Past performance does not guarantee future results, and financial projections are subject to market conditions and various risk factors. These statements are speculative and subject to change based on market developments.






