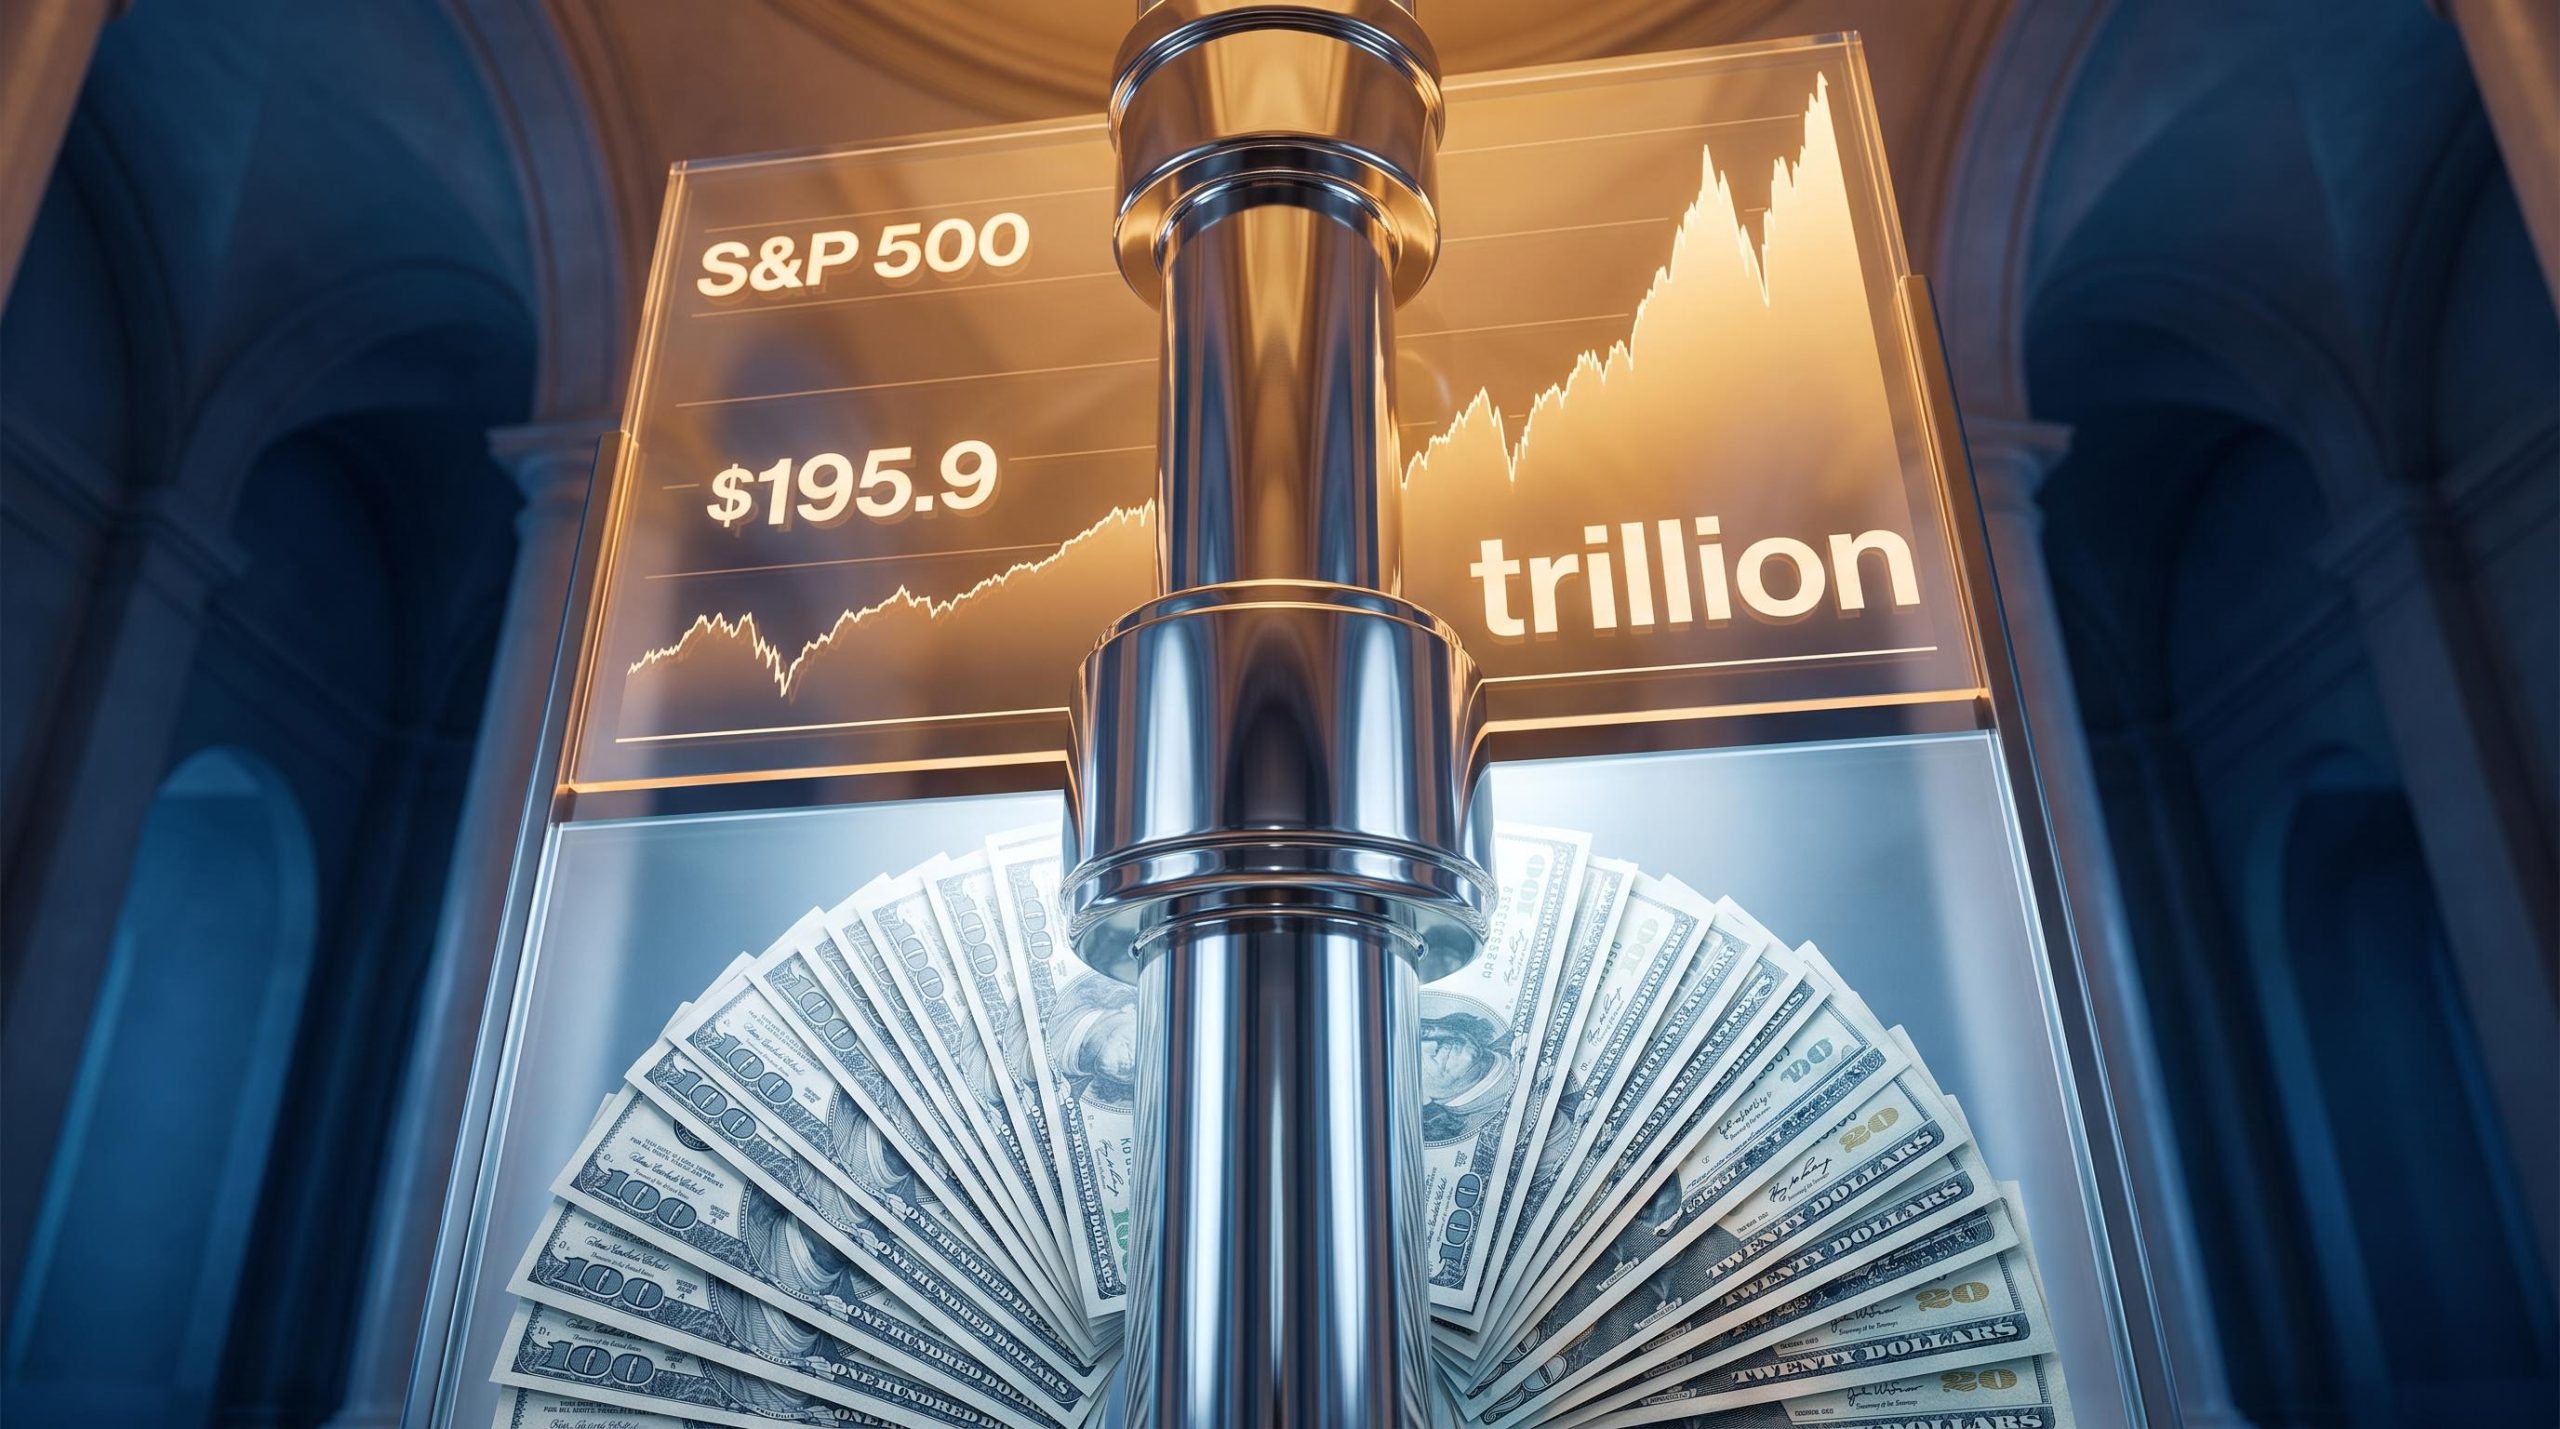
For years, the US Dollar and the S&P 500 lived in separate conversations. One belonged to macro desks tracking rates and trade balances; the other belonged to equity investors watching earnings. Commerzbank’s FX research is now arguing that the two have quietly become the same story, and that a sustained Wall Street selloff could be among the most direct threats to dollar demand.
That connection matters right now. The US Dollar Index (DXY), which measures the dollar against a basket of major currencies, is trading just above 101 as of late September 2026, held up in part by near-term factors: expectations of a Federal Reserve rate hike in October and Middle East tensions feeding safe-haven demand.
Those are real supports. But they sit on top of a deeper structural shift, and understanding it changes what you should be watching. After reading this, you will understand the specific mechanism linking your stock portfolio’s performance to the strength of the currency in your wallet, and why that connection is newer and more fragile than most people assume.
What the DXY chart is not telling you right now
On the surface, the dollar looks steady. The DXY sat at 101.0960 on 28 September 2026 according to TradingEconomics, with CNBC quoting 101.197 and Investing.com showing a 101.21-101.28 range on the same day. Commerzbank expects the index to revisit its yearly high near 101.806. Broad gains across major pairs reinforce the picture of strength.
Over the seven days ending 29 September 2026, the USD posted these advances:
- Approximately 1.82% versus the Australian Dollar
- Approximately 1.47% versus the Swiss Franc
- Approximately 1.06% versus the Canadian Dollar
- Approximately 0.94% versus the British Pound
- Approximately 0.90% versus the Euro
That is a clean sweep, and the near-term drivers are easy to name. Heightened Fed rate-hike expectations for October keep dollar assets attractive on a yield basis, while unresolved Middle East tensions push nervous capital toward the traditional safe haven. Both are genuine. Neither explains where the dollar’s structural support actually comes from anymore.
This is where Commerzbank FX strategist Volkmar Baur reframes the picture. His argument is that the marginal source of dollar support has migrated from bond inflows to equity-related capital inflows, which makes the currency far more exposed to a stock market downturn than older frameworks would predict.
The dollar’s global dominance, rooted in its role on one side of 89.2% of all FX trades and roughly 57% of global official reserves, is the structural backdrop against which this equity-inflow rotation plays out; the currency’s operational grip on global transactions makes shifts in how that inflow is sourced far more consequential than they would be for any other currency.
“Capital inflows, and thus support for the US dollar, will be more heavily dependent on the performance of the US economy and, consequently, the US stock market.”
The read you should take is this: the DXY above 101 looks healthy, but the foundations underneath the number have changed. A stable headline and a stable structure are not the same thing, and treating them as identical is how you misread the dollar’s actual risk profile.
When big ASX news breaks, our subscribers know first
How $195.9 trillion in household wealth became a currency problem
To see why the dollar is now an equity story, you have to follow the money through several links. Each one is simple on its own. Together, they explain why a stock market correction is no longer just a portfolio event.
The current account gap that equities are now filling
Start with a structural fact. The US runs a current account deficit of roughly 3% of GDP, which means the country buys more from the rest of the world than it sells. That gap has to be financed by foreign capital flowing in, every quarter, without exception.
Historically, that financing came mostly from bonds. Foreign central banks and sovereign wealth funds bought US Treasuries, providing a steady, relatively predictable stream of dollar demand.
According to Commerzbank’s analysis, the marginal source has rotated. Foreign investors are increasingly financing the deficit by buying US stocks rather than bonds. That rotation matters because equity investors behave differently: they chase performance and react sharply to risk sentiment, making their inflows episodic and reversible rather than steady.
Foreign demand for Treasuries has been eroding through a separate but related channel: Goldman Sachs documented that during the March 2026 Iran escalation, foreign official institutions sold rather than bought Treasuries into the stress, inverting the traditional safe-haven pattern and compounding the structural shift away from bond-financed deficit coverage that Commerzbank’s analysis describes.
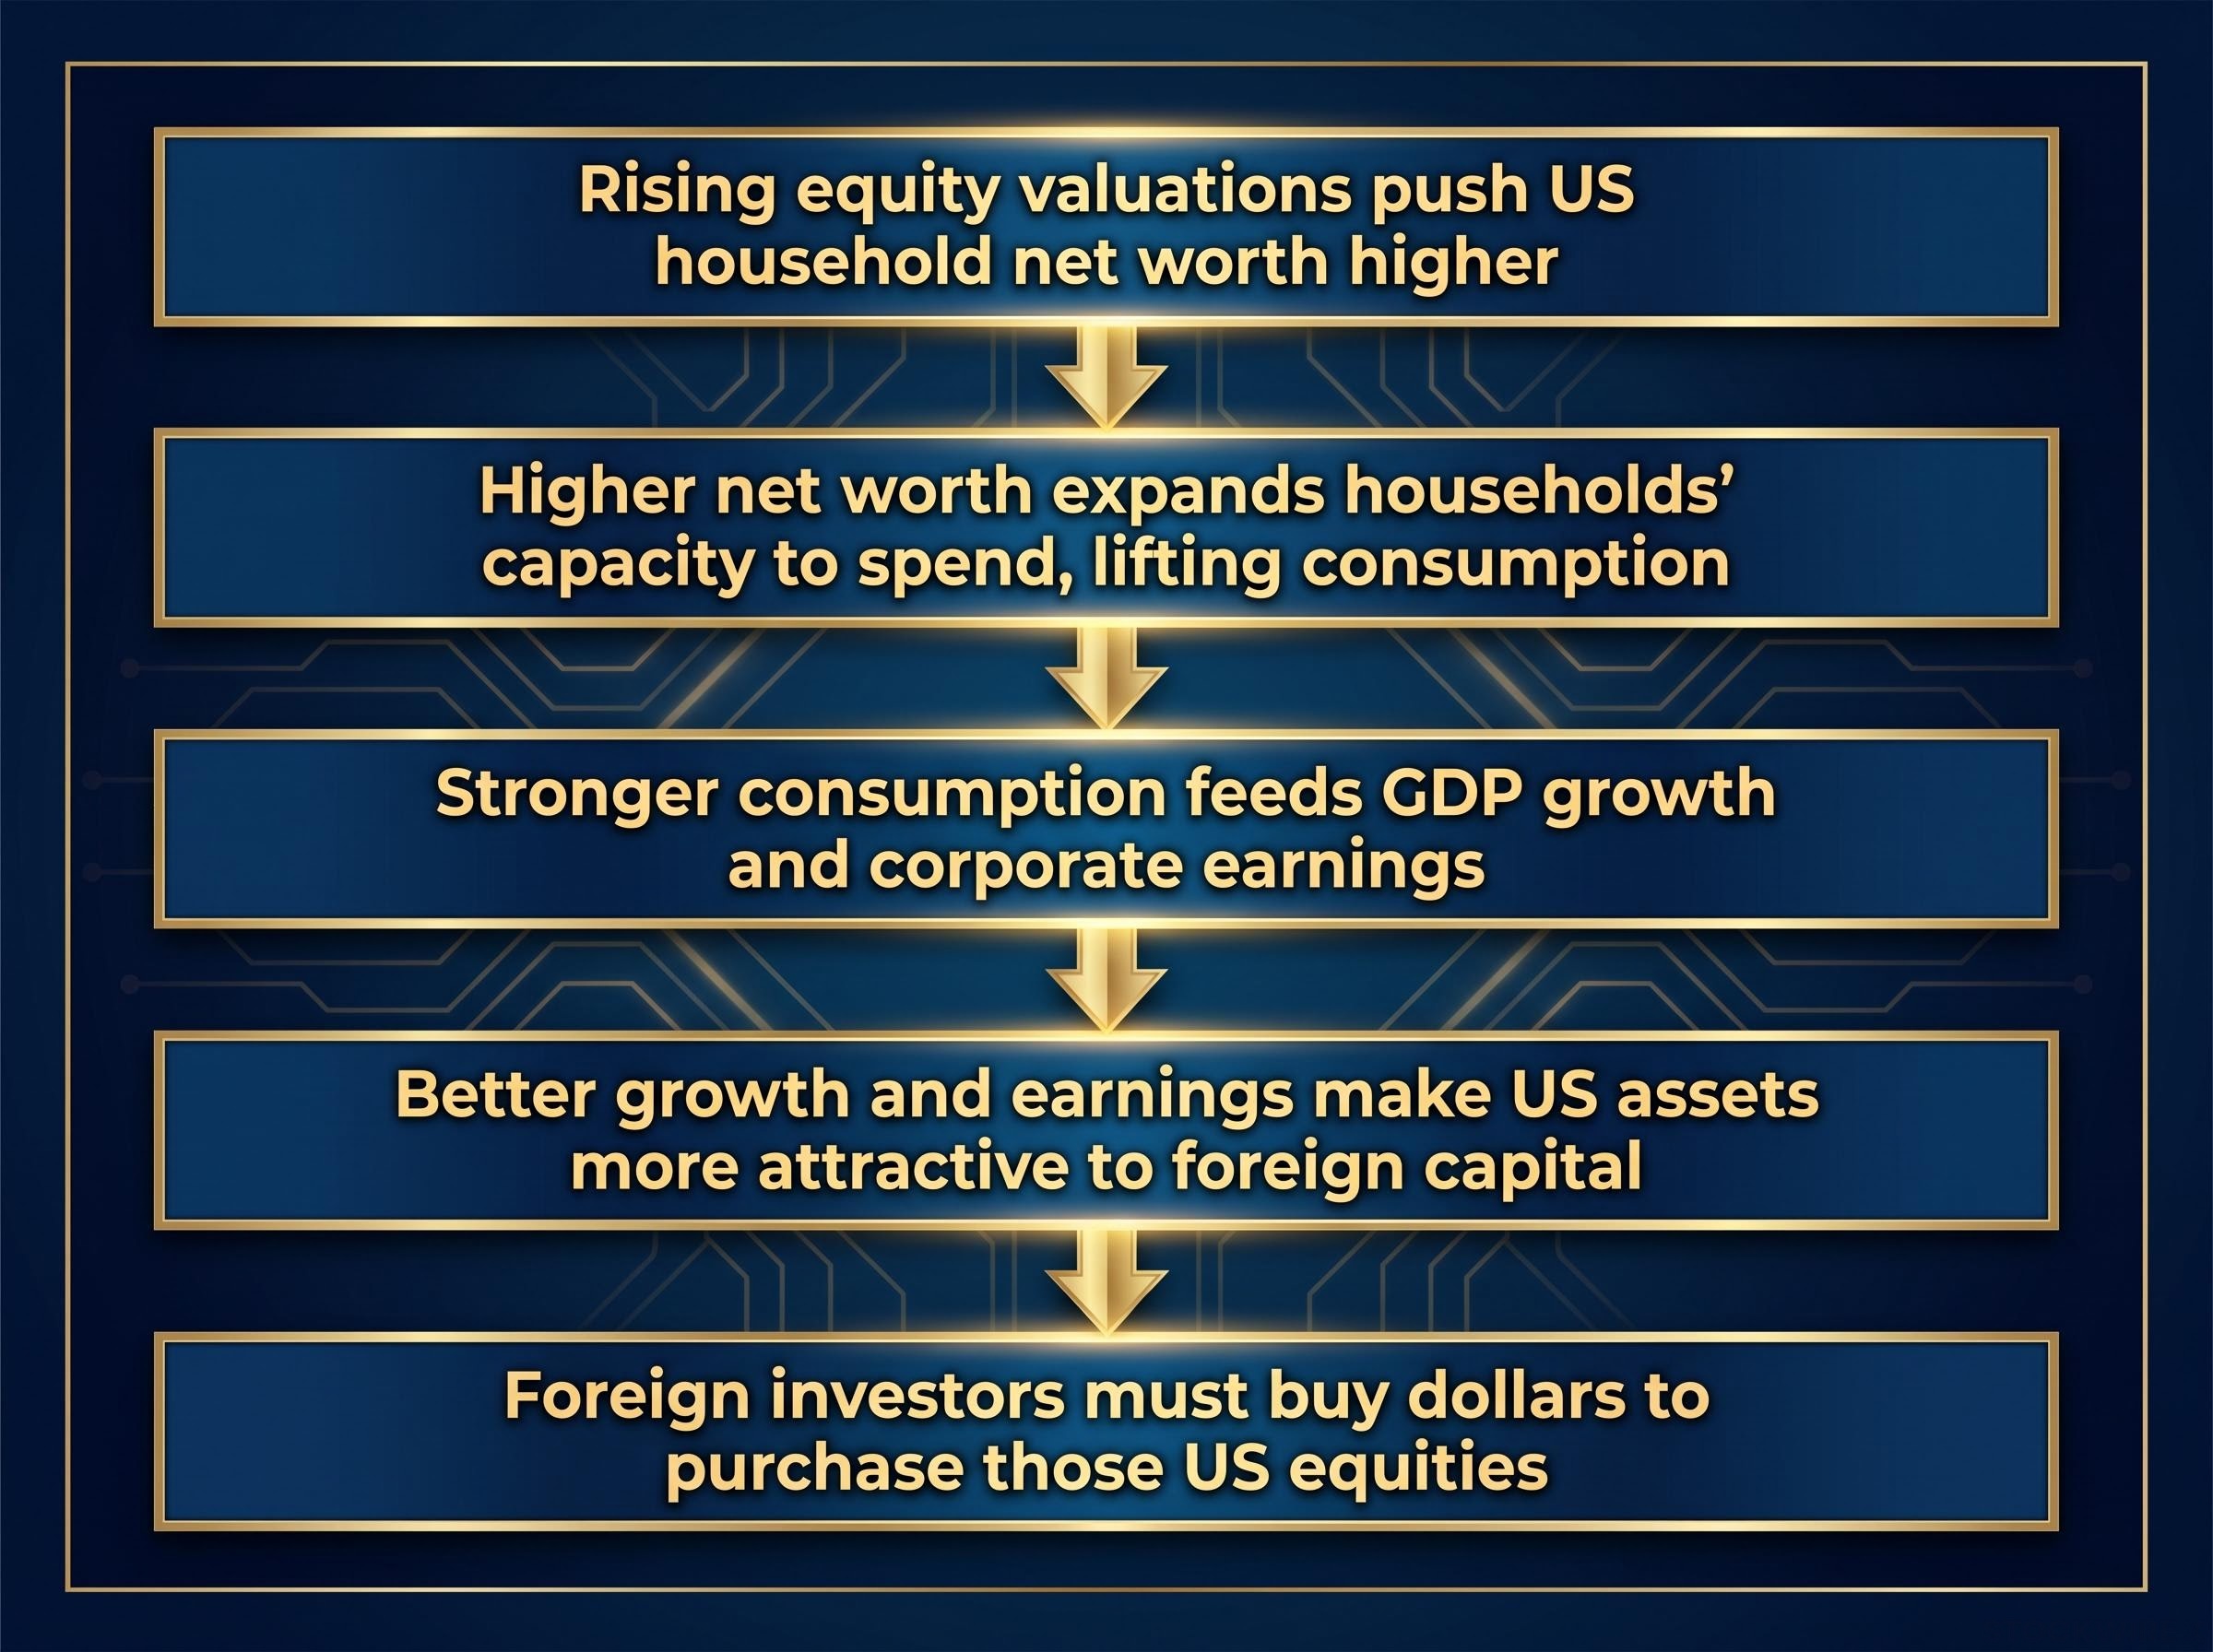
The five-link chain from stock prices to dollar demand
Here is the mechanism, step by step:
- Rising equity valuations push US household net worth higher.
- Higher net worth expands households’ capacity to spend, lifting consumption.
- Stronger consumption feeds GDP growth and corporate earnings.
- Better growth and earnings make US assets more attractive to foreign capital.
- Foreign investors must buy dollars to purchase those US equities, generating direct USD demand.
The scale of link one is what makes this urgent. The Federal Reserve’s Z.1 Financial Accounts, updated 11 September 2026, put the numbers on the table.
| Metric | Value | Period | Significance |
|---|---|---|---|
| Household and nonprofit net worth | $195.9 trillion | Q2 2026 | The wealth base attracting foreign capital |
| Quarterly increase | $12.8 trillion | Q2 2026 | Driven primarily by capital gains on corporate equity |
| Net-worth-to-income ratio | 8.28 (record) | Q2 2026 | Highest tethering of spending power to markets on record |
That record ratio of 8.28 is the number to sit with. It tells you US household spending power is now more tied to what the stock market does than at any prior point in the data series. The same equity gains propping up consumer confidence are also the primary magnet for the foreign capital holding the dollar up. Two parts of your financial life that most commentary treats as separate are now running on the same engine.
Why this makes the dollar more fragile than the bond era did
Understanding the mechanism is one thing. Feeling its risk profile is another. The feature that makes this system work so smoothly in an expansion is precisely what makes it dangerous in a correction.
The problem starts with the nature of equity flows. Baur characterises them as “far more volatile” than bond flows, which means dollar support is now far more sensitive to shifts in market sentiment and risk appetite than it was in the bond-dominated era.
“Far more volatile.”
That is the phrase to hold against the memory of how bond inflows used to behave: slow, institutional, and comparatively indifferent to a bad week on Wall Street.
Then there is the pro-cyclicality problem. In an expansion, rising equities and a rising dollar reinforce each other, feeding the boom. In a downturn, the same linkage runs in reverse, and it does so on two fronts at once.
Fiscal-driven yield erosion has created a second layer of pressure on the dollar that operates independently of the equity channel: Scotiabank’s modelling links the current deficit-to-GDP ratio to approximately 4% dollar depreciation by end-2026, a trajectory that would compound any equity-inflow reversal rather than offset it.
Consider the three risk dimensions that could activate together in a sharp selloff:
- Equity inflow reversal: Foreign investors pull money out of US stocks, cutting the capital-account support that finances the deficit.
- Household wealth compression: Falling equities erase household net worth, weakening the consumption and growth story that made US assets attractive in the first place.
- Current account financing fragility: The roughly 3% of GDP deficit still needs external financing even in a downturn, exactly when both bond and equity inflows may be retreating.
To grasp the potential scale, look back at the $12.8 trillion that household net worth gained in a single quarter. A mechanism capable of adding that much in three months is equally capable of reversing hard when sentiment turns.
For you, this means the dollar’s current resilience is not a sign of structural strength in the traditional sense. It is a sign of equity market momentum. The two can, and historically do, diverge violently when the mood changes, and that carries real consequences if you hold US assets, travel, or have any cross-border financial exposure.
When the correlation breaks: what history says about safe-haven dollars
Before you treat the equity-dollar link as an iron law, history offers a useful correction. The relationship is regime-specific, not permanent, and knowing when it breaks is as valuable as knowing when it holds.
Three past episodes show the range of behaviour.
| Episode | Equity market direction | USD direction | Dominant driver |
|---|---|---|---|
| COVID-19 crash (2020) | Sharp decline | Stronger | Safe-haven and dollar-liquidity demand |
| Fed tightening cycle (2022) | Volatile, weak | Stronger | Rate differentials and risk aversion |
| Post-pandemic tech rally | Strong gains | Resilient | Foreign equity inflows into US growth stocks |
The 2020 crash is the clearest counter-example. US equities collapsed, yet the dollar strengthened as investors scrambled for dollar liquidity and safe-haven protection. The equity-inflow dynamic was completely overridden by crisis mechanics.
The 2022 tightening cycle tells a different but equally instructive story. Equities were weak and volatile, but the dollar rose anyway, driven by widening interest-rate differentials as the Fed hiked aggressively. Here, monetary policy dominated the equity signal.
The post-pandemic tech rally is the episode that actually resembles today. Foreign capital chased US growth and technology stocks, and dollar resilience tracked that global bid, which is precisely the dynamic Commerzbank describes now.
The distinction is about which regime is active. The positive equity-dollar correlation tends to hold when equity-inflow dominance, a large deficit, and moderate rate differentials define the environment. It breaks when acute stress hands control to safe-haven and funding-currency mechanics instead.
The practical takeaway is that the correlation between your equity portfolio and the dollar is real but conditional. Baur’s warning is about this specific regime, not a universal rule. Knowing which regime is running at any given moment is the skill that separates informed currency watchers from those relying on a single relationship.
Reading the dollar through an equity lens going forward
The core shift is straightforward once you see it. The dollar’s direction is now more legible through equity market indicators than through the traditional rate-differential or trade-balance lens alone. When US stocks lead the world, foreign inflows follow, and the dollar tends to hold.
That gives you a concrete monitoring framework rather than a source of anxiety. Three signals are worth tracking:
- US equity relative performance: How US indices perform against global peers, since outperformance is what drives the foreign inflow that supports the dollar.
- Federal Reserve Z.1 net worth data: The quarterly household net worth figures (currently $195.9 trillion, ratio at a record 8.28) as lagging confirmation that the wealth-effect engine is still running.
- Foreign portfolio flow reports: The most direct measure of the capital-account dynamic Commerzbank is describing.
The late-September 2026 environment is a moment where multiple supports are stacked at once: the DXY above 101 with a Commerzbank target near 101.806, record household net worth, elevated Fed rate-hike expectations for October, and Middle East tensions adding a safe-haven overlay. That stacking makes the underlying equity vulnerability less visible, but it does not make it absent.
The practical implication for you is that your equity portfolio and your currency exposure are no longer as separable as conventional personal finance thinking assumes. Watching the dollar now means watching the same performance metrics you already track for your stock holdings.
For readers wanting to understand how the equity-inflow vulnerability fits within the broader long-run dollar risk picture, our full explainer on de-dollarisation risk covers central bank reserve allocation shifts, hedge fund Treasury exposure, and the fiscal trajectory projections that frame whether current dollar dominance is structurally durable.
This article is for informational purposes only and should not be considered financial advice. Investors should conduct their own research and consult with financial professionals before making investment decisions. Past performance does not guarantee future results, and these statements are speculative and subject to change based on market developments.