Here is a scenario most intermediate options traders have lived through without understanding it. You place a well-built strangle, it makes money, and you conclude the strategy works. You place the same structure a few months later, it loses, and you blame your execution. The structure did not change. Implied volatility did.
That gap, between knowing a strategy and knowing when it has an edge, is the difference between traders who compound and traders who churn. Implied volatility is not just the input that prices your options. It is the environmental condition that decides which class of strategy has structural advantage before you ever choose a strike.
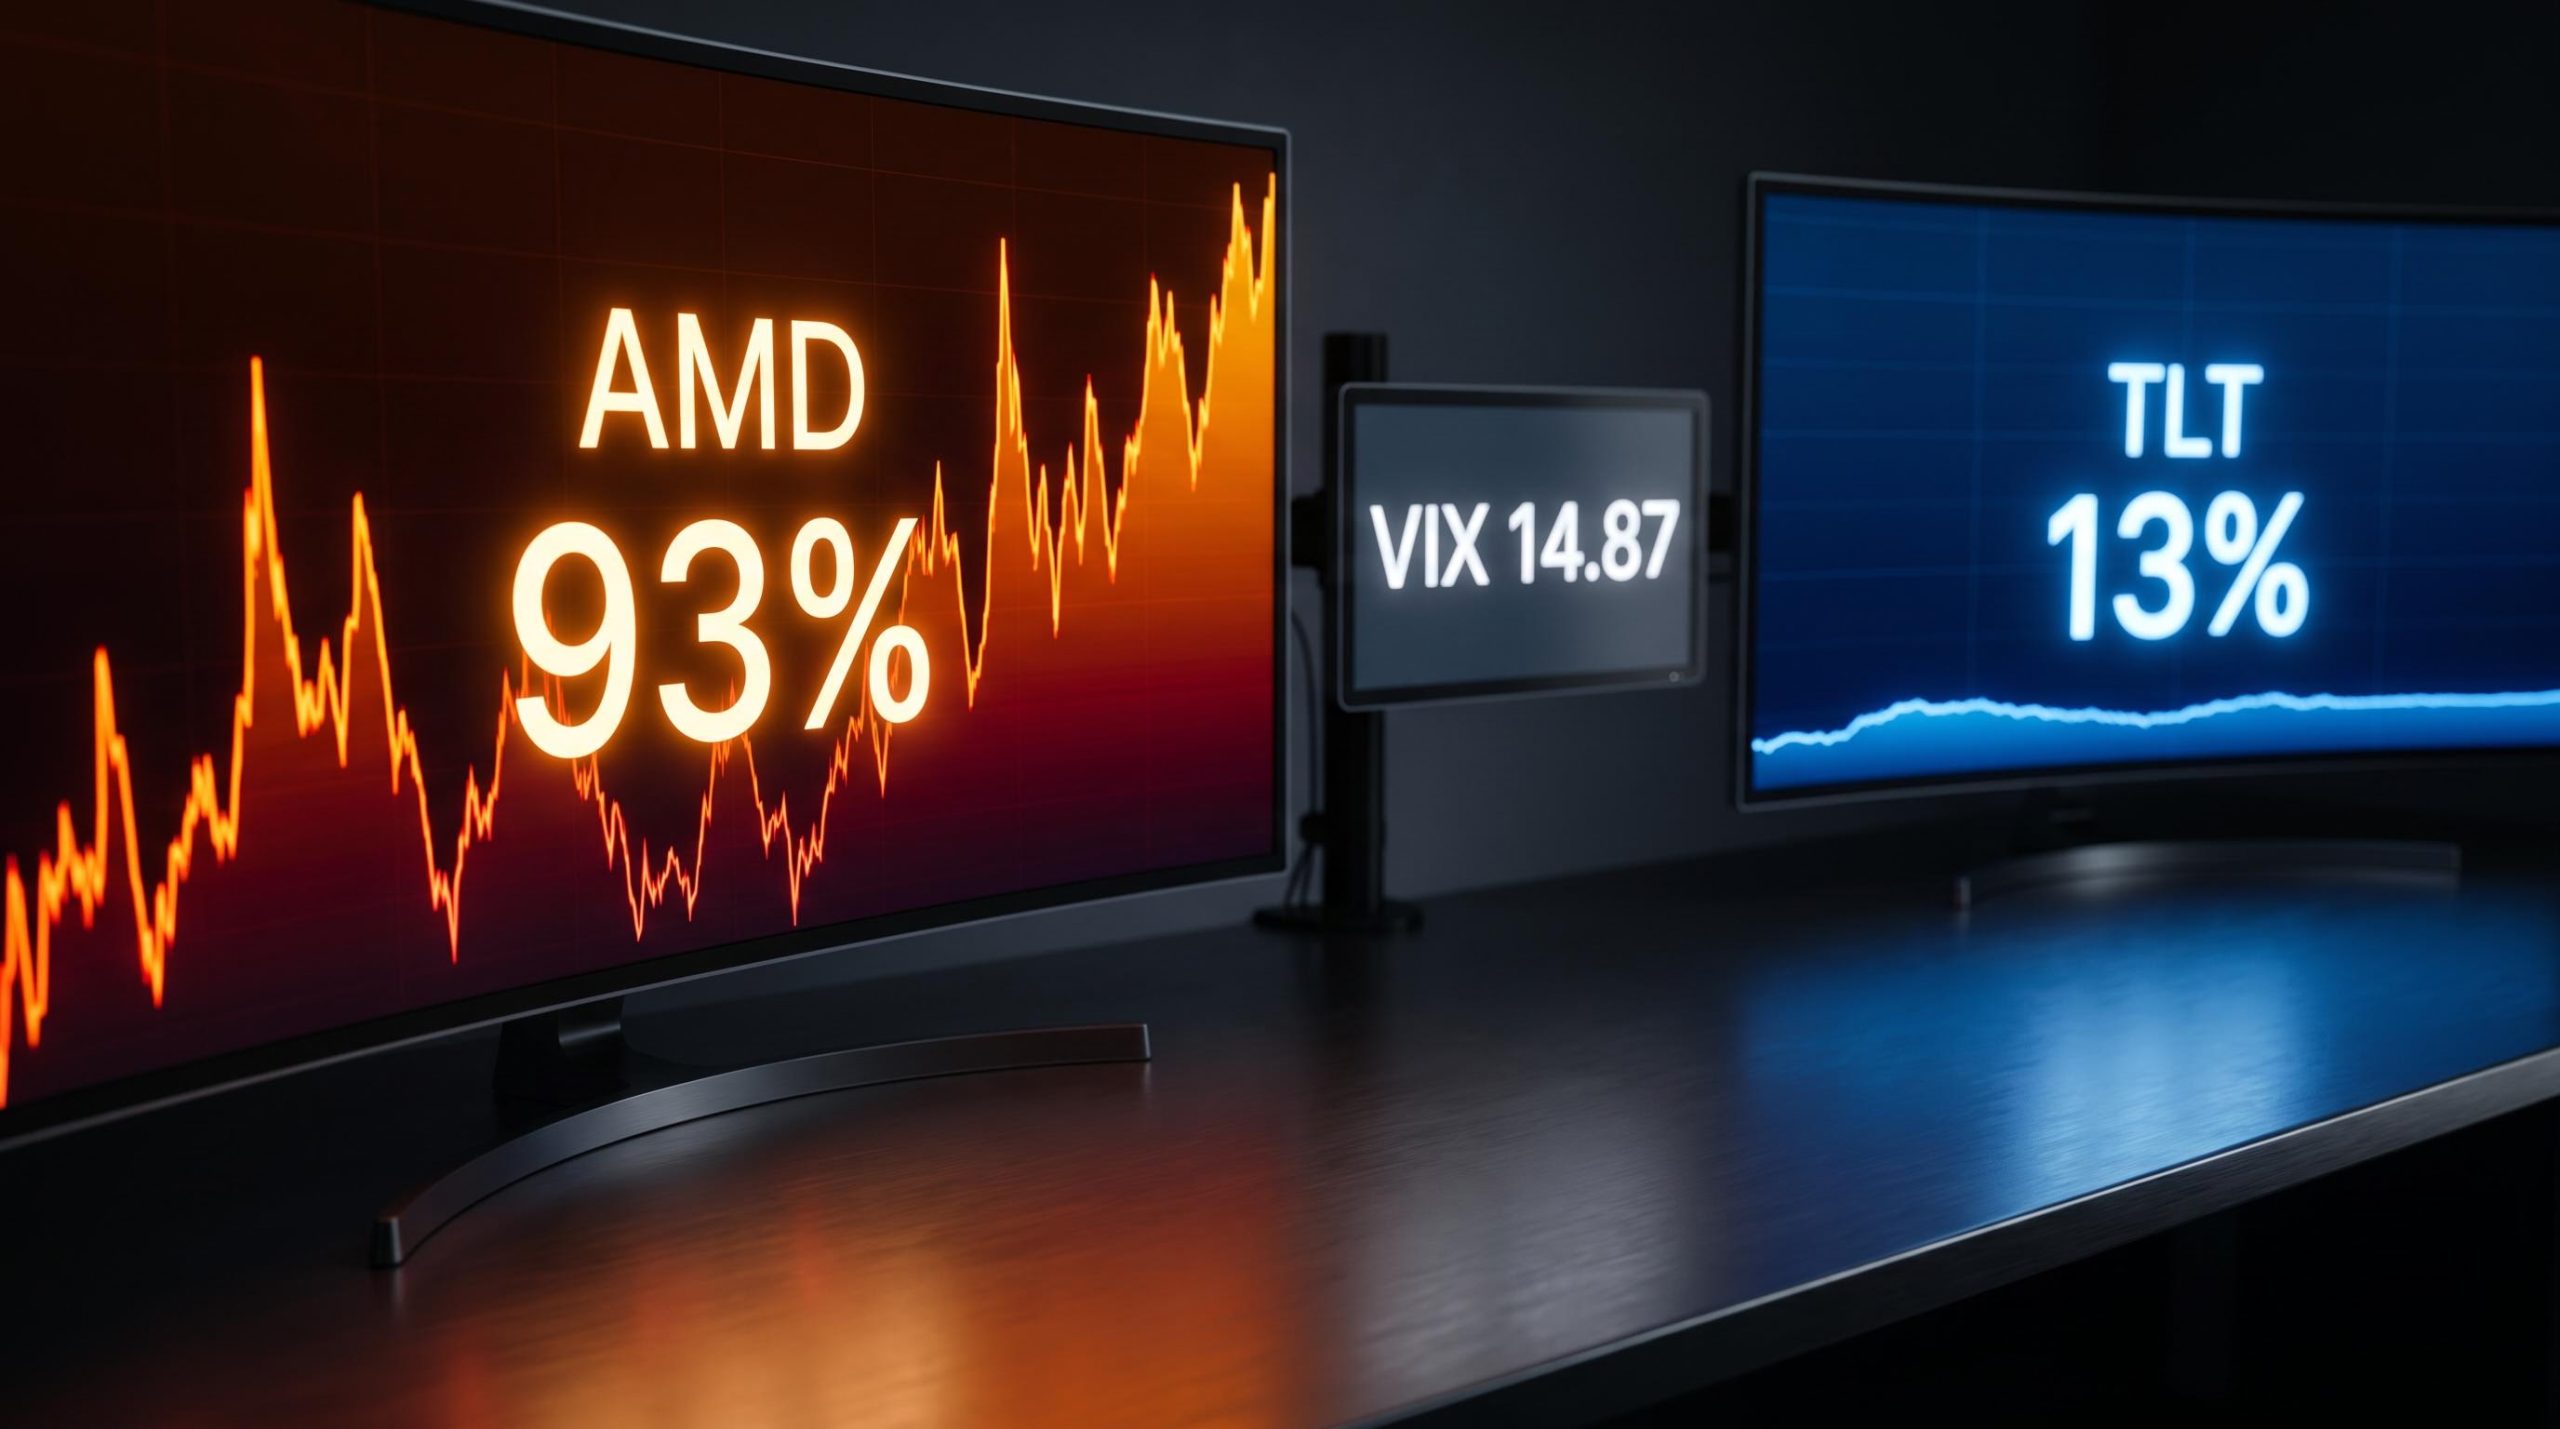
Consider the current picture. The VIX closed at 14.87 on 25 September 2026, according to Cboe data, which tells you broad-market premium is cheap. Yet individual names like AMD have traded near 93% implied volatility this year. One decision framework has to handle both realities at once.
What follows is the framework professional options traders use to answer the first question before they touch a strategy: not “which structure do I like?” but “what is volatility telling me to do?” Get the sequence right and an implied volatility options strategy stops being intuition and becomes a repeatable process you can apply to any asset, in any regime.
Why your IV chart matters more than your strategy choice
Most intermediate traders treat the strategy as the primary decision. They decide they like iron condors, or they favour long calls, and then they go hunting for a chart that fits. That is building the position backwards.
Implied volatility (IV) is the market’s consensus expectation of how much an asset will move, expressed as an annualised percentage. It directly sets the price of every option on that asset. When IV is high, options are expensive. When IV is low, they are cheap. That single number is the upstream decision that makes every downstream choice either sensible or self-defeating.
Every Greek and probability estimate your platform displays is a downstream output of implied volatility on any options chain, which means a shift in IV reprices delta, theta, and all probability percentages simultaneously, even when the underlying stock has not moved.
Here is the trap. The raw percentage, the absolute IV, means completely different things on different assets. An IV of 30% might be alarmingly high for a quiet bond fund and unremarkably low for a semiconductor stock. Reading absolute IV in isolation is like judging a temperature without knowing whether you are looking at a fridge or an oven.
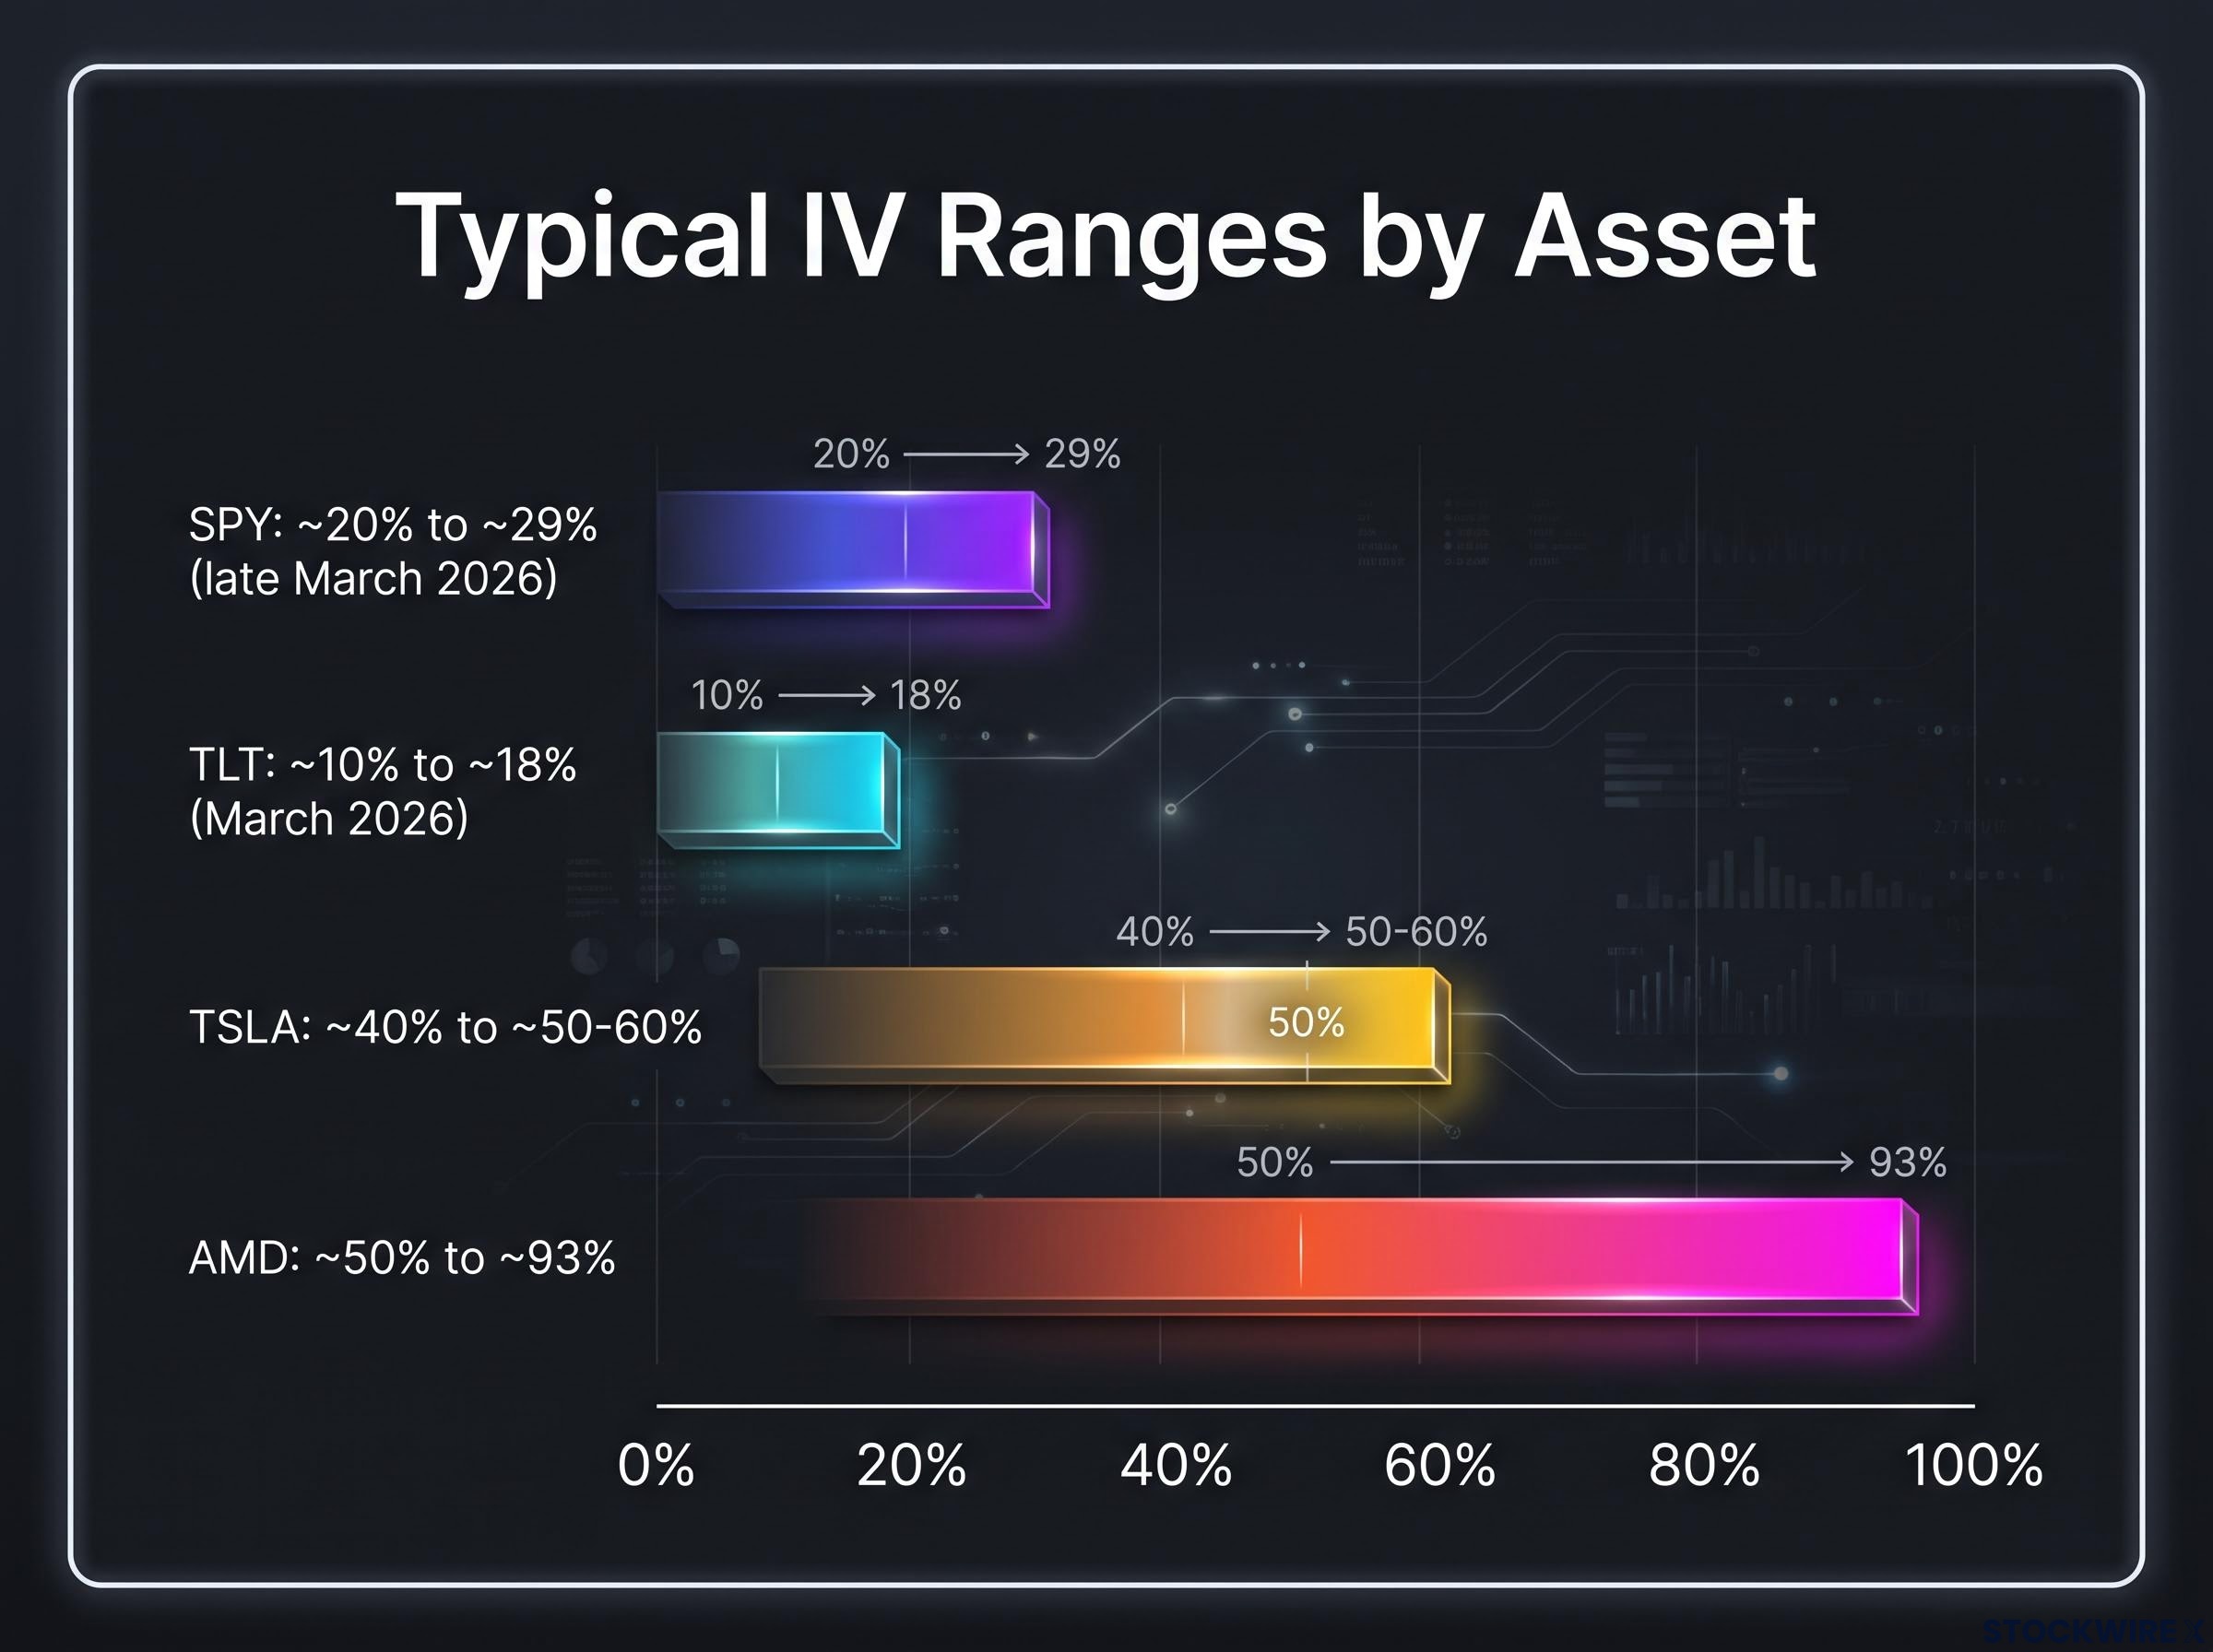
The scale of single-stock variability AMD has ranged from roughly 50% IV at its low to approximately 93% earlier this year, a swing of around 40 percentage points in one equity.
To see why a single threshold cannot work across assets, look at the spread of typical ranges.
| Asset | IV Range (Low) | IV Range (High) | Typical Character |
|---|---|---|---|
| SPY | ~20% | ~29% (late March 2026) | Broad market, tight range |
| TLT | ~10% | ~18% (March 2026) | Bonds, consistently quiet |
| TSLA | ~40% | ~50-60% | Volatile single stock |
| AMD | ~50% | ~93% | Extreme single-stock swings |
The lesson is direct. AMD at 50% IV is sitting near its calm floor, while TLT at that same reading would be an unprecedented event that has never happened. A single absolute threshold applied uniformly across assets is meaningless. Only the asset’s own historical range reveals whether current premium is genuinely rich or genuinely cheap.
Skip this step and you make the two most expensive mistakes in options: buying overpriced protection on calm assets, and selling risk too cheaply on volatile ones. Getting the read right is the prerequisite for everything else in this guide.
IV Rank and IV Percentile: which relative metric to use
This is why practitioners at educators like tastytrade and the Options Industry Council lean on relative metrics. IV Rank is the primary one. It measures where current IV sits between the asset’s 52-week high and low, on a normalised scale from 0 to 100.
An IV Rank of 80 tells you the current reading is near the top of the past year’s range, so premium is rich by that asset’s own standard. A rank of 20 tells you the opposite: premium is cheap and there may be little further to fall. That single number answers the question absolute IV cannot.
IV Percentile is the common alternative. It measures the percentage of days over the past year on which IV traded below the current level, which some practitioners prefer because it accounts for how much time IV actually spent at various levels rather than just the extremes.
Both share a caveat worth remembering. Relative metrics can mislead after a structural break, such as a new product cycle or a macro shock, and neither tells you the direction of the skew driving elevated IV. High IV from crash-protection buying is a different animal from high IV driven by upside speculation, and the numbers alone will not distinguish them.
When big ASX news breaks, our subscribers know first
When the math favors selling premium
Once you can read relative IV, the sell side of the framework follows logically. Selling premium is a bet on volatility mean reversion, the well-documented tendency of IV to drift back toward its long-run average after it spikes.
That mean-reversion is what makes the trade attractive, because it lets you harvest two things at once.
The core principle Selling elevated IV captures both theta decay (the erosion of an option’s value over time) and vega decay (the contraction of IV back toward its average) simultaneously.
For individual equities, tastytrade’s Options and Action framework points to an absolute IV of 40% or higher as the level where premium is generally rich enough to justify two-sided neutral strategies such as strangles and iron condors. The number is not arbitrary. Above 40%, the premium collected typically compensates you for the larger expected moves the market is pricing in, giving the seller a genuine cushion.
But the threshold is a starting condition, not a sufficient one. Absolute IV above 40% with a low IV Rank tells you the asset is simply a volatile name trading at its normal level, with no mean-reversion tailwind. You want both: high absolute IV and an elevated IV Rank.
Before selling premium, three conditions should line up:
- Absolute IV is at or above 40% for the individual equity
- IV Rank is elevated, ideally above 60, so mean reversion is a reasonable expectation
- No imminent binary event, such as earnings, that would keep IV artificially inflated
This is where AMD and TSLA earn their place. When AMD shows an IV Rank above 60 and absolute IV near 70%, that combination is your sell signal: premium is rich relative to recent history and likely to contract, giving strangles and condors a structural edge you simply cannot access elsewhere.
Contrast that with TLT at 13% IV or SPY in the mid-teens. Selling two-sided premium there is structurally disfavoured, because the premium is too thin to pay you for the directional risk you are taking on. The tastytrade platform’s 30-day cumulative IV line is a useful charting tool here, letting you visualise an asset’s historical IV range and estimate how low it might fall after a crush.
Understanding the mean-reversion logic behind the threshold keeps you from two errors: selling premium in low-IV environments where the risk-reward is inverted, and clinging to a position long after IV has already collapsed and the edge is gone.
What low implied volatility actually tells you about which structures to use
Here is the frame most traders get wrong. Low IV feels like a signal to sit out, to wait for volatility to return. It is not. It is a signal to change direction entirely, from selling premium to buying it.
The logic is about cost-effectiveness. When absolute IV sits below 20%, and especially below 15%, options carry very little extrinsic value, the portion of an option’s price that is not intrinsic worth. That makes debit strategies, where you pay a net premium to open the position, structurally attractive. You are buying directional exposure cheaply, and there is little IV left to contract against you.
Take TLT at 13% IV, priced around $80, with at-the-money options trading for less than $1.00. Paying under a dollar for directional exposure on an $80 product is objectively cheap relative to the bond market’s own historical volatility range. That is precisely when a long-dated debit structure earns its advantage: you own cheap optionality that stands to gain if volatility eventually expands.
Premium selling in low-IV ETFs breaks down structurally when the credit collected fails standard return-on-capital thresholds, and TLT at roughly 14% implied volatility illustrates the problem precisely: a sold ATM contract can generate as little as $1.46 against $1,500 in capital, making adjustments and rolls economically incoherent.
Several structures suit these conditions, each with its own best-fit scenario.
| Structure | Best IV Condition | Primary Driver of Profit | Key Risk |
|---|---|---|---|
| LEAPS | Very low IV, strong directional view | Price movement plus IV expansion | Chop or further IV contraction (theta decay) |
| Diagonal Spread | Near-term IV below long-term IV | Short-leg theta offsetting long vega | Sharp move against long leg, or near-term IV spike |
| Zebra Trade | Low IV, directional conviction | High delta with minimal extrinsic value | Adverse directional move |
| Vertical Spread | Low IV, defined-risk directional | Directional accuracy | Wrong direction, capped upside |
LEAPS (Long-Term Equity AnticiPation Securities) are long-dated options, typically 6 to 24 months out. They are the primary low-IV tool for a trader with multi-month conviction: cheap premium, a long runway, and the benefit of eventual IV expansion. They fail when the underlying chops sideways or IV contracts further, leaving you paying for time that decays without a compensating move.
Diagonal spreads sit one step up in complexity. You buy a dated long option and sell a near-dated one against it, generating theta income that partially offsets your long vega exposure. The condition for success is specific: near-term IV and realised volatility must be lower than long-term IV.
Zebra trades and calendars: advanced low-IV positioning
For traders wanting high directional exposure without overpaying, the Zebra trade (Zero Extrinsic Back Ratio) is a tastytrade-favoured vehicle. Mechanically, you buy two at-the-money calls and sell one in-the-money call, engineering a position with near-zero extrinsic value and a high delta close to that of the underlying stock itself. You get stock-like exposure while sidestepping the extrinsic cost that erodes ordinary long calls.
Calendar spreads express a different view entirely, one about the term structure of volatility rather than direction. You profit when near-term IV decays faster than longer-dated IV, which means you need a specific view on how volatility is distributed across time, not just an opinion on where the stock is heading.
Both structures share a failure mode. If near-term IV unexpectedly spikes, the term-structure relationship reverses and the position works against you. Traders who reflexively avoid options when IV is low are missing the very regimes where debit structures deliver the best cost basis. Low IV is not an absence of opportunity. It is a redirection.
The earnings cycle trap and when to break your own rules
You have the sell-high, buy-low framework. Now here is the zone where it stops applying, and where discipline means waiting rather than acting.
Earnings announcements inflate extrinsic value and IV in the weeks before the event. To a trader running the sell-premium checklist, an elevated IV reading looks like an invitation. It is not, and mistaking one for the other is among the costliest errors intermediate traders make.
The problem is timing. If you sell a two-sided neutral strategy 30 days before earnings, you carry directional risk with no corresponding high probability of profit, because the IV will not crush until the announcement actually lands. You are exposed to price swings without the volatility collapse that is supposed to pay you.
Consider Costco, whose IV stood at roughly 25% about 30 days before its 24 September earnings. A hypothetical 850-950 strike strangle placed at that point forces you to hold directional risk on both sides. Gains on one leg get offset by losses on the other, and there is no IV crush yet to bail you out.
The core rule Two-sided premium selling only earns its IV-crush edge when it is placed at or immediately around the announcement date, not in the weeks leading up to it.
There is a further danger. Post-earnings moves frequently exceed the market-implied move, creating gap risk that persists right up until the announcement. That elevated pre-earnings IV is not a sell signal. It is a waiting signal.
The discipline is a three-step sequence:
- Identify the exact earnings announcement date for the underlying
- Hold off on two-sided neutral strategies until the announcement day itself, capturing the immediate post-earnings IV collapse
- Size the post-earnings position smaller to account for residual gap risk
Recognising the earnings cycle as a separate regime within the broader framework protects both your capital and the statistical edge of a well-built premium-selling process. The normal rules are suspended here. Waiting is the trade.
What the August 2024 VIX spike teaches every premium trader about regime risk
Every framework meets its limit somewhere. For volatility traders, that limit arrived on 5 August 2024, and it is worth studying not as a scare story but as a calibration.
That day, the VIX recorded its largest single-day spike in history, surging roughly 180% in pre-market trading to nearly 66 before dropping to close near 39. On the surface, that reading screamed extreme fear and a premium-selling opportunity. Beneath the surface, something more mechanical was happening.
Two institutional reports dissected the event: the BIS Bulletin “Anatomy of the VIX spike in August 2024” and the SEC DERA working paper “Demystify the Surge in VIX.” Their conclusion changes how you should read any IV spike.
The institutional finding Both reports concluded the August 2024 spike was driven primarily by illiquidity and the asymmetric widening of bid-ask spreads on out-of-the-money SPX puts, not broad fundamental repricing.
For premium sellers, the danger is stark. Mark-to-market losses from quote-driven IV expansion can be severe even when realised volatility stays moderate, which means the comfortable assumption of an imminent IV crush can turn against you violently. For premium buyers, the danger is symmetric: buy long-volatility structures at peak panic and you overpay at the moment of maximum liquidity dislocation, then absorb punishing losses once spreads normalise and market makers tighten quotes.
Volatility risk premium inversion, where realised volatility exceeds implied on roughly one in seven trading days historically, is the structural failure mode the August 2024 event amplified to an extreme: when the implied-over-realised gap goes negative, gamma losses overwhelm theta income and neutral trades convert into unintended directional positions before any adjustment is possible.
The high-IV regime carries several distinct failure modes worth holding in view:
- Gap and short gamma risk, where overnight moves blow through short strikes before you can adjust
- Volatility persistence, where IV refuses to collapse on your expected schedule
- Liquidity-driven quote spikes, where illiquidity distorts IV mechanically and transiently
- Position-sizing errors, where over-leveraged narrow condors magnify tail exposure
Three checks to add before any volatility-based trade
The August 2024 event tells you that IV thresholds and IV Rank readings need a third layer of scrutiny before you commit. Add these checks to your process.
First, ask whether the elevated IV reflects real information risk or a mechanical, liquidity-induced quote distortion. Term-structure shape and bid-ask width are your clearest signals; wide spreads and a distorted curve suggest a liquidity artifact rather than genuine repricing.
Second, confirm your position sizing is reduced in proportion to the variability the IV level implies. Higher IV mandates smaller positions, never larger ones. The capacity to absorb variance is the price of admission for selling premium.
Third, build in the possibility that IV persists or climbs further rather than mean-reverting on your preferred timetable. No framework survives a liquidity dislocation without this awareness, and traders who add these checks are far better placed to avoid entering at precisely the wrong moment.
Building a repeatable volatility-first decision process
Everything above collapses into a single sequence you can run before your next trade. What felt like separate rules is actually one decision tree, and it begins and ends with IV context.
Run these five steps in order:
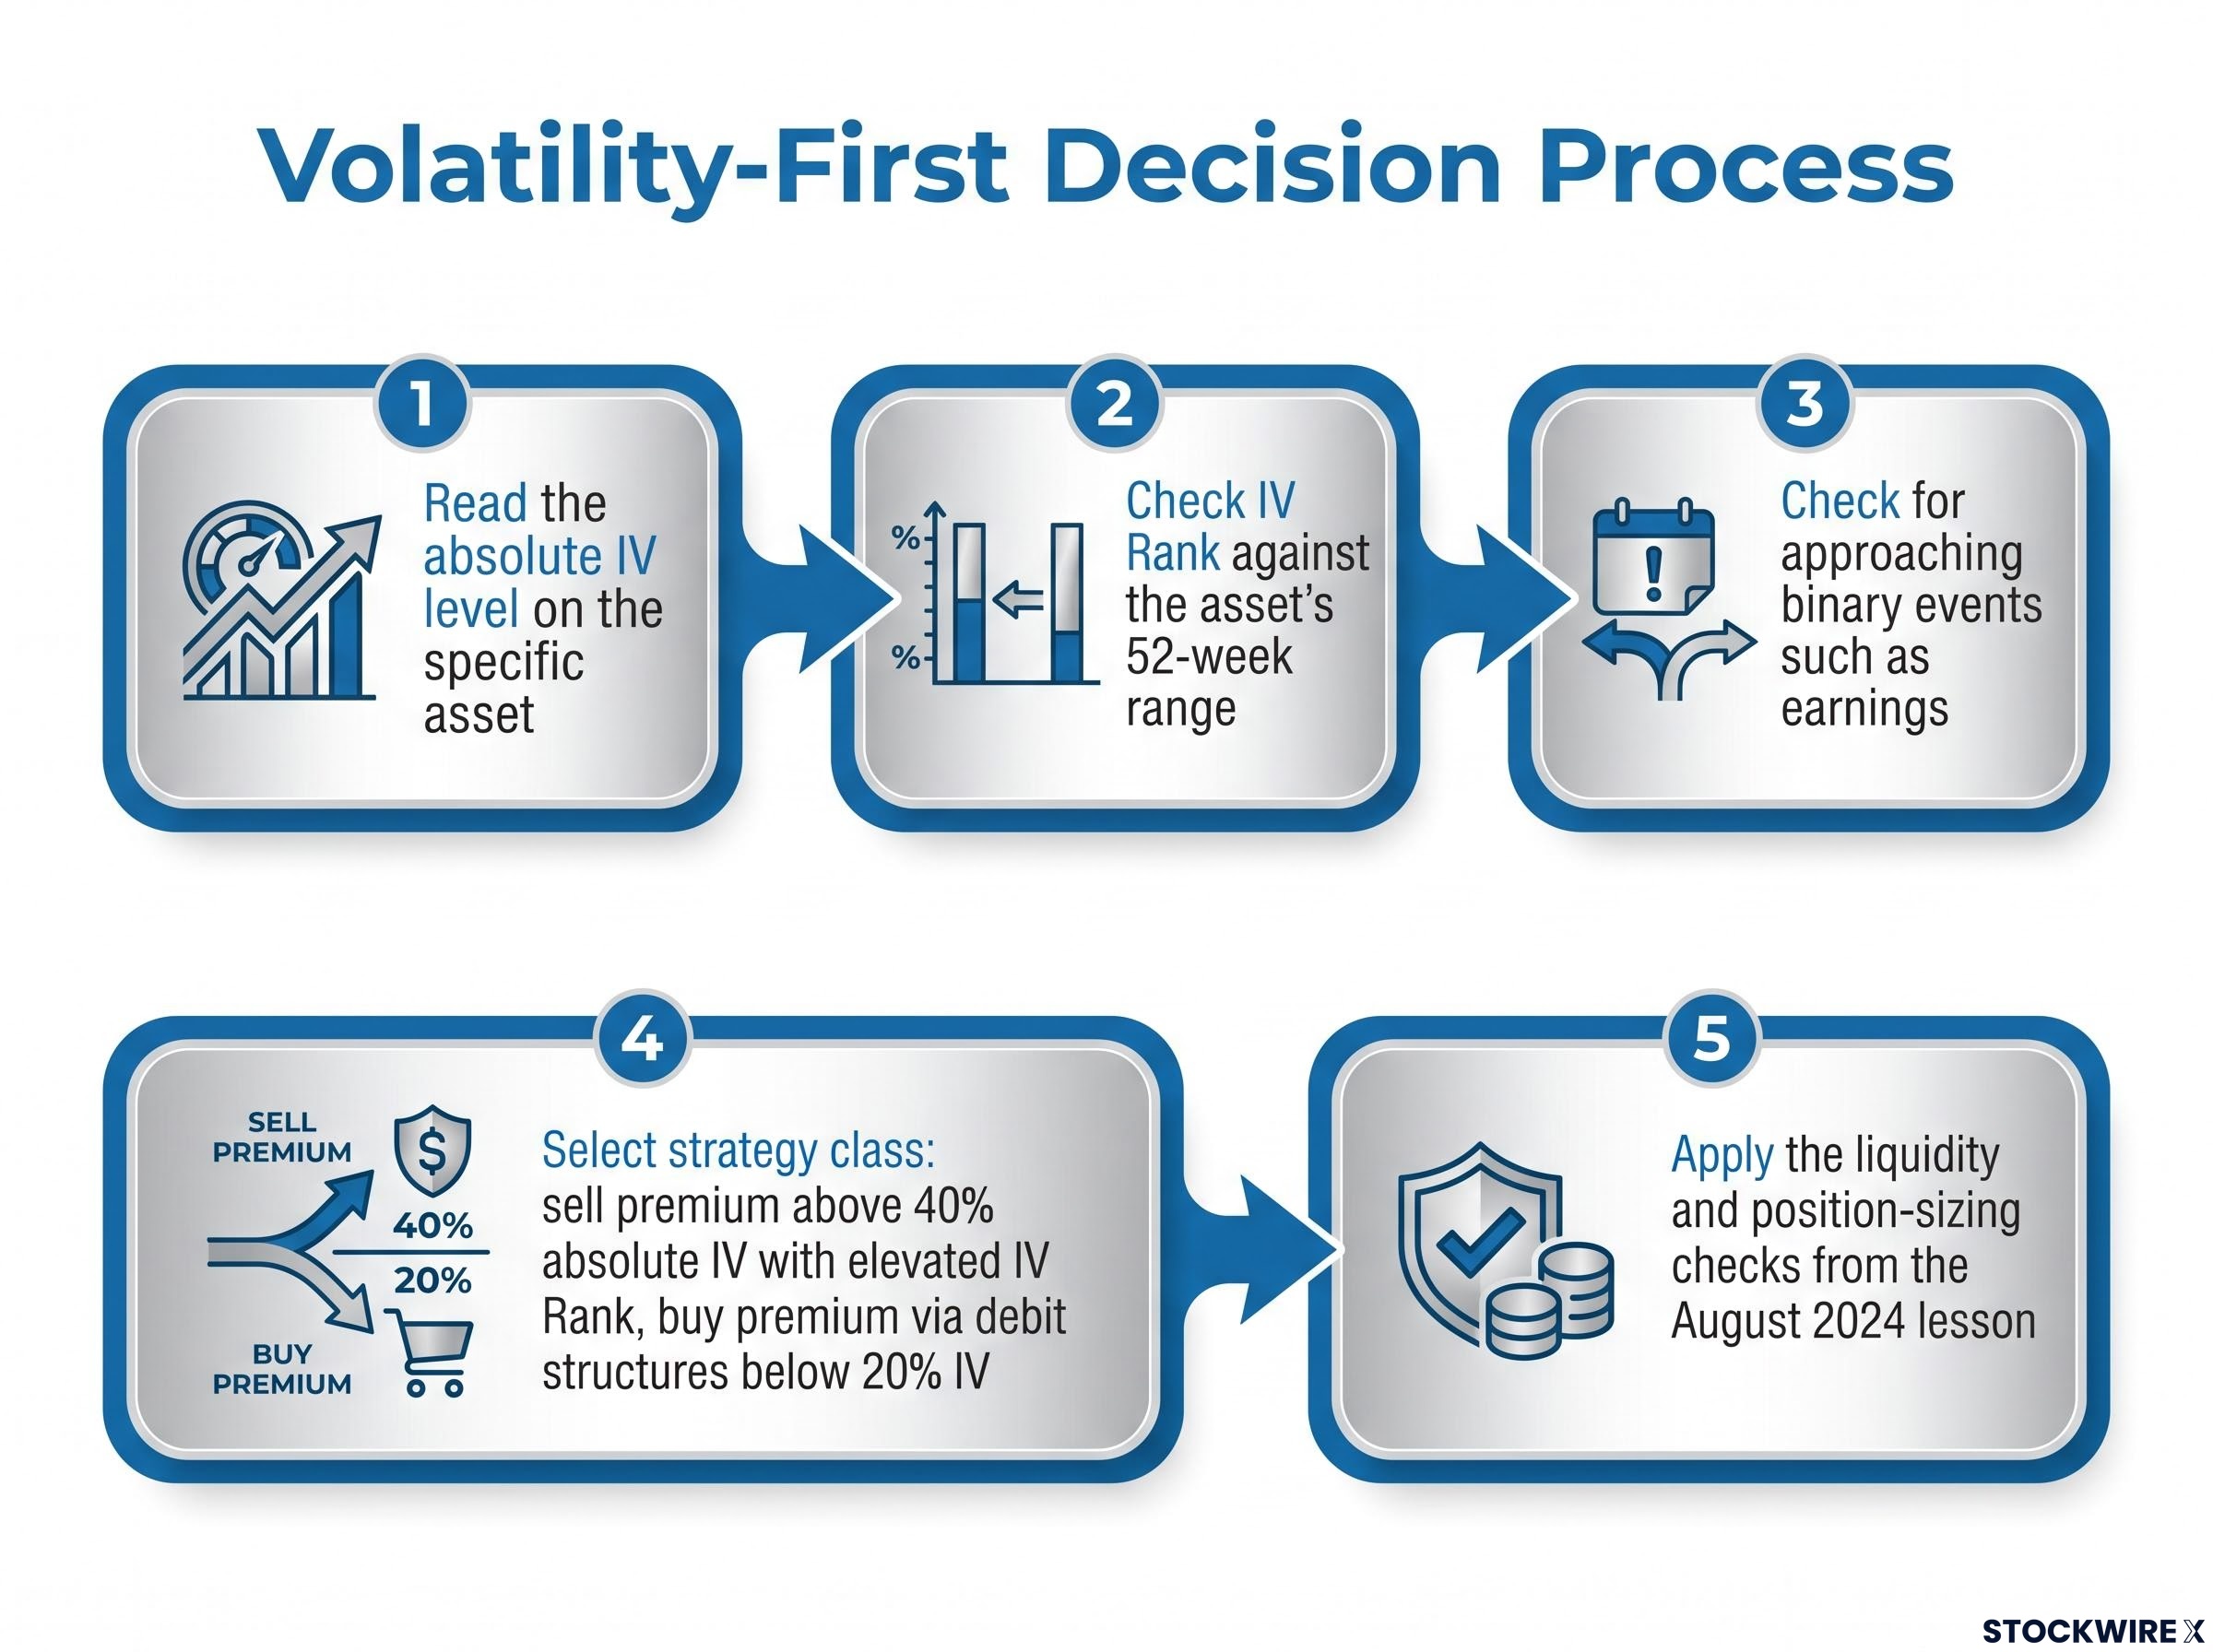
- Read the absolute IV level on the specific asset
- Check IV Rank against the asset’s 52-week range to judge whether premium is rich or cheap by its own standard
- Check for approaching binary events such as earnings that would distort the reading
- Select the strategy class: sell premium above 40% absolute IV with elevated IV Rank, buy premium via debit structures below 20% IV
- Apply the liquidity and position-sizing checks from the August 2024 lesson
The framework is deliberately asset-specific, and that is the point.
The asset-specificity principle The same process applied to TLT and AMD produces opposite recommendations, because the framework reflects each asset’s own volatility character rather than the market’s overall mood.
The current environment shows exactly why this matters. The VIX sits at 14.87, which looks like uniformly cheap options. But AMD has ranged toward 93% IV while TLT hovers near 13%. A low VIX does not mean premium is cheap everywhere. It means you must apply the framework asset by asset, or you will misjudge where the real opportunity and the real risk actually live.
For investors wanting to understand why a low headline VIX can mask very large single-stock volatility at the same time, our full explainer on VIX dispersion risk examines the $1.5 trillion in short-volatility exposure suppressing the spot reading and the forward curve signals institutions use to hedge against the gap.
Work through this sequence before every trade and you build something more durable than a single profitable position. You build a process that holds up across changing regimes, so you no longer rely on intuition or rediscover the same lesson after each loss.
This article is for informational purposes only and should not be considered financial advice. Investors should conduct their own research and consult with financial professionals before making investment decisions. Past performance does not guarantee future results, and options trading carries substantial risk of loss.