Most traders can draw the shape. Very few can tell you where to enter, where to place the stop, or how far the move is likely to run.
The head-and-shoulders formation is one of technical analysis’s most recognised patterns, and also one of its most misapplied. Recognising it on a chart is easy. Trading it with discipline is a different skill entirely.
This guide works through the full practitioner framework: how the measured move is calculated, why confluence with price gaps adds conviction, and how the timing of your entry changes the risk you take on. Two large-cap U.S. stocks, JPMorgan Chase and UnitedHealth Group, serve as concrete illustrations of the method at different stages of pattern completion.
By the time you finish, you will have a replicable process for identifying short-selling setups from head-and-shoulders formations, sizing the expected move, and managing the trade from entry through exit. The JPM and UNH examples ground every concept in live price action, so you can see exactly what the method looks like when applied to real charts.
What the head-and-shoulders pattern actually signals, and how to measure the move
The first thing most people see is the shape: three peaks, with a taller one in the middle flanked by two lower ones. That visible structure is where most readings stop, and it is also where most mistakes begin.
What the pattern actually represents is a failed attempt to make a new high. The head is the last push higher. The right shoulder is the market trying to repeat that push and falling short, forming a lower peak. That lower peak is the tell: buying pressure has run out of fuel.
But the shape alone gives you nothing to trade. The pattern is not actionable until the neckline, the support level connecting the lows between the peaks, breaks with a confirmed candle close below it. An intraday pierce that closes back above the line is not a break.
Here is the calculation that turns the shape into a plan. The measured move is a three-step procedure:
- Identify the head, the highest point of the pattern.
- Measure the vertical distance from the head down to the neckline.
- Project that same distance downward from the point where the neckline broke. That gives you the target zone.
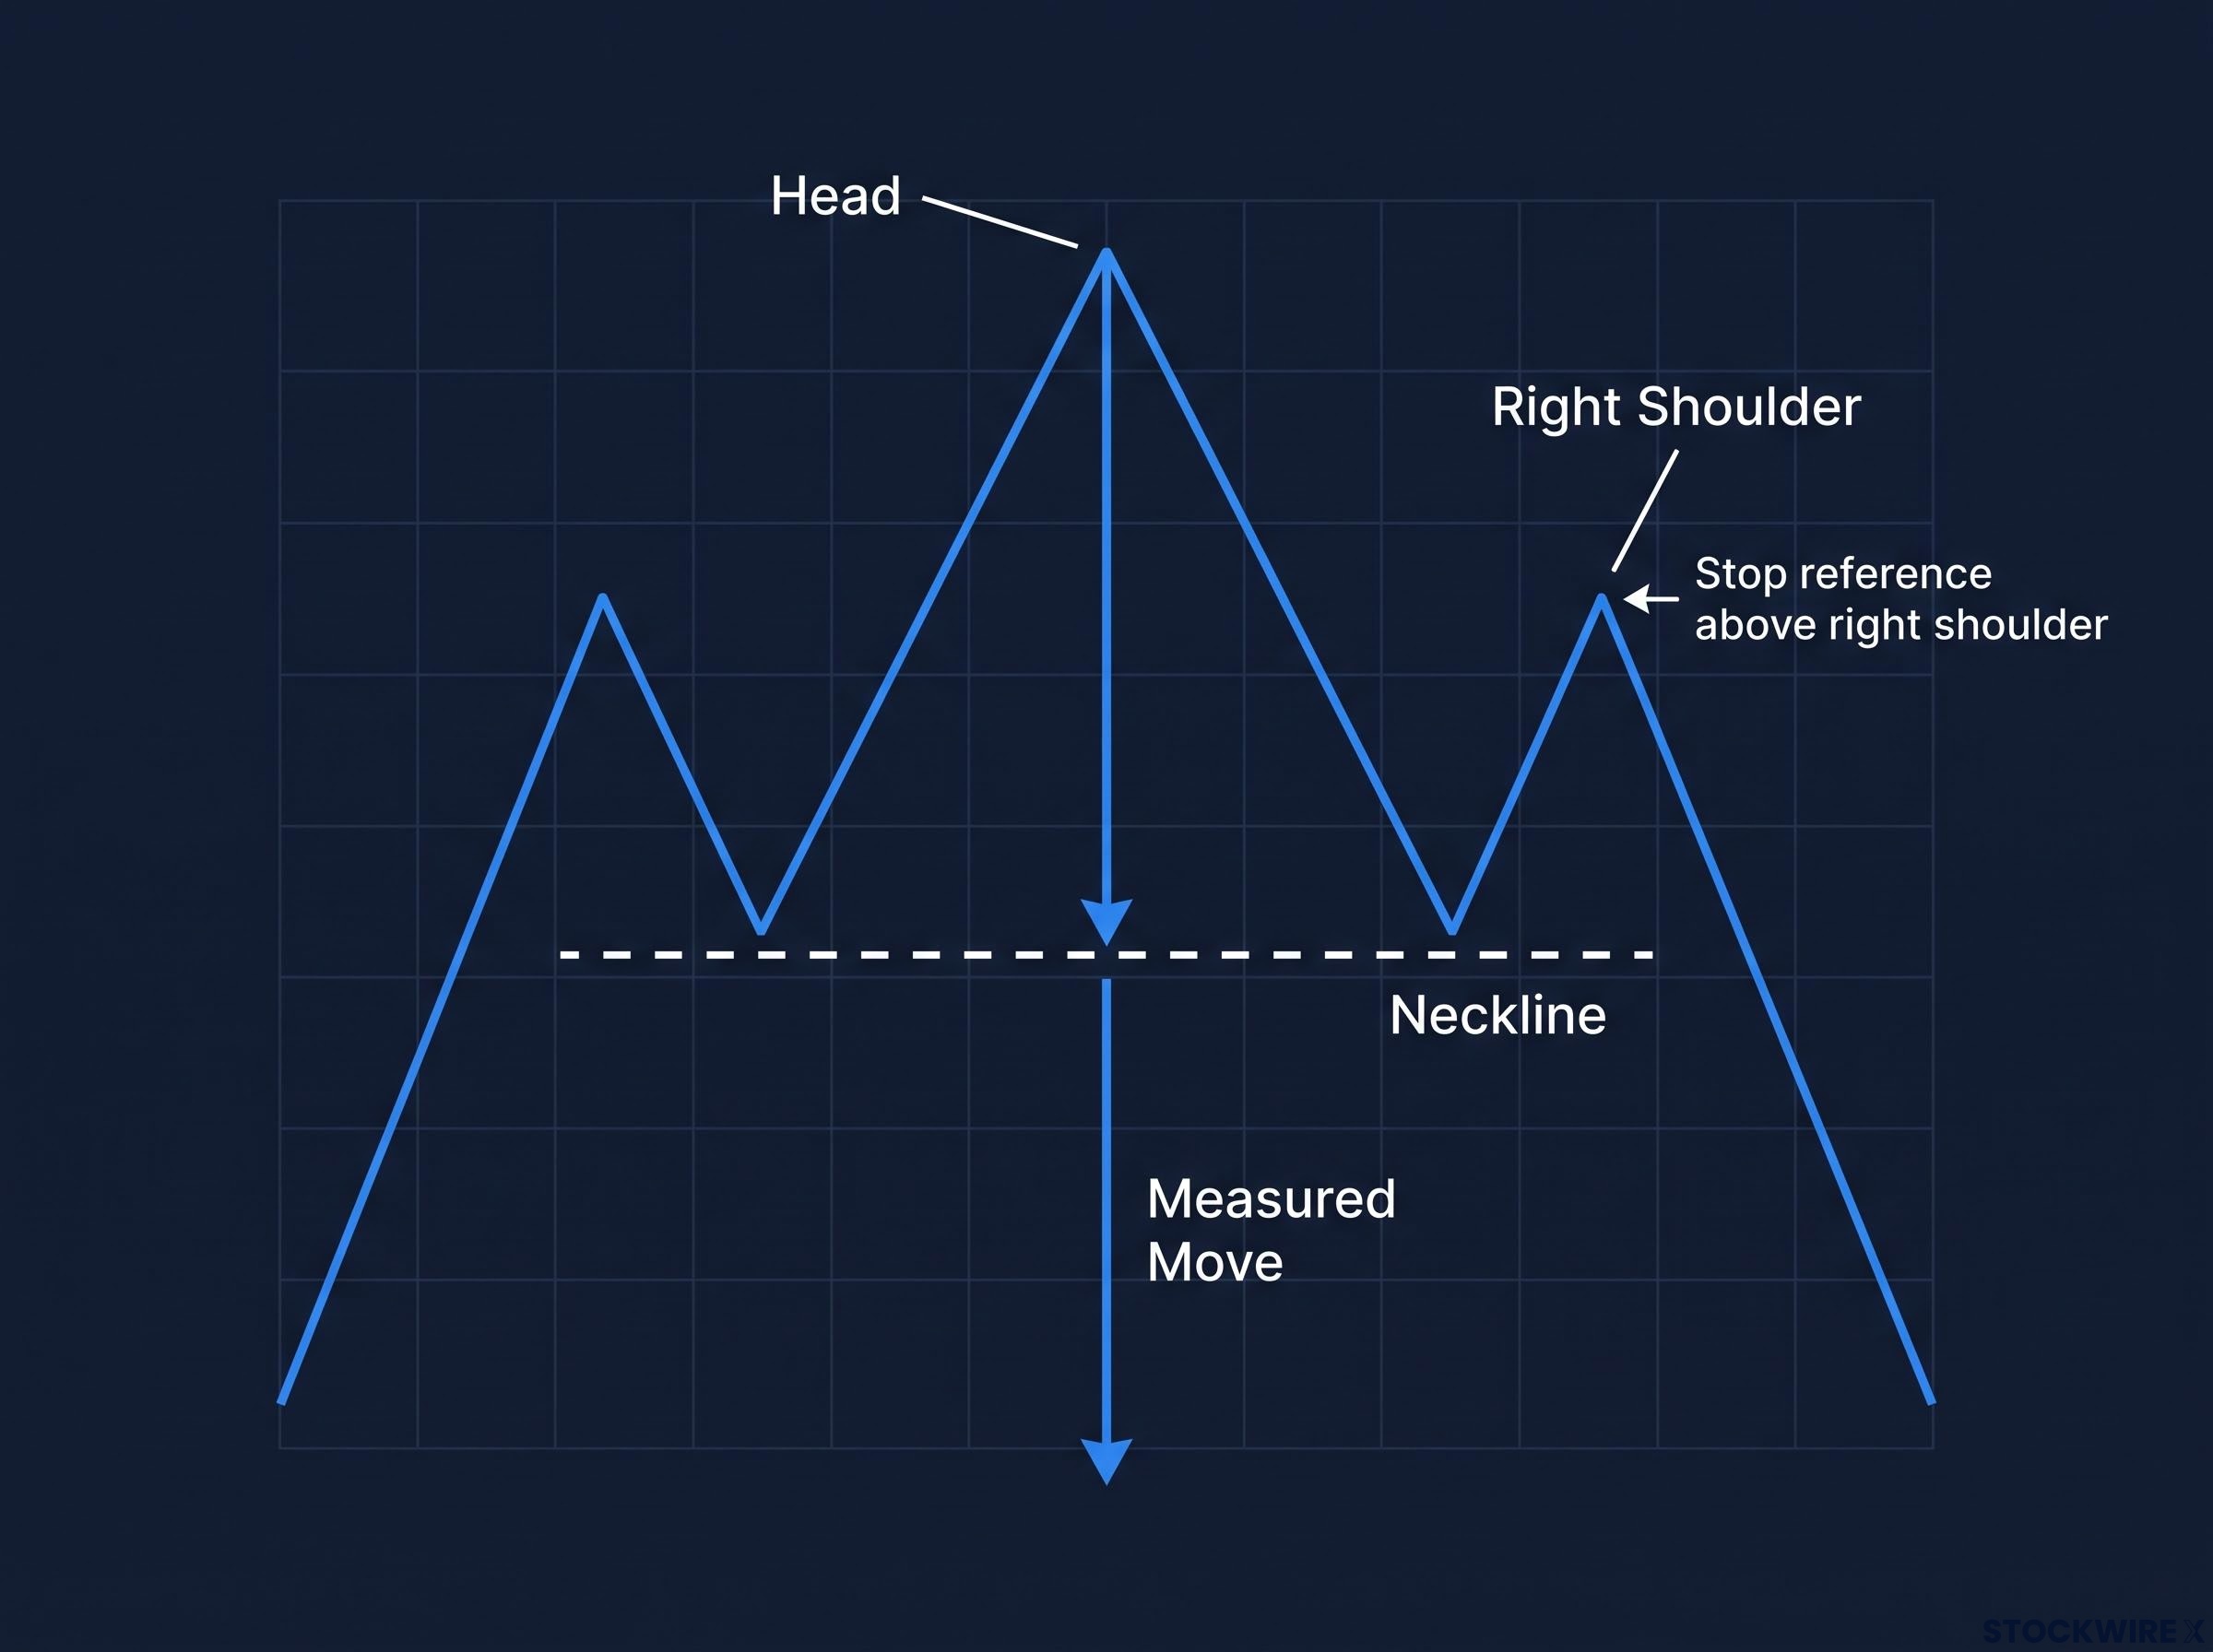
For an inverted head-and-shoulders, which is the bullish version, you use the lowest point of the head as your reference and project upward instead. The mechanic is identical, just flipped.
The height of the pattern, measured from head to neckline, represents the energy built up in the prior uptrend. The measured move is the market unwinding that energy once the pattern completes.
This is the distinction that matters. The measured-move target tells you how much energy the prior trend accumulated, not a guaranteed price where the decline will halt. Both IG and Strike.money frame it as a probabilistic “target zone” rather than a fixed level. Traders who understand that treat the target as a management guide. Those who don’t tend to hold losers, waiting for an exact number that price sails past or never reaches.
Bulkowski’s dataset puts measured-move completion rates at just 51% across more than 2,800 head-and-shoulders tops, with a break-even failure rate of 19%, which is why the 40% partial-profit threshold in this guide is grounded in probability rather than optimism.
Confirmation requirements before entry
Three conditions validate the signal before you commit capital.
First, a full candle close below the neckline, not just an intraday pierce. Second, above-average volume at the break, which signals that heavier selling is behind the move. Third, the right shoulder level as your structural stop reference: if price trades back above it, the setup is invalid.
Why does an intraday pierce fail the test? Because price can dip below the neckline, trigger early shorts, then reverse and close back above it. That reversal traps traders who jumped in before the pattern committed, and it is one of the most common ways a head-and-shoulders short turns into a loss.
When big ASX news breaks, our subscribers know first
How confluence makes a measured-move target worth trading: the JPM setup
JPMorgan Chase gives you a clean example of a pattern still in waiting. According to analysis from Lawton at Verified Investing, the head-and-shoulders on JPM was developing but not yet complete: the right shoulder still needed to decline to finish the structure. That distinction matters, because it means entry was not yet valid. You were watching a plan form, not executing one.
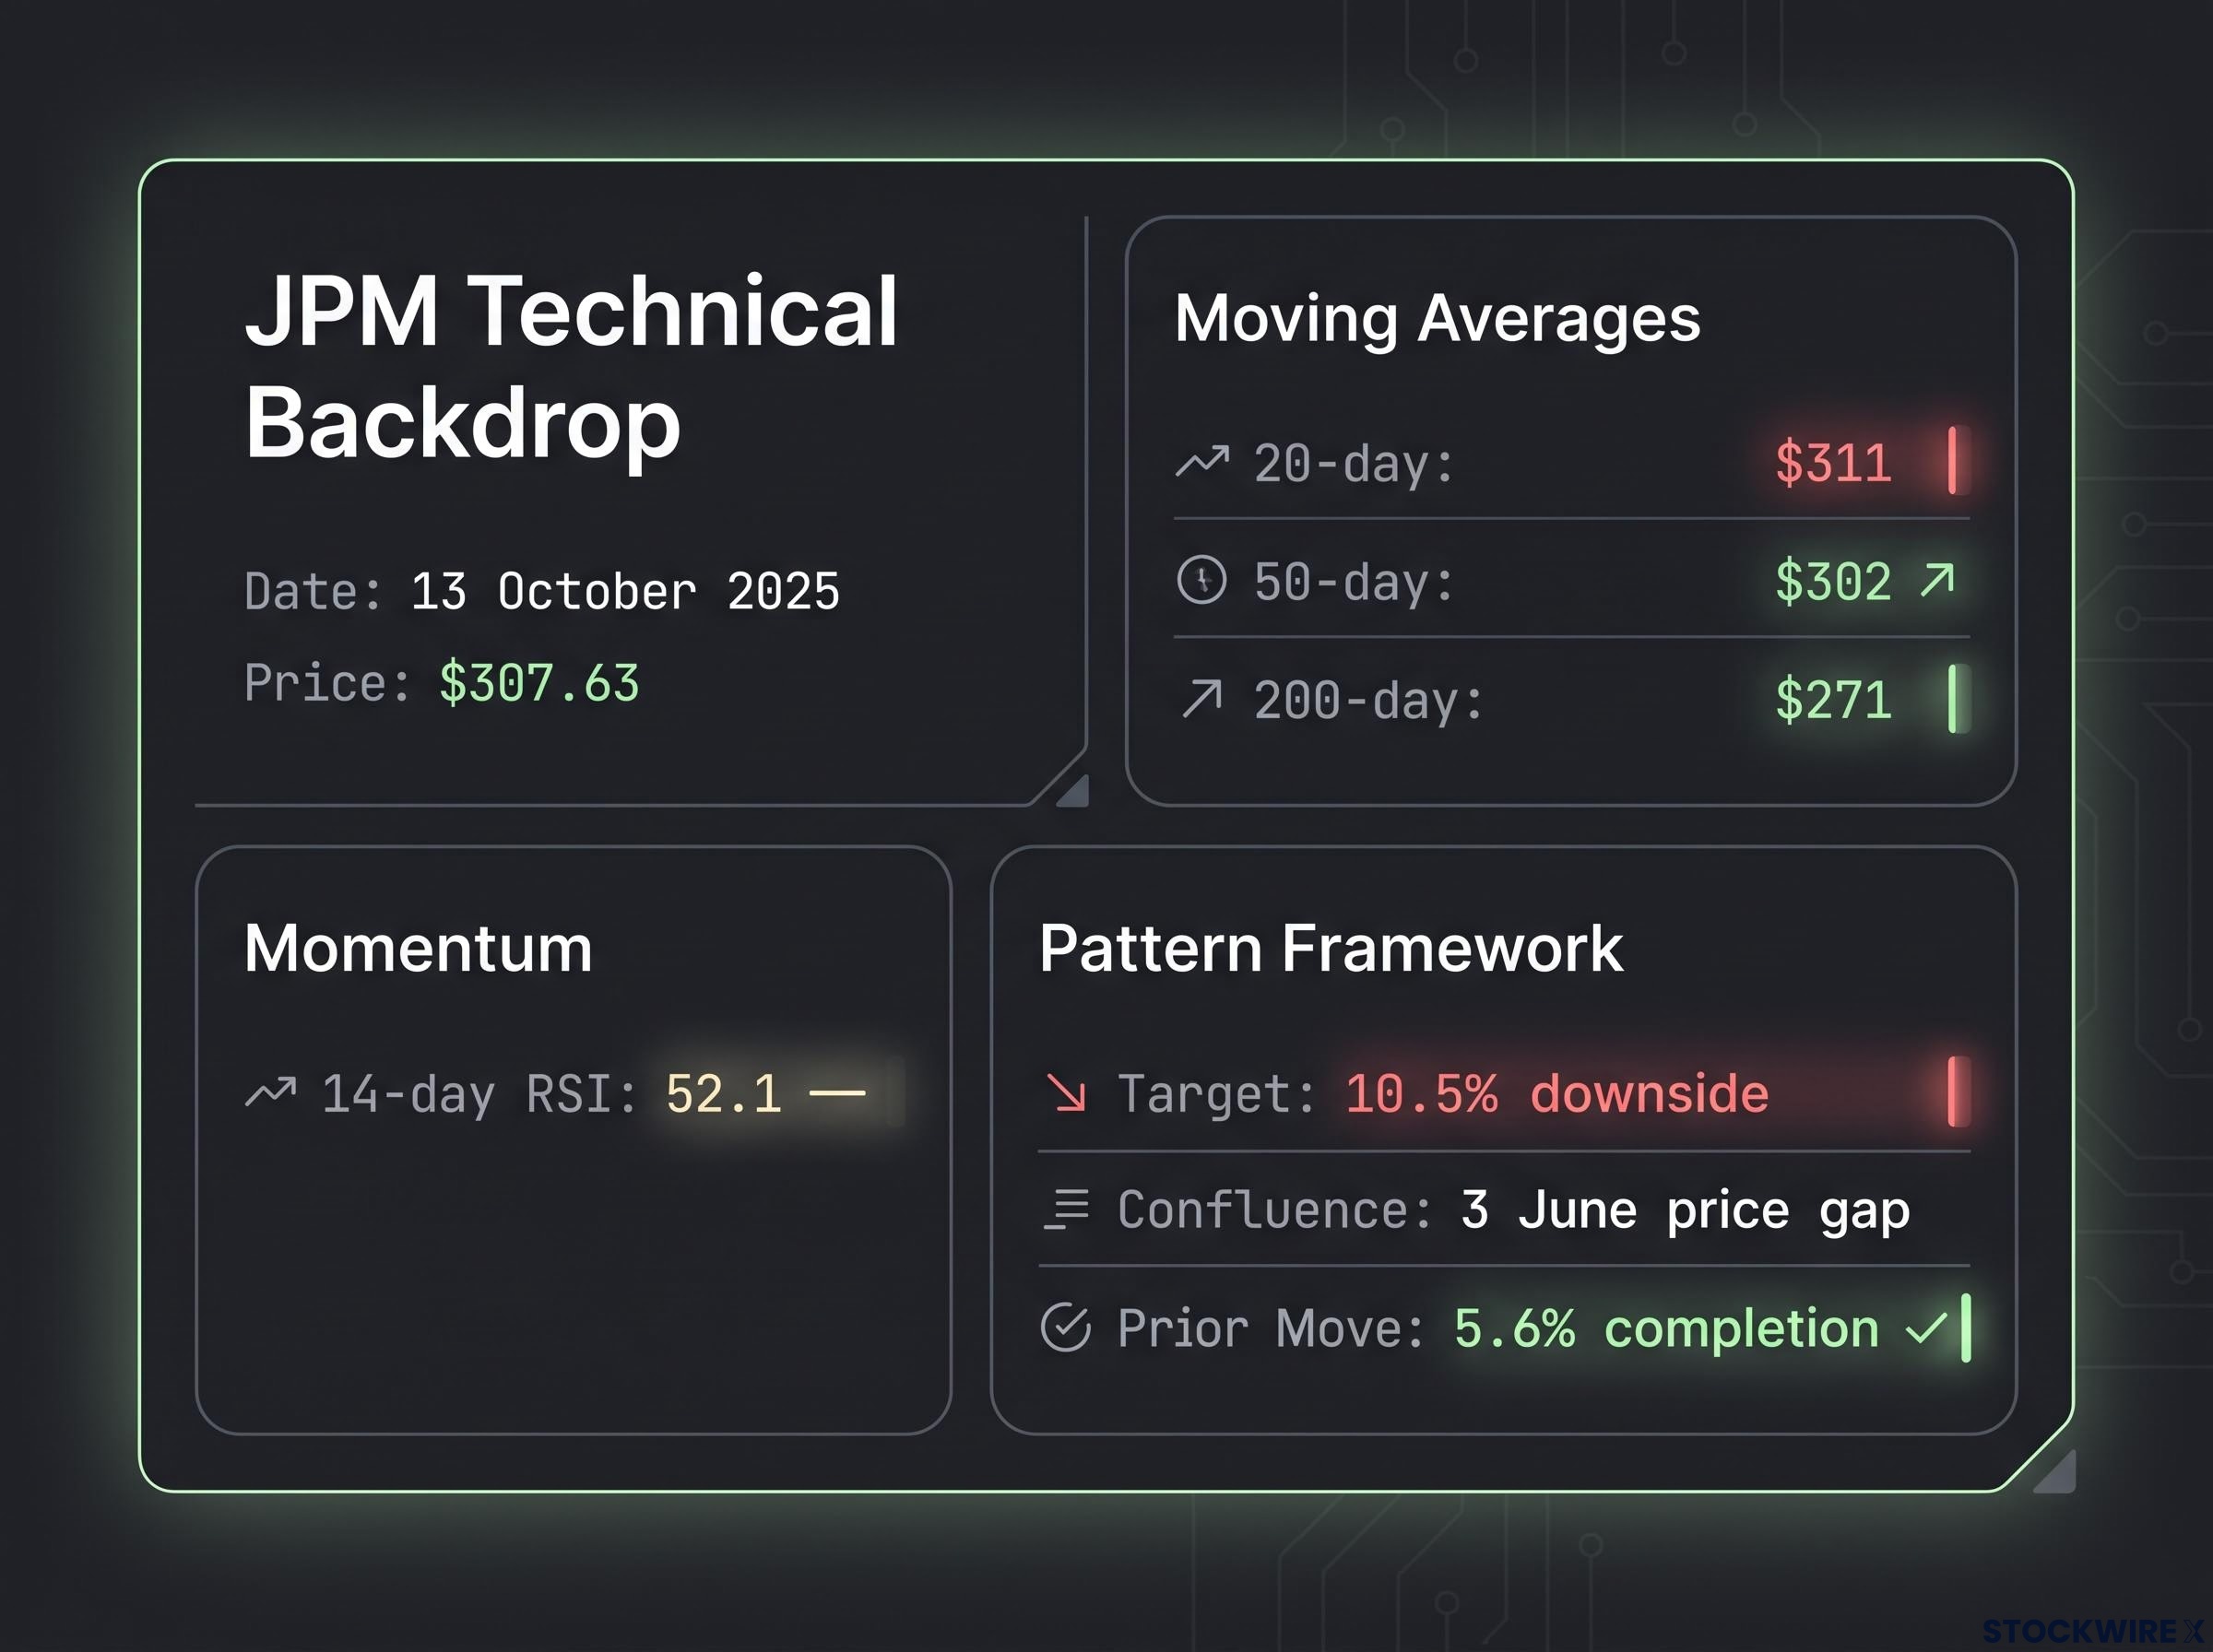
The measured move on this developing pattern projected roughly 10.5% of downside. On its own, a geometric target is just a number. What made this one worth trusting was where it landed.
The 10.5% target lined up with a price gap from 3 June. A gap is a range where price jumped without trading, and markets often return to fill it. When your measured-move target and an independent gap point to the same level, you have confluence: two separate analytical factors agreeing. That agreement is what elevates a target from recognisable to actionable.
There is a second reason to give this setup weight. JPM had previously completed a head-and-shoulders measured move of approximately 5.6%, which was met and slightly exceeded. That prior completion tells you the methodology has already worked on this exact ticker, which reduces how much you are leaning on pure geometry this time.
The technical backdrop supported patience. As of 13 October 2025, JPM traded at $307.63, according to Capital.com, sitting above its key moving-average cluster: the 20-day near $311, the 50-day near $302, and the 200-day near $271. Its 14-day RSI stood at 52.1, squarely neutral. In other words, momentum had not yet picked a direction, which is exactly why waiting for the neckline break was the right call rather than pre-empting it.
That leaves the practical question: how do you actually get in? Two approaches, with different trade-offs.
| Approach | Trigger | Key Risk | Key Benefit |
|---|---|---|---|
| Aggressive (neckline break) | Short as price closes below the neckline on above-average volume | Fake-out if volume fades or price reclaims the neckline quickly | Captures the full move from the initial breakdown |
| Conservative (retest) | Short on the bounce back to the neckline after it breaks | A fast breakdown that never retests is missed entirely | Tighter invalidation and confirmation the neckline now acts as resistance |
The aggressive entry pays you for accepting more false-break risk. The conservative entry trades some of the potential move for a cleaner, tighter setup. Neither is objectively correct; the right one depends on how much confirmation you personally need before committing.
Reading a completed breakdown: the UNH re-entry setup
If JPM shows you a pattern waiting to trigger, UnitedHealth Group shows you one already in motion, and that changes everything about how you approach it.
The breakdown here had a fundamental spark. On 17 April 2025, UNH reported a quarterly earnings miss and cut its full-year profit forecast, triggering a single-day collapse of roughly 22%, according to Reuters and Healthcare Dive. The guidance cut was severe.
UnitedHealth cut its 2025 adjusted earnings-per-share outlook from $29.50-$30.00 down to $26.00-$26.50, a reduction driven by higher-than-expected medical costs.
CEO Andrew Witty called the quarter “frankly unusual and unacceptable.” That kind of language from the top adds fundamental weight to a technical breakdown, because it confirms the deterioration is real rather than a passing wobble.
A post-earnings gap-and-fade, where a stock opens sharply higher on strong results and then closes roughly flat, is read by professional short-sellers as a sign that institutional holders used retail enthusiasm as an exit, not an entry, a dynamic directly relevant to how the UNH April 2025 collapse unfolded.
The price damage was severe. UNH fell from a pre-crash peak near $599.62 to a trough around $260 by August 2025, according to Trefis and Capital.com, before recovering into the $330-$345 zone by early 2026.
By the time of Lawton’s analysis, the head-and-shoulders had already broken. That is why the preferred re-entry was not the original break but a bounce back to the neckline, where the neckline is now expected to act as resistance rather than support. The setup gives you two downside objectives.
| Target Level | Price | Basis | Distance from Recovery Zone |
|---|---|---|---|
| First objective (lower pivot) | $346 | Prior pivot support | At or just below the $330-$345 recovery zone |
| Second objective (gap fill) | $323.56 | Earnings gap from the 20 April announcement | Roughly $10-$20 below the first target |
The gap fill at $323.56 is the same confluence principle at work as with JPM: an independent gap aligning with the measured-move framework, giving you a second reason to trust the level.
Here is the part that should shape your thinking. At the time of analysis, only 15-20% of the total measured move had completed, against a framework threshold of roughly 40% at which a trade is considered fulfilled. That gap between where the move was and where the framework expects it to reach means you would be positioning early, with the majority of the projected decline still ahead of you rather than behind. You are not chasing a move that has already run.
Why the neckline retest matters
The mechanic behind the retest is simple but easy to overlook. Before a breakdown, the neckline is support: buyers step in there. After a confirmed break, that same level flips to resistance: sellers now defend it. A bounce back to the neckline that fails and turns lower is your confirmation that the flip has held.
That flip is what makes the retest a lower-risk entry than the original break. Your stop goes above the right shoulder, the structural invalidation point. If price trades above that level, it means sellers have lost control and the bearish thesis is no longer valid, so you exit rather than argue with the chart.
Pattern quality, failure risk, and the factors that separate high-conviction setups
Knowing how to trade the pattern is one thing. Knowing which patterns are worth trading at all is what protects your capital.
Not every recognisable head-and-shoulders deserves your money. The following factors, drawn from Lawton’s framework alongside IG and Strike.money, increase a setup’s reliability. Treat them as a quality checklist:
- A full candle close below the neckline, not just an intraday pierce
- Above-average volume at the break, which IG notes reduces the probability of a false move
- Momentum indicators such as RSI trending in the direction of the breakdown
- Price already sitting below major moving averages, confirming the broader downtrend
- Sector-wide weakness aligning with the individual stock’s deterioration
- A successful neckline retest that holds as new resistance before price continues lower
The two case studies show how momentum reads at different stages. At UNH’s April 2025 breakdown, RSI sat at 38, according to StockInvest, bearish and trending lower but not yet extreme oversold: momentum was confirming the thesis. JPM’s RSI of 52.1 was neutral, which told you the breakdown direction had not yet been confirmed and patience was warranted.
On the other side, three signals tell you a pattern is failing:
- Price reclaims the neckline after breaking below it
- Price trades back above the right shoulder
- The breakdown occurs on low volume and then reverses, trapping shorts into a squeeze
Place your stop above the right shoulder. Per Strike.money, price moving above that level shows sellers have failed to hold control, which invalidates the bearish thesis entirely.
Pre-defining your invalidation level, the exact price at which the setup no longer makes sense, before entering a position is one of the clearest behavioural separators between consistently profitable traders and retail accounts that hold losers too long; the disposition effect causes traders to do the opposite, selling winners early while averaging into failing shorts.
There is also a management rule worth building in. Because a trade is considered fulfilled at roughly 40% of the measured move, taking partial profits around that point reduces your reliance on price hitting the full target. A pattern breaking on strong volume, with momentum already lower, price beneath its moving averages, and a weak sector behind it, is a materially different proposition from the same shape appearing in isolation. That difference is what should determine whether you commit full size or trade smaller.
Applying the framework without relying on the pattern alone
The measured-move target is a guideline for managing the trade, not a promise of where price will stop. Earnings surprises, macro news, or a sector-wide squeeze can disrupt the move entirely, which is why leaning on the pattern as a standalone signal is a mistake.
The fix is to bring in independent tools that validate or caution against your target. Fibonacci retracements and extensions, volume-profile levels, and major moving averages all give you a read that does not depend on the geometry of the pattern itself. When several of these point to the same zone, your confidence should rise. When they conflict, that is a signal to trim expectations.
Professional traders require a confluence of technical levels, typically at least two independent structural factors converging on the same narrow zone, before treating any price as a genuine target; when a measured-move projection, an unfilled gap, and a prior pivot all agree, the level carries a fundamentally different weight than geometry alone.
Here is the full practitioner workflow, in the order you would actually run it:
- Identify the forming pattern on the chart.
- Wait for a confirmed candle close below the neckline.
- Calculate the measured move from head to neckline, then project it down.
- Check for confluence with gaps, pivots, or other independent levels.
- Assess the quality factors: volume, momentum, moving averages, sector.
- Choose your entry: the neckline break or the retest.
- Set your stop above the right shoulder.
- Take partial profits near 40% of the measured move.
- Manage or exit the remainder toward the full target.
- Abandon the trade if price reclaims the neckline or the right shoulder.
JPM’s prior 5.6% measured move, met and slightly exceeded, shows a full move working as intended. But even a successful prior completion on the same stock does not guarantee the next setup follows suit, which is why the quality check in step five is not optional.
UNH illustrates the ideal condition. The April 2025 breakdown coincided with sector-wide managed-care selling pressure, so the pattern and the fundamentals pointed in the same direction. That alignment is what you are hoping to find, not the pattern alone.
When to walk away from a setup
Some conditions reduce a pattern’s reliability enough to justify passing entirely.
Be cautious with a stock carrying very high existing short interest, where a squeeze can force shorts to cover and reverse the move. Pass on a pattern forming in a sideways market with no clear prior uptrend, because there is little accumulated energy to unwind. And treat breakdowns in thin or declining volume with suspicion, since they are the ones most likely to reverse.
This article is for informational purposes only and should not be considered financial advice. Investors should conduct their own research and consult with financial professionals before making investment decisions. Past performance does not guarantee future results.
What the JPM and UNH setups tell you about reading bearish patterns in practice
Place the two setups side by side and the lesson comes into focus. The pattern is the same; where you catch it in its lifecycle is what changes the trade.
| Factor | JPM | UNH |
|---|---|---|
| Pattern status | Developing, right shoulder not yet complete | Already broken down, in partial recovery |
| Preferred entry | Neckline break or retest | Bounce back to the neckline (retest) |
| Measured move target | ~10.5% downside | $346, then $323.56 (15-20% completed) |
| Confluence factor | 3 June price gap | 20 April earnings gap fill |
| Stop reference | Above the right shoulder | Above the right shoulder |
JPM asks for patience: you wait for the right shoulder to finish and the neckline to break before doing anything. UNH asks for a different discipline: you wait for the bounce rather than chasing the break that has already happened.
What stays constant is the method. Measured move, confluence check, quality factors, entry discipline, and a stop above the right shoulder apply to both, regardless of stage.
Your next step is straightforward. Take the stock you are already watching, score it against the quality checklist, identify where it sits in the pattern lifecycle, and wait for the neckline break before you act. Knowing whether you are in a waiting phase, a break entry, or a retest bounce is what turns a shape on a chart into a decision you can actually manage.