Most conversations about inflation start with central banks: rate decisions, money supply, the language of the Federal Reserve. That framing misses something happening in the physical world right now.
Between 2 and 3 million barrels per day of refined petroleum products have effectively vanished from global supply, according to S&P Global CERA. These are not abstract financial numbers. They are barrels of diesel, jet fuel, and marine fuel that are simply not arriving where they are needed.
The global economy is running into a structural supply constraint, one built on geopolitical chokepoints and a shortfall in refining capacity. In this environment, the usual economic indicators can mislead you, because the pressure is coming from the pipes and refineries rather than the printing press.
This is where energy inflation for investors becomes a distinct problem worth understanding on its own terms. Physical shortages do not respond to interest rate policy the way monetary inflation does.
Here is the framework for understanding how commodity scarcity bypasses central bank tools, how a diesel shortage becomes a food price shock, and how you can position a portfolio against self-reinforcing price spirals that policymakers cannot easily switch off.
The physical deficit rewriting global cost structures
The scale of the missing barrels is the part most portfolios have not priced in.
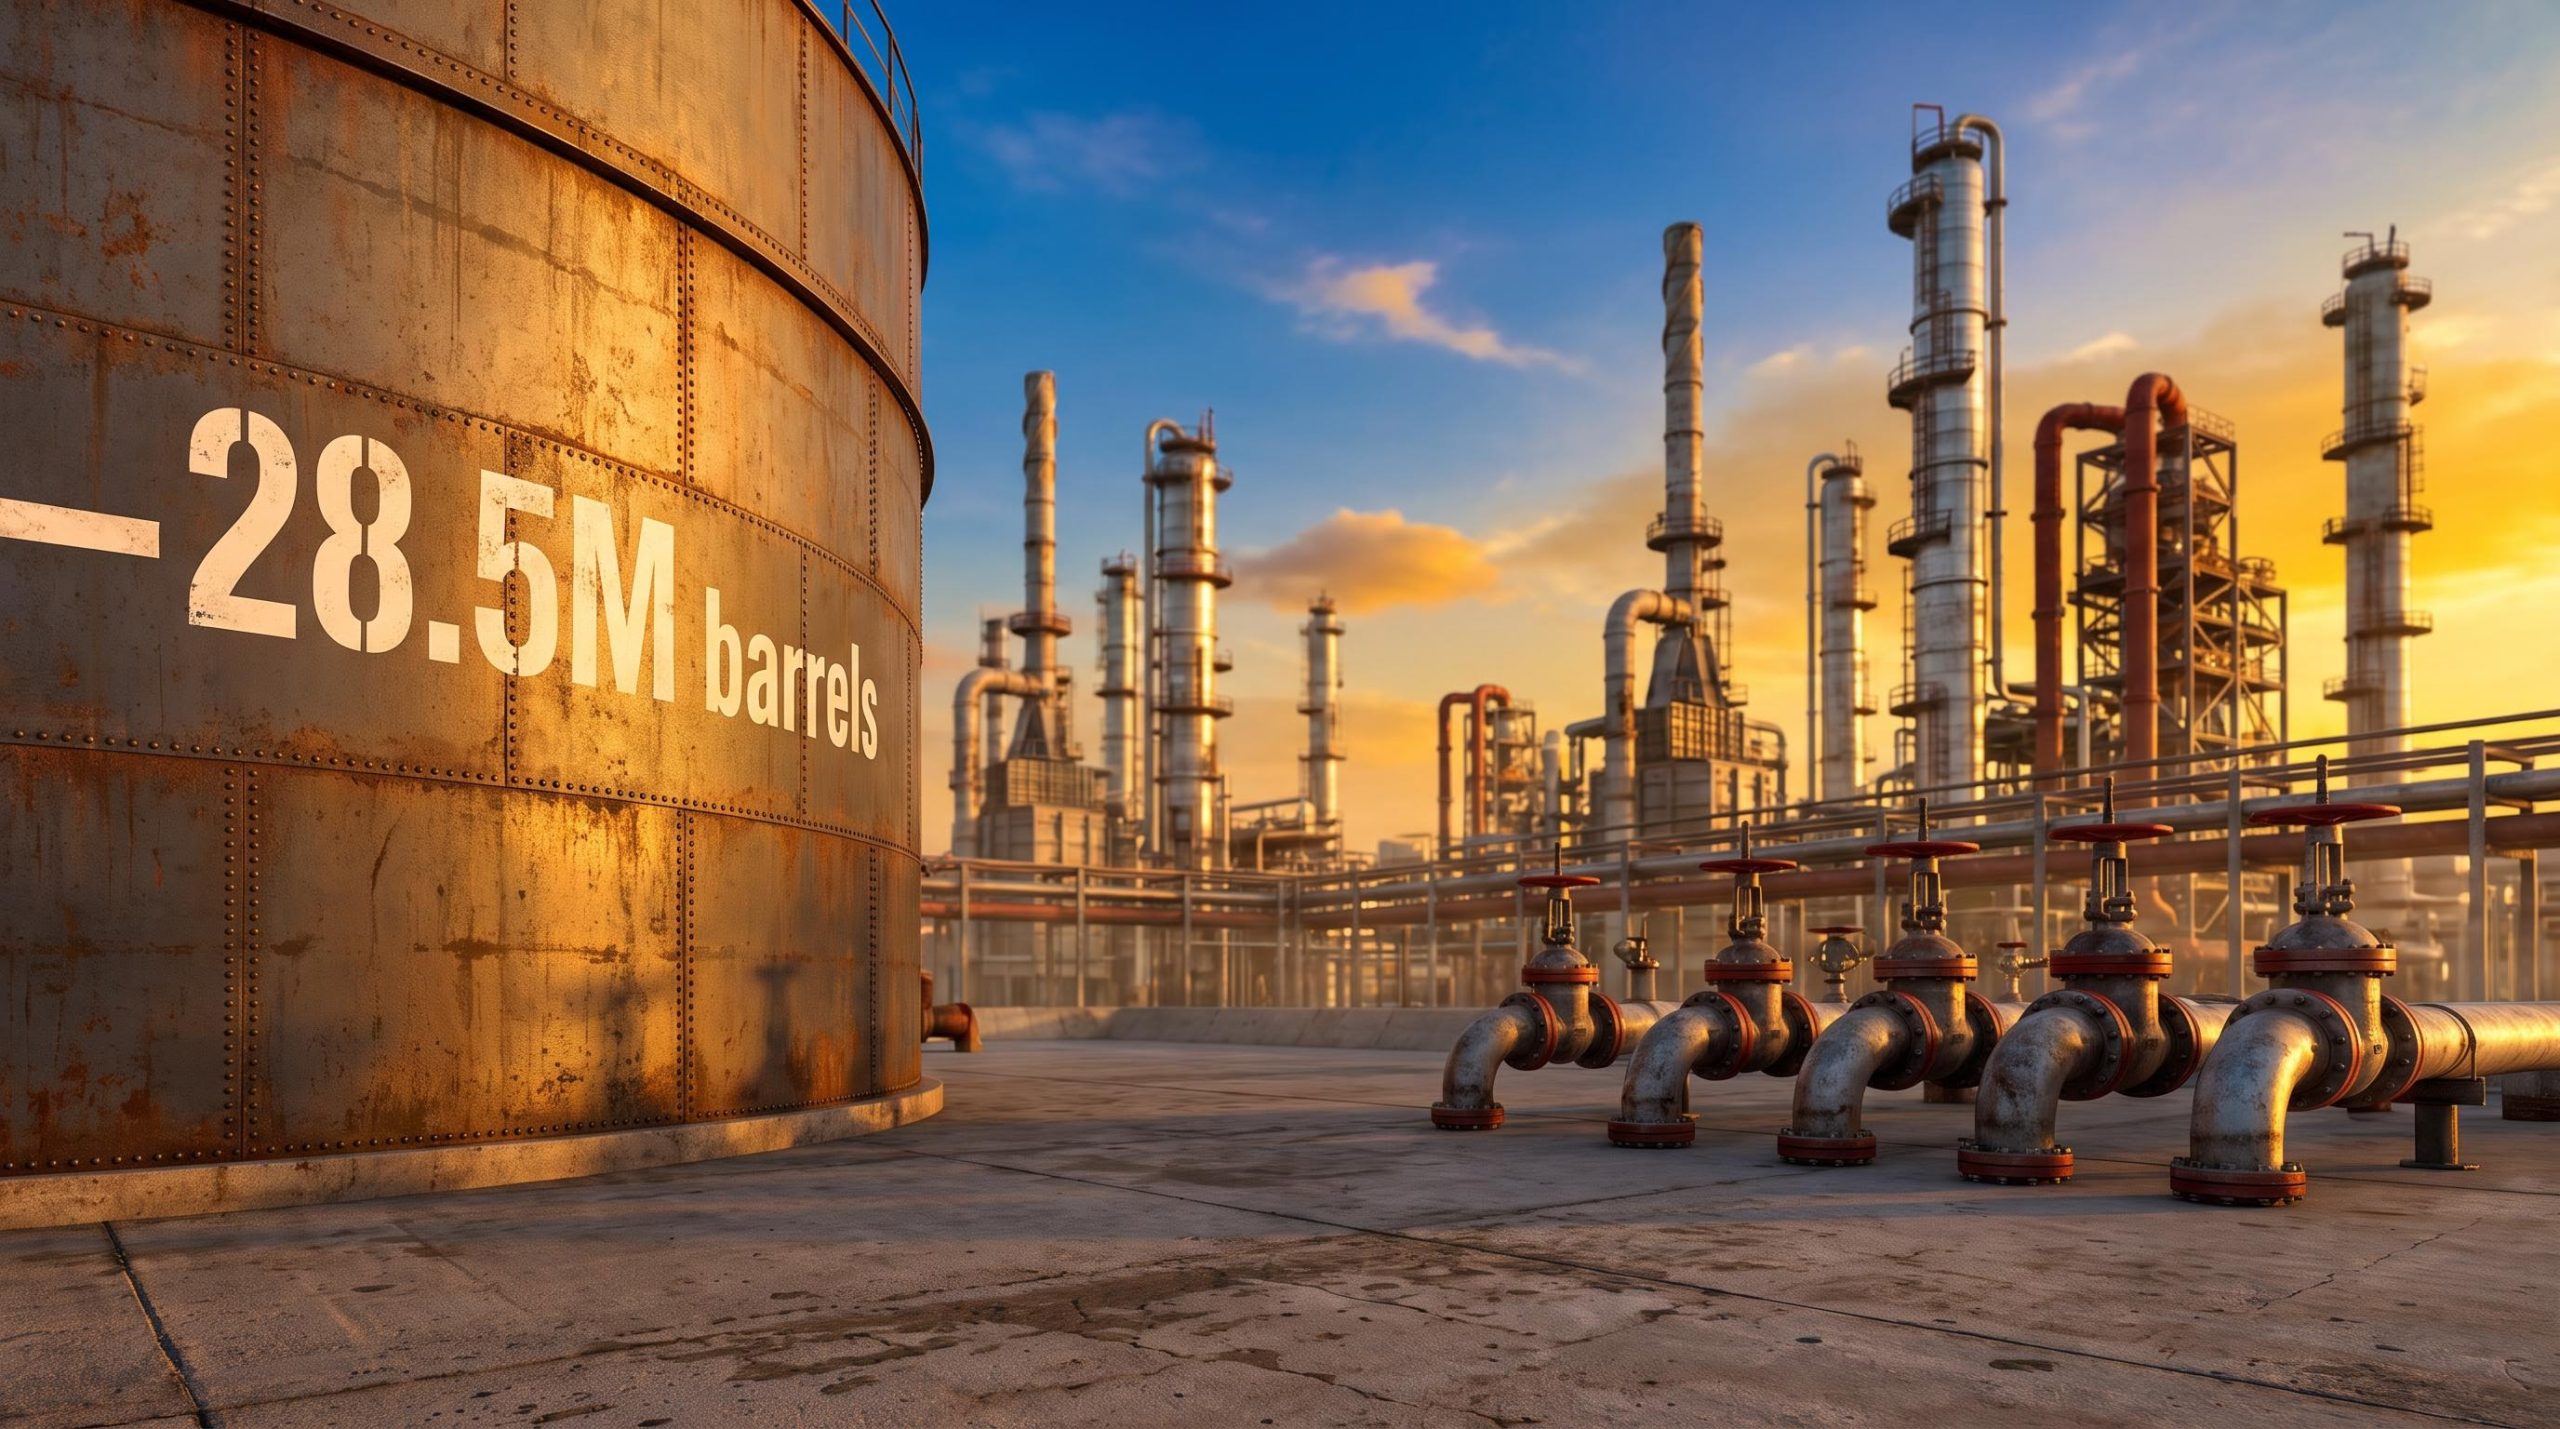
Global diesel inventories stood at 542 million barrels as of 21 August 2026, down 28.5 million barrels on the year. On the surface that sounds like a manageable drawdown. The seaborne trade data tells a harsher story.
The IEA’s Oil Market Report for August 2026 recorded seaborne product trade running 3.8 million barrels per day below year-earlier levels. Diesel exports from Russia, the Middle East, and Asia fell by 1.3 million barrels per day year-on-year, roughly a fifth of the world’s seaborne diesel trade. The original source analysis attributed the deficit to disruption through the Strait of Hormuz and reduced Russian supply, leaving an already short Europe badly exposed.
This is a physical scarcity problem, not a financial one. You cannot conjure refined product with liquidity. Refineries have to run the crude, and IEA data showed August 2026 refinery throughput sitting 4.2 million barrels per day below year-earlier levels.
The diesel crack spread, now running at four to five times its historical norm, confirms that the inflation pressure is being generated inside the refining layer itself, not simply in crude oil benchmarks, which is why headline oil prices alone understate the severity of the current supply crunch.
The IEA Oil Market Report for September 2026 tracks global refinery throughput, diesel inventories, and seaborne product trade in detail, providing the supply-side data that underpins the deficit figures examined throughout this article.
The table below shows the contrast at the heart of the current market: inventories and global trade falling while one supplier scrambles to fill the gap.
| Metric (August 2026) | Direction | Figure |
|---|---|---|
| Global diesel inventories | Down year-on-year | 542M barrels (-28.5M) |
| Seaborne product trade | Down year-on-year | -3.8M b/d |
| U.S. diesel exports | Record high | 54.2M barrels (month) |
These shortfalls set the baseline operating cost for almost every company you own. Anything with heavy logistics, freight, or industrial energy exposure is absorbing this now, which means you should be evaluating your equity holdings for their vulnerability to sustained fuel-driven cost inflation before it surfaces in the next round of earnings.
The U.S. export buffer and its limits
The reason this deficit has not already caused chaos is that U.S. refiners have thrown record volumes at the gap.
U.S. diesel exports totalled a record 54.2 million barrels in August 2026, per S&P Global CERA, and ultra-low sulfur diesel shipments averaged 1.77 million barrels per day from late August, well above the prior 12-month run rate of 1.3 million barrels per day. The U.S. has become Europe’s main external diesel supplier, providing roughly half of the region’s seaborne imports in late July 2026.
That buffer is thinner than it looks. The original source analysis assessed that removing roughly 1.3 million barrels per day of U.S. diesel from global markets, as a hypothetical export ban would do, would be the largest single withdrawal of diesel on record.
The read for you is that European and Asian shortages are being masked, not solved. If U.S. export capacity hits a domestic political or operational ceiling, the cascade would not stop at diesel. It would extend to aviation fuel and marine fuel oil, seizing up the freight and shipping arteries the wider economy depends on.
When big ASX news breaks, our subscribers know first
Anatomy of a price spiral and the 1970s parallel
To understand why this could become more than a bad year for fuel bills, you need to understand cost-push inflation.
Cost-push inflation happens when the price of a key input, energy in this case, rises and forces up the cost of nearly everything else produced with it. Unlike demand-driven inflation, it does not need a spending boom to get going. It starts at the supply end and pushes outward.
The dangerous part is the second stage. If households and businesses begin to expect prices to keep rising, they change their behaviour: workers seek higher wages, firms raise prices pre-emptively, and a temporary shock hardens into a self-sustaining spiral.
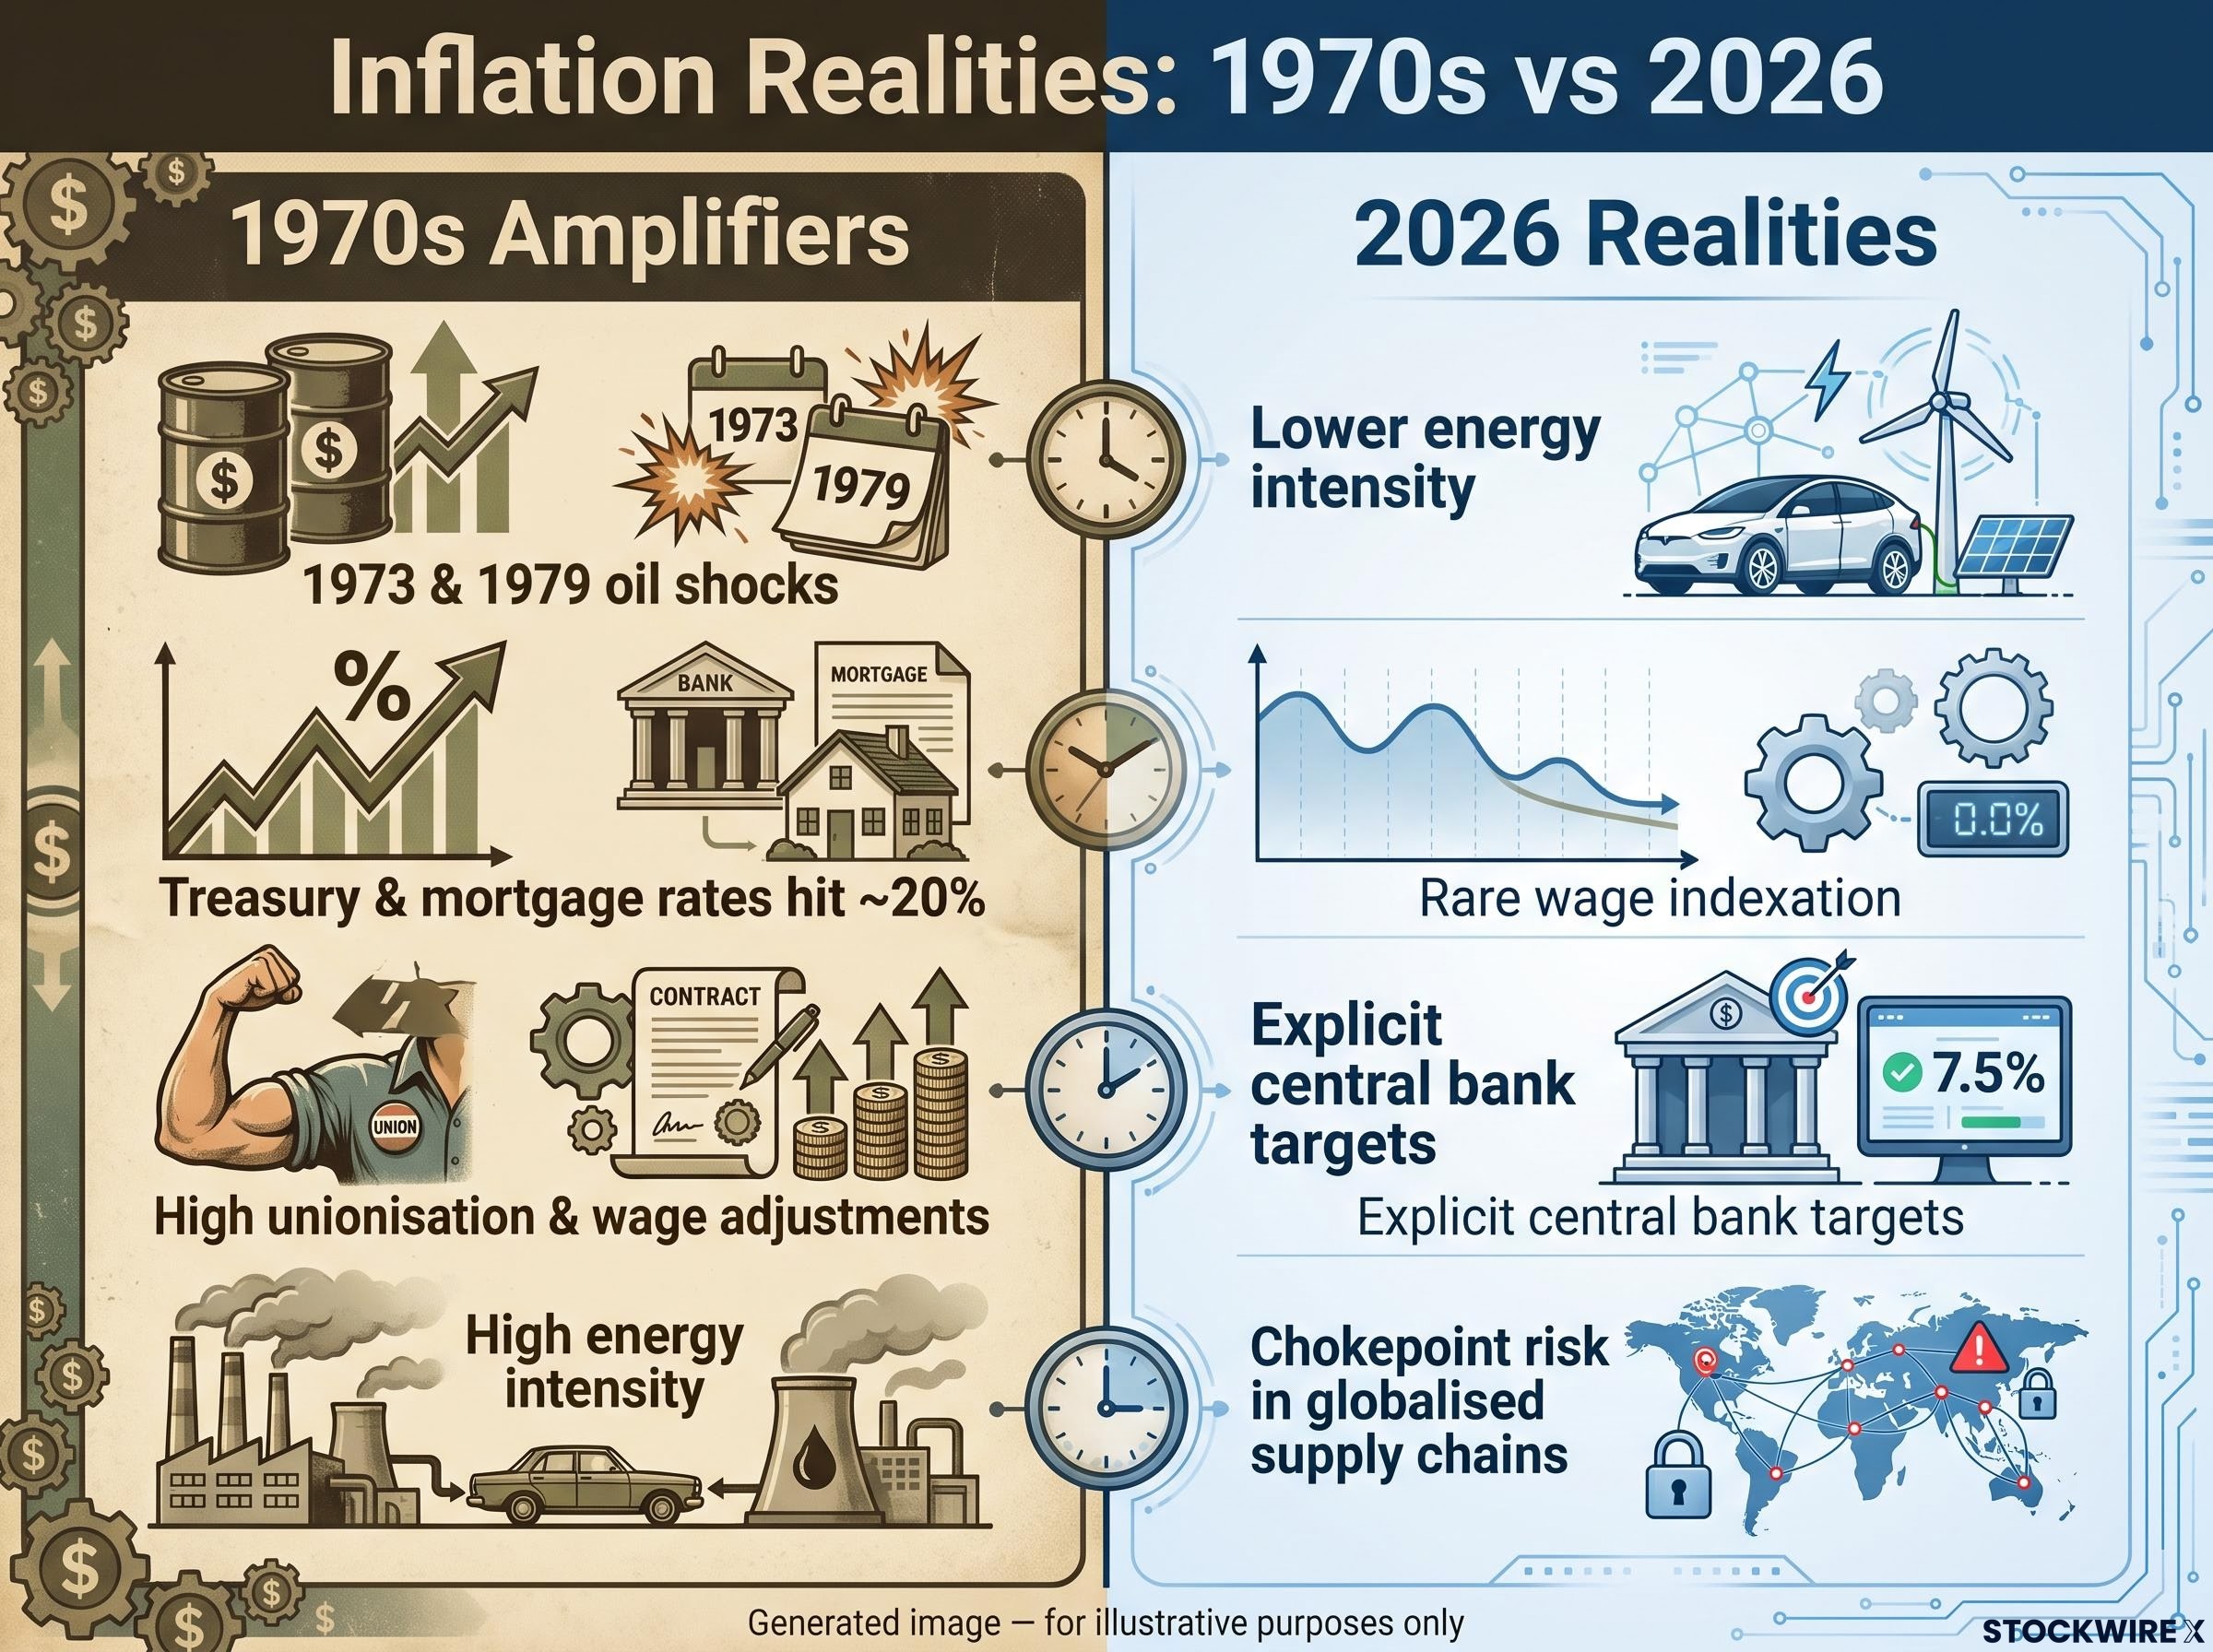
That is the mechanism that defined the 1970s. The oil shocks of 1973 and 1979 fed rapidly into transport, manufacturing, and food costs, and because inflation expectations were never anchored, they became self-fulfilling. The endpoint was brutal: by the time Paul Volcker took over the Federal Reserve, U.S. Treasury yields and mortgage rates had reached roughly 20%, putting housing out of reach for many households.
The link between energy and expectations is not folklore. The original source analysis noted the strong historical correlation between crude oil prices and both 5-year and 10-year inflation expectations, meaning oil moves ripple right across the yield curve.
The 2026 picture is genuinely different, and the differences cut both ways. Here is the contrast between the mechanisms that amplified the 1970s and the structural realities today:
- 1970s amplifiers: high unionisation, widespread cost-of-living wage adjustments, no explicit inflation targets, and very high energy intensity of production, so shocks propagated fast.
- 2026 realities: far lower energy intensity of GDP, rare wage indexation, and credible central banks running explicit inflation targets that anchor expectations.
- The new vulnerability: globalised supply chains concentrate risk in specific chokepoints, so a single disrupted strait or refinery cluster can hit the whole system.
Your portfolio assumptions were mostly built during a four-decade disinflationary era. Understanding this playbook shows you why those assumptions could fail in a supply-constrained world, and it equips you to tell the difference between a temporary price blip and a genuine regime change, the distinction that decides whether your bond allocation is a haven or a liability.
Historical analysis of generational inflation regimes shows that inflationary periods tend to persist for decades rather than years, with all 13 structural forces that drove four decades of disinflation having simultaneously reversed, making a rapid return to the 2% era historically unlikely even once the immediate supply shock passes.
The six-month lag squeezing global agriculture
The energy shock does not stop at the fuel pump. It travels down a chemical supply chain and lands, months later, in the price of food.
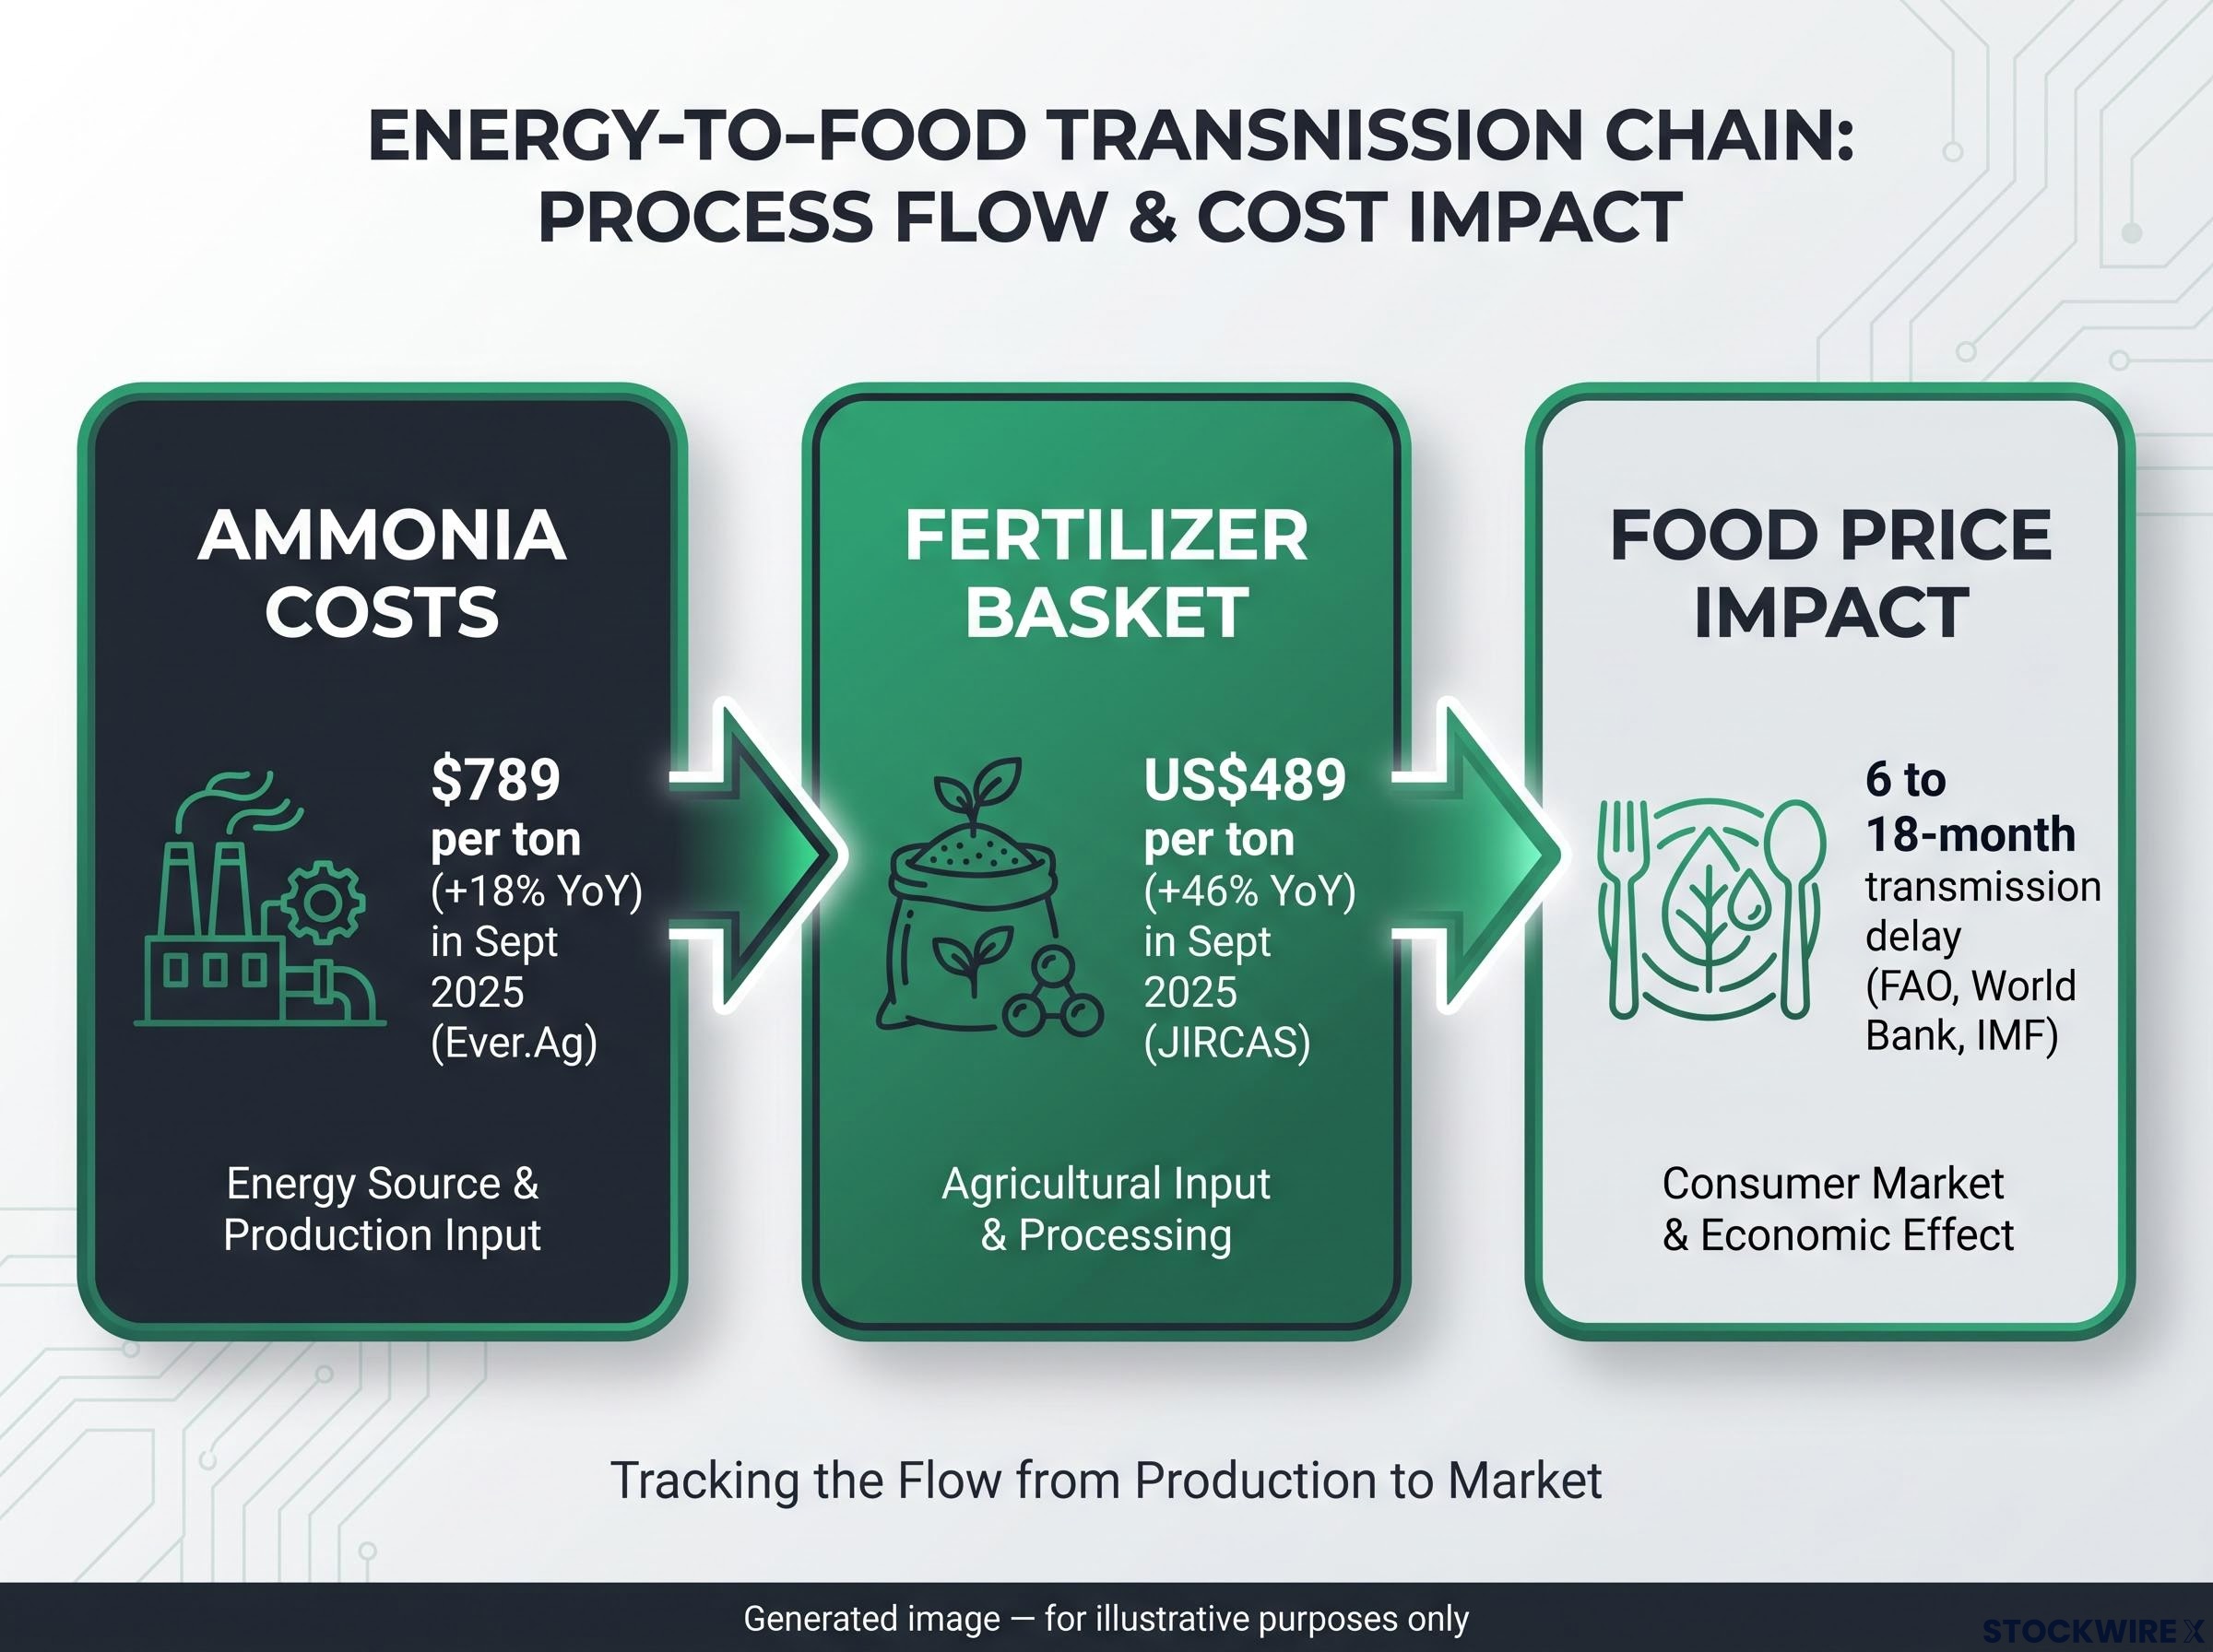
The connection runs through ammonia, the foundational nitrogen fertilizer input. Ammonia is made via the Haber-Bosch process, which uses natural gas as its primary hydrogen feedstock. When gas prices rise, ammonia costs follow directly, and that feeds into urea, UAN, and ultimately what farmers pay to grow a crop.
The numbers already show the strain. Ever.Ag reported anhydrous ammonia at $789 per ton in September 2025, up 18% on the year. A JIRCAS market note found the international export basket of nitrogen, phosphorus, and potassium fertilizers averaging US$489 per ton in September 2025, up 46% year-on-year, with higher natural gas prices flagged as the main driver.
Here is the transmission chain, step by step:
- Natural gas feedstock prices rise, lifting the cost of hydrogen for synthesis.
- Ammonia synthesis becomes more expensive, pushing up urea and UAN benchmarks.
- Farmers face higher input costs at application, most acutely during the Northern Hemisphere spring planting season.
- Higher production costs feed through to retail food prices, with a lag.
That lag is the whole point. FAO, World Bank, and IMF analyses converge on a transmission delay of roughly 6 to 18 months from energy disruption to food price effects, because the fertilizer decision made this spring shows up in yields, and therefore prices, the following season.
Fertiliser supply disruption triggered by the Hormuz closure has already shifted U.S. farmer planting decisions, with acreage moving away from nitrogen-intensive corn toward soybeans and global wheat production forecast approximately 2% below the prior year, an early sign that the energy-to-food transmission chain is producing measurable crop-level effects.
This is why you should stop reading grocery prices as your leading signal. To time defensive exposure to agricultural commodities correctly, watch the upstream fertilizer benchmarks and gas feedstock costs, because they tell you what is coming while retail investors are still reacting to trailing headline food inflation.
The central bank trap and your portfolio
Here is the uncomfortable conclusion this all builds toward: the tool most investors trust to fix inflation cannot fix this kind.
Interest rate hikes cannot drill for oil, reopen a shipping lane, or build a fertilizer plant. This is not a fringe view. It is central bank consensus.
Olivier Blanchard and Ben Bernanke argued in 2022 that monetary policy cannot repair disrupted supply chains or create more fuel; it can only reduce demand until it matches the constrained supply. Isabel Schnabel of the ECB framed energy shocks as acting like a tax on the economy, cutting real income and shifting relative prices, a tax that rate hikes cannot remove but can stop from spiralling into wages.
Monetary policy cannot repair supply chains. It can only suppress demand until it meets the new, lower baseline of available resources, which means the cure for supply-driven inflation is engineered weakness in the wider economy.
That is the trap. To bring headline inflation down when the shock is physical, central banks are forced to destroy aggregate demand rather than create supply, which risks real output and employment losses, often heaviest on lower-income households.
For your portfolio, the read is direct. Because policymakers will hike to crush demand rather than solve scarcity, you should stress test your holdings for stagflation, weak growth alongside sticky inflation, rather than a clean tightening cycle.
That means questioning whether traditional safe havens behave as expected. Bond yields may stay elevated while growth stalls, equity valuations face margin compression from both higher costs and softer demand, and real asset exposure moves from a nice-to-have to a core consideration. Positioning here is about accepting that a painless soft landing may not be on the menu.
Building resilience for a constrained decade
The three threads here are one story. A structural diesel deficit lifts logistics costs across every sector, feeds through gas and ammonia into a delayed food price shock, and lands in an environment where central banks can suppress demand but cannot restore supply.
The practical task is knowing what to watch. Keep an eye on LNG shipping rates and Gulf Coast ammonia benchmarks as early-warning gauges, U.S. diesel export volumes as the pressure valve for global supply, and inflation expectations across the yield curve as the signal for whether a shock is embedding.
The core stance is this: a structurally constrained global economy behaves differently from the disinflationary decades that shaped most portfolios. Adapting to that reality, rather than assuming a return to the old normal, is the decision that matters now.
Traditional safe haven investments, including long-duration government debt and precious metals, are underperforming in the current environment because stagflation punishes fixed-income duration at the same moment it compresses equity multiples, leaving portfolios built on disinflationary assumptions exposed on both sides simultaneously.
This article is for informational purposes only and should not be considered financial advice. Investors should conduct their own research and consult with financial professionals before making investment decisions.
Past performance does not guarantee future results, and any forward-looking scenarios described here are speculative and subject to change based on market and geopolitical developments.