
Two of Australia’s biggest bank stocks are sitting within 46 cents of each other on the ASX right now, paying dividend yields separated by just 3 basis points. On the surface, NAB and ANZ look almost interchangeable for income investors. They are not.
The difference that matters is not the yield figure itself but what percentage of that yield is backed by franking credits. For Australian investors, particularly those inside superannuation or sitting in low tax brackets, franking credits are not a bonus. They are a core component of after-tax return, which means a yield comparison that ignores franking is incomplete by design.
This piece walks through the metrics, the franking mechanics, and the 2026 price divergence, then hands you a clear framework for deciding which stock fits your specific objective: tax-efficient income or total return.
The numbers side by side: how NAB and ANZ compare right now
Line the two banks up on 22 September 2026 and the symmetry is almost eerie. Share prices within half a dollar of each other. Price-to-earnings ratios differing by less than a tenth of a point. Dividend yields separated by three basis points. On nearly every headline metric, the market treats National Australia Bank and ANZ Group as close to identical.
Then one figure breaks the pattern.
| Metric | NAB | ANZ |
|---|---|---|
| Share price (22 Sep 2026) | $38.61 | $38.15 |
| Annual dividends per share | $1.70 | $1.66 |
| Dividend yield | 4.39% | 4.36% |
| Franking | 100% | 75% |
| Price-to-earnings ratio | 19.36 | 19.28 |
| Earnings per share | $2.00 | $1.973 |
| Year-to-date return | -6.5% | +6.9% |
| Market capitalisation | ~$120.37B | ~$115.06B |
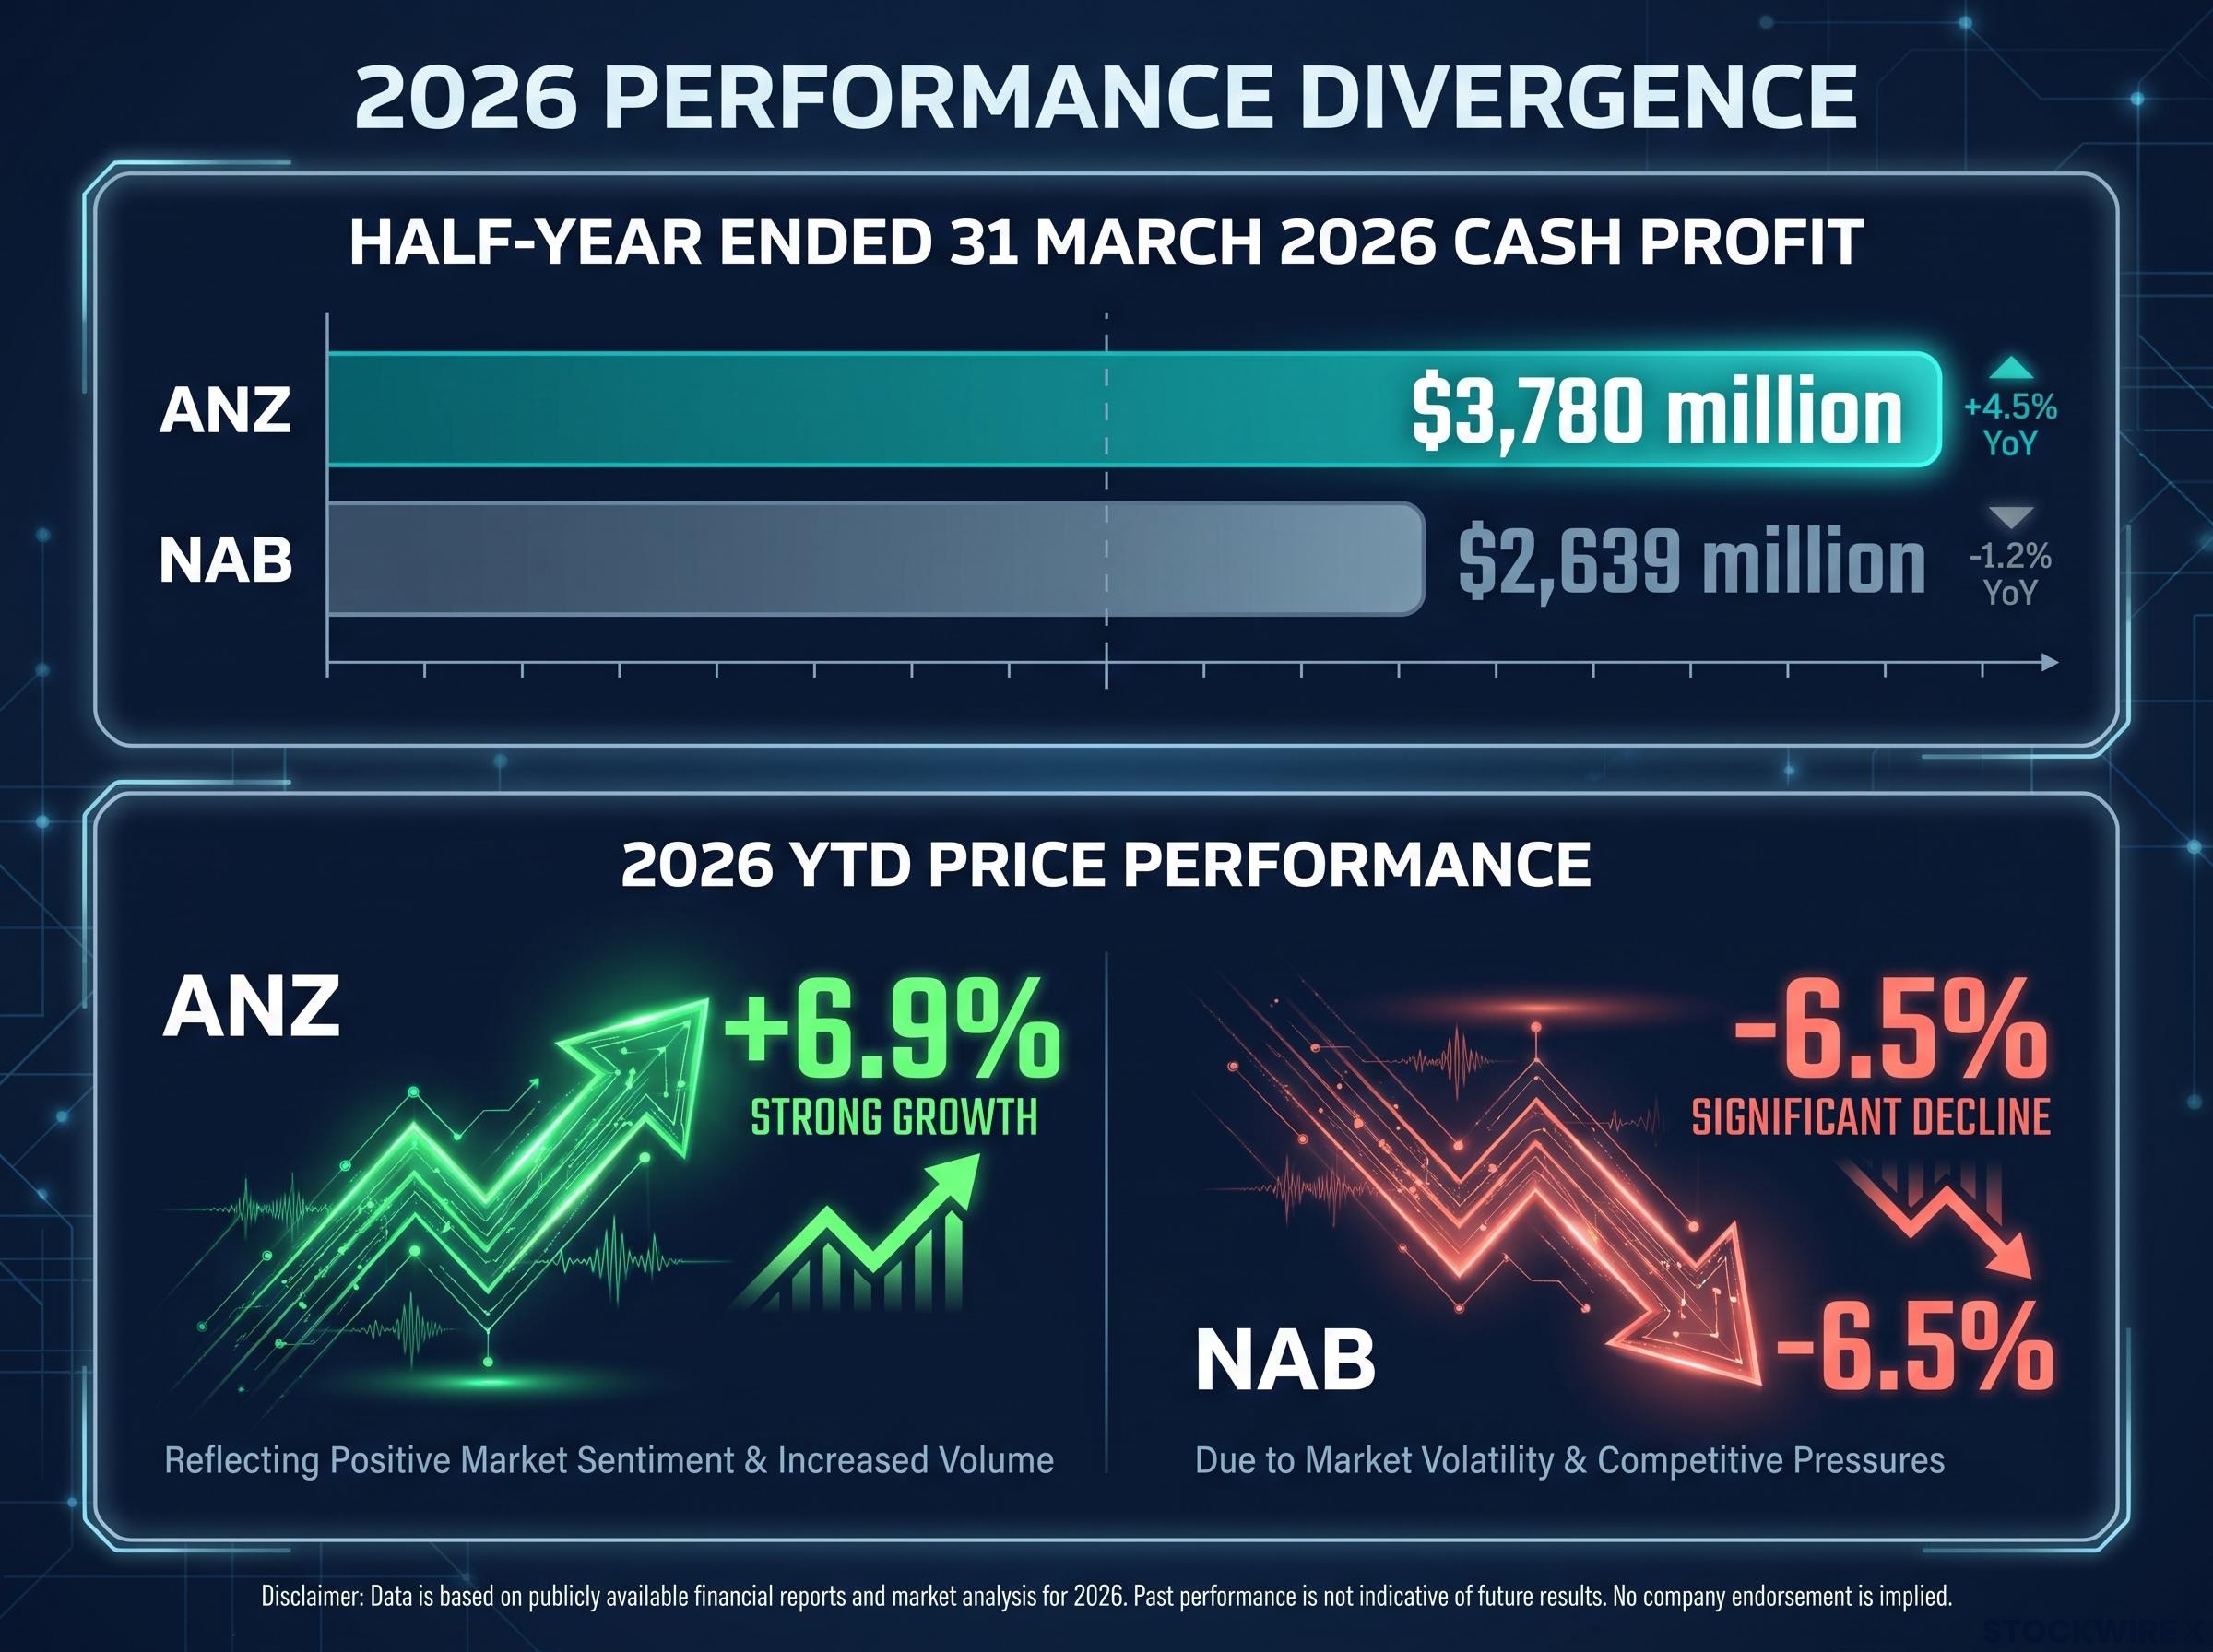
Two figures deserve a second look. The first is the year-to-date return, where the banks split hard: NAB down 6.5%, ANZ up 6.9%. Both landed at nearly the same price by late September, but they arrived by opposite routes over 2026.
On pre-tax yield, the gap between these two stocks is just 3 basis points: 4.39% for NAB versus 4.36% for ANZ. That is close enough to call a tie.
The second figure is franking. NAB pays 100% franked. ANZ pays 75%. That is the number that breaks the otherwise mirror-image picture, and it is the one the headline yield quietly hides.
Here is what the near-identical valuations tell you. The market assigns comparable earnings expectations to both banks, which means the franking differential is not baked into the price. It is a real, unpriced difference in after-tax income that the yield percentage on your brokerage screen will never show you.
When big ASX news breaks, our subscribers know first
What franking credits actually mean for your after-tax return
Your brokerage app shows you a yield. 4.39% next to NAB, 4.36% next to ANZ. What it does not show you is that those two nearly identical numbers can produce meaningfully different amounts of cash in your pocket once the tax office is involved.
The reason is franking.
When an Australian company pays a dividend from profits it has already paid company tax on, it can attach a franking credit to that dividend. That credit represents tax the company has already paid at the 30% corporate rate. As a shareholder, you use it to reduce your own tax bill, and if your tax rate is lower than the company’s, you can receive the difference back as a cash refund from the Australian Taxation Office (ATO).
A fully franked dividend carries the maximum possible credit for every dollar paid. That is NAB’s position: 100% franked.
ANZ’s 75% franking changes the maths. One quarter of every dividend dollar arrives without a franking credit attached. You still receive the cash dividend, but the tax benefit stapled to it is only three-quarters of what a fully franked equivalent would deliver.
The investors most exposed to this gap are the ones who can actually use franking credits in full:
- Individual investors in low tax brackets, whose personal rate sits below the 30% company rate
- Superannuation funds in accumulation phase, taxed at a concessional 15%
- Superannuation funds in pension phase, taxed at 0%, where franking credits convert directly into cash refunds from the ATO
For that last group, the franking gap stops being theoretical. A pension-phase fund holding a fully franked dividend receives the entire franking credit back as cash. Hold the 75% franked equivalent and a quarter of that refund simply never arrives. That is a direct dollar difference, not an accounting nuance.
Why ANZ’s franking rate sits below 100%
ANZ’s franking capacity is tied to where it earns its profits. Franking credits can only be generated on profits taxed in Australia. Earnings booked offshore are not subject to Australian company tax, so they cannot carry Australian franking credits, and ANZ earns a meaningful share of its profit outside the country.
That is the structural ceiling. The good news for ANZ holders is that the rate is moving in the right direction. The bank lifted its franking from 70% to 75% for the 2026 interim dividend, and management was explicit about why.
The increase in franking “reflects the improving performance of the Australian geography,” said Farhan Faruqui, Chief Financial Officer, in ANZ’s investor briefing on 1 May 2026. CEO Nuno Matos made the same point, noting the interim dividend was held at 83 cents while the franking rate rose.
Here is the read for income investors. That 25-point gap to full franking is not a temporary glitch waiting to close. It is a durable feature of ANZ’s earnings mix, and it will only narrow substantially if a larger share of the group’s profit shifts back onto Australian soil. Treat the franking differential as structural, not fleeting.
Share price performance: what 2026’s divergence tells total return investors
Two stocks. Nearly the same price by late September. Opposite journeys to get there.
NAB closed at $38.61 on 22 September 2026, down 6.5% for the year. ANZ closed at $38.15, up 6.9% over the same period. That is a roughly 13-point spread in total price performance between two banks that a headline glance would call twins.
For total return investors, that gap is the whole story. Total return is not just what a stock pays you in dividends; it is income plus capital movement combined. On that measure, ANZ has done the work in 2026 while NAB has gone backwards.
Here is how the two return components stack up for each bank over 2026:
- NAB: income return of roughly 4.39% (dividend yield), offset by a capital return of -6.5% (price decline)
- ANZ: income return of roughly 4.36% (dividend yield), boosted by a capital return of +6.9% (price gain)
ANZ’s stronger showing sits alongside a larger earnings base. In the half-year ended 31 March 2026, ANZ reported cash profit of $3,780 million against NAB’s cash earnings of $2,639 million. The improving Australian operations that lifted ANZ’s franking rate are part of the same story driving its price momentum, though momentum is never a guarantee that the trend continues.
One caution matters here. Past-year price movement is a record, not a forecast. A 6.9% gain in 2026 tells you what happened; it does not promise a repeat.
And this is the interpretive point that ties the section together. Despite ANZ’s larger cash earnings and stronger price run, the market prices both banks at almost identical P/E multiples: 19.36 for NAB, 19.28 for ANZ. That tells you the market sees no structural earnings-quality edge for either bank. Which leaves the franking difference as the genuine active variable for anyone buying these stocks for income.
Which stock fits your portfolio: a framework for making the call
You have the metrics and the mechanics. The decision now comes down to one question: what do you actually want this holding to do for you?
Two investor profiles point in two different directions.

The income-first investor wants tax-efficient cash flow, especially inside a low-tax or superannuation structure where franking credits are refundable. For that investor, the case for NAB is concrete:
- 100% franking delivers the maximum after-tax income per dividend dollar, a structural advantage that compounds inside super
- A slightly higher annual payout at $1.70 per share versus ANZ’s $1.66, on a marginally higher yield of 4.39%
- A long, consistent dividend record that income portfolios value for predictability
The total return investor weights capital appreciation alongside income and is willing to trade some franking efficiency for growth. For that investor, the case for ANZ is equally concrete:
- Stronger 2026 price performance, up 6.9% while NAB fell 6.5%
- A larger cash earnings base at the half-year ($3,780 million versus NAB’s $2,639 million)
- A franking rate moving in the right direction, from 70% to 75%, which offers a modest catalyst if Australian earnings keep improving
One caveat on the framework. No broker consensus price targets were available from current research sources, so this comparison rests on reported metrics rather than forward estimates. Nobody here is projecting where either stock trades next year.
A yield comparison that ignores franking is incomplete by design. The number on your screen is only the pre-tax half of the story.
For most Australian resident investors buying for income, particularly those holding bank stocks inside superannuation, the franking differential tilts the decision toward NAB at current pricing. ANZ’s case rests primarily on capital appreciation that has already happened in 2026, rather than on a superior forward income profile.
This article is for informational purposes only and should not be considered financial advice. Investors should conduct their own research and consult with financial professionals before making investment decisions. Past performance does not guarantee future results, and financial projections are subject to market conditions and various risk factors.
NAB or ANZ? Where the franking math points for income investors
Strip the comparison back to its core and one variable does the deciding. On pre-tax yield, these two banks are effectively tied at 4.39% versus 4.36%. On after-tax income for Australian resident investors, NAB’s 100% franking against ANZ’s 75% creates a structural advantage that does not disappear at current prices.
That is the answer for the income-first investor. NAB delivers more usable income per dollar of dividend, and the gap is widest exactly where it matters most: superannuation funds in pension phase, where the missing 25% of franking credits is cash that never reaches the fund.
ANZ still has a legitimate case, just a different one. If your objective weights capital appreciation over tax-efficient income, ANZ’s 2026 price performance and larger earnings base are real considerations rather than consolation prizes.
The variable to watch for anyone holding or considering ANZ is its franking trajectory. The rate rose from 70% to 75% in the first half of 2026, and further Australian profit growth could push it closer to 100%, narrowing the income gap that defines this comparison today.
Until that happens, the franking math points to NAB for income.