AUD/USD has spent the last 48 hours doing something technically significant: pressing against its 200-day moving average from above, while the Australian labour market just delivered its strongest monthly employment gain since before July’s contraction, and the RBA’s next rate decision sits five days away with a market-implied hike probability of 86-90%. Three forces, all live, all pointing in different directions.
The tension here is not accidental. Strong domestic jobs data and near-certain RBA tightening should, in theory, lift the Australian Dollar. Yet broad USD appreciation has dominated the same window, and the technical picture is genuinely ambiguous depending on which framework you apply.
For anyone tracking the currency pair, this is a moment where the usual rules-of-thumb fail to give a clean answer. This piece maps each competing force clearly, explains how they interact, and identifies what to watch in the days and weeks ahead for a more decisive read on where AUD/USD is likely to resolve.
What the jobs data actually says, and what it does not
Start with the headline, because it is genuinely strong. The Australian Bureau of Statistics (ABS) reported a net employment gain of +39,500 for August 2026, published on 24 September 2026. That nearly doubled the consensus forecast of +20,000 and reversed the prior month’s contraction of -15,800. On its own, that print reads as unambiguous labour market strength.
The July labour market contraction, which shed 15,800 jobs against a consensus forecast of a 12,000 gain and collapsed September hike odds at the time, makes the August rebound to +39,500 a sharper reversal than the headline alone conveys.
Then the unemployment rate complicates the story. It rose 0.2 percentage points to 4.6%, the highest level since late 2021 and above the RBA’s own year-end projection of 4.5%. A strong jobs number sitting alongside rising unemployment looks contradictory until you examine what produced it.
The answer is labour force expansion. The workforce grew by 67,700 in August: 39,500 found employment while 28,200 new entrants began actively seeking work. More people looking for jobs, faster than jobs were created, pushes the unemployment rate up even as employment climbs.
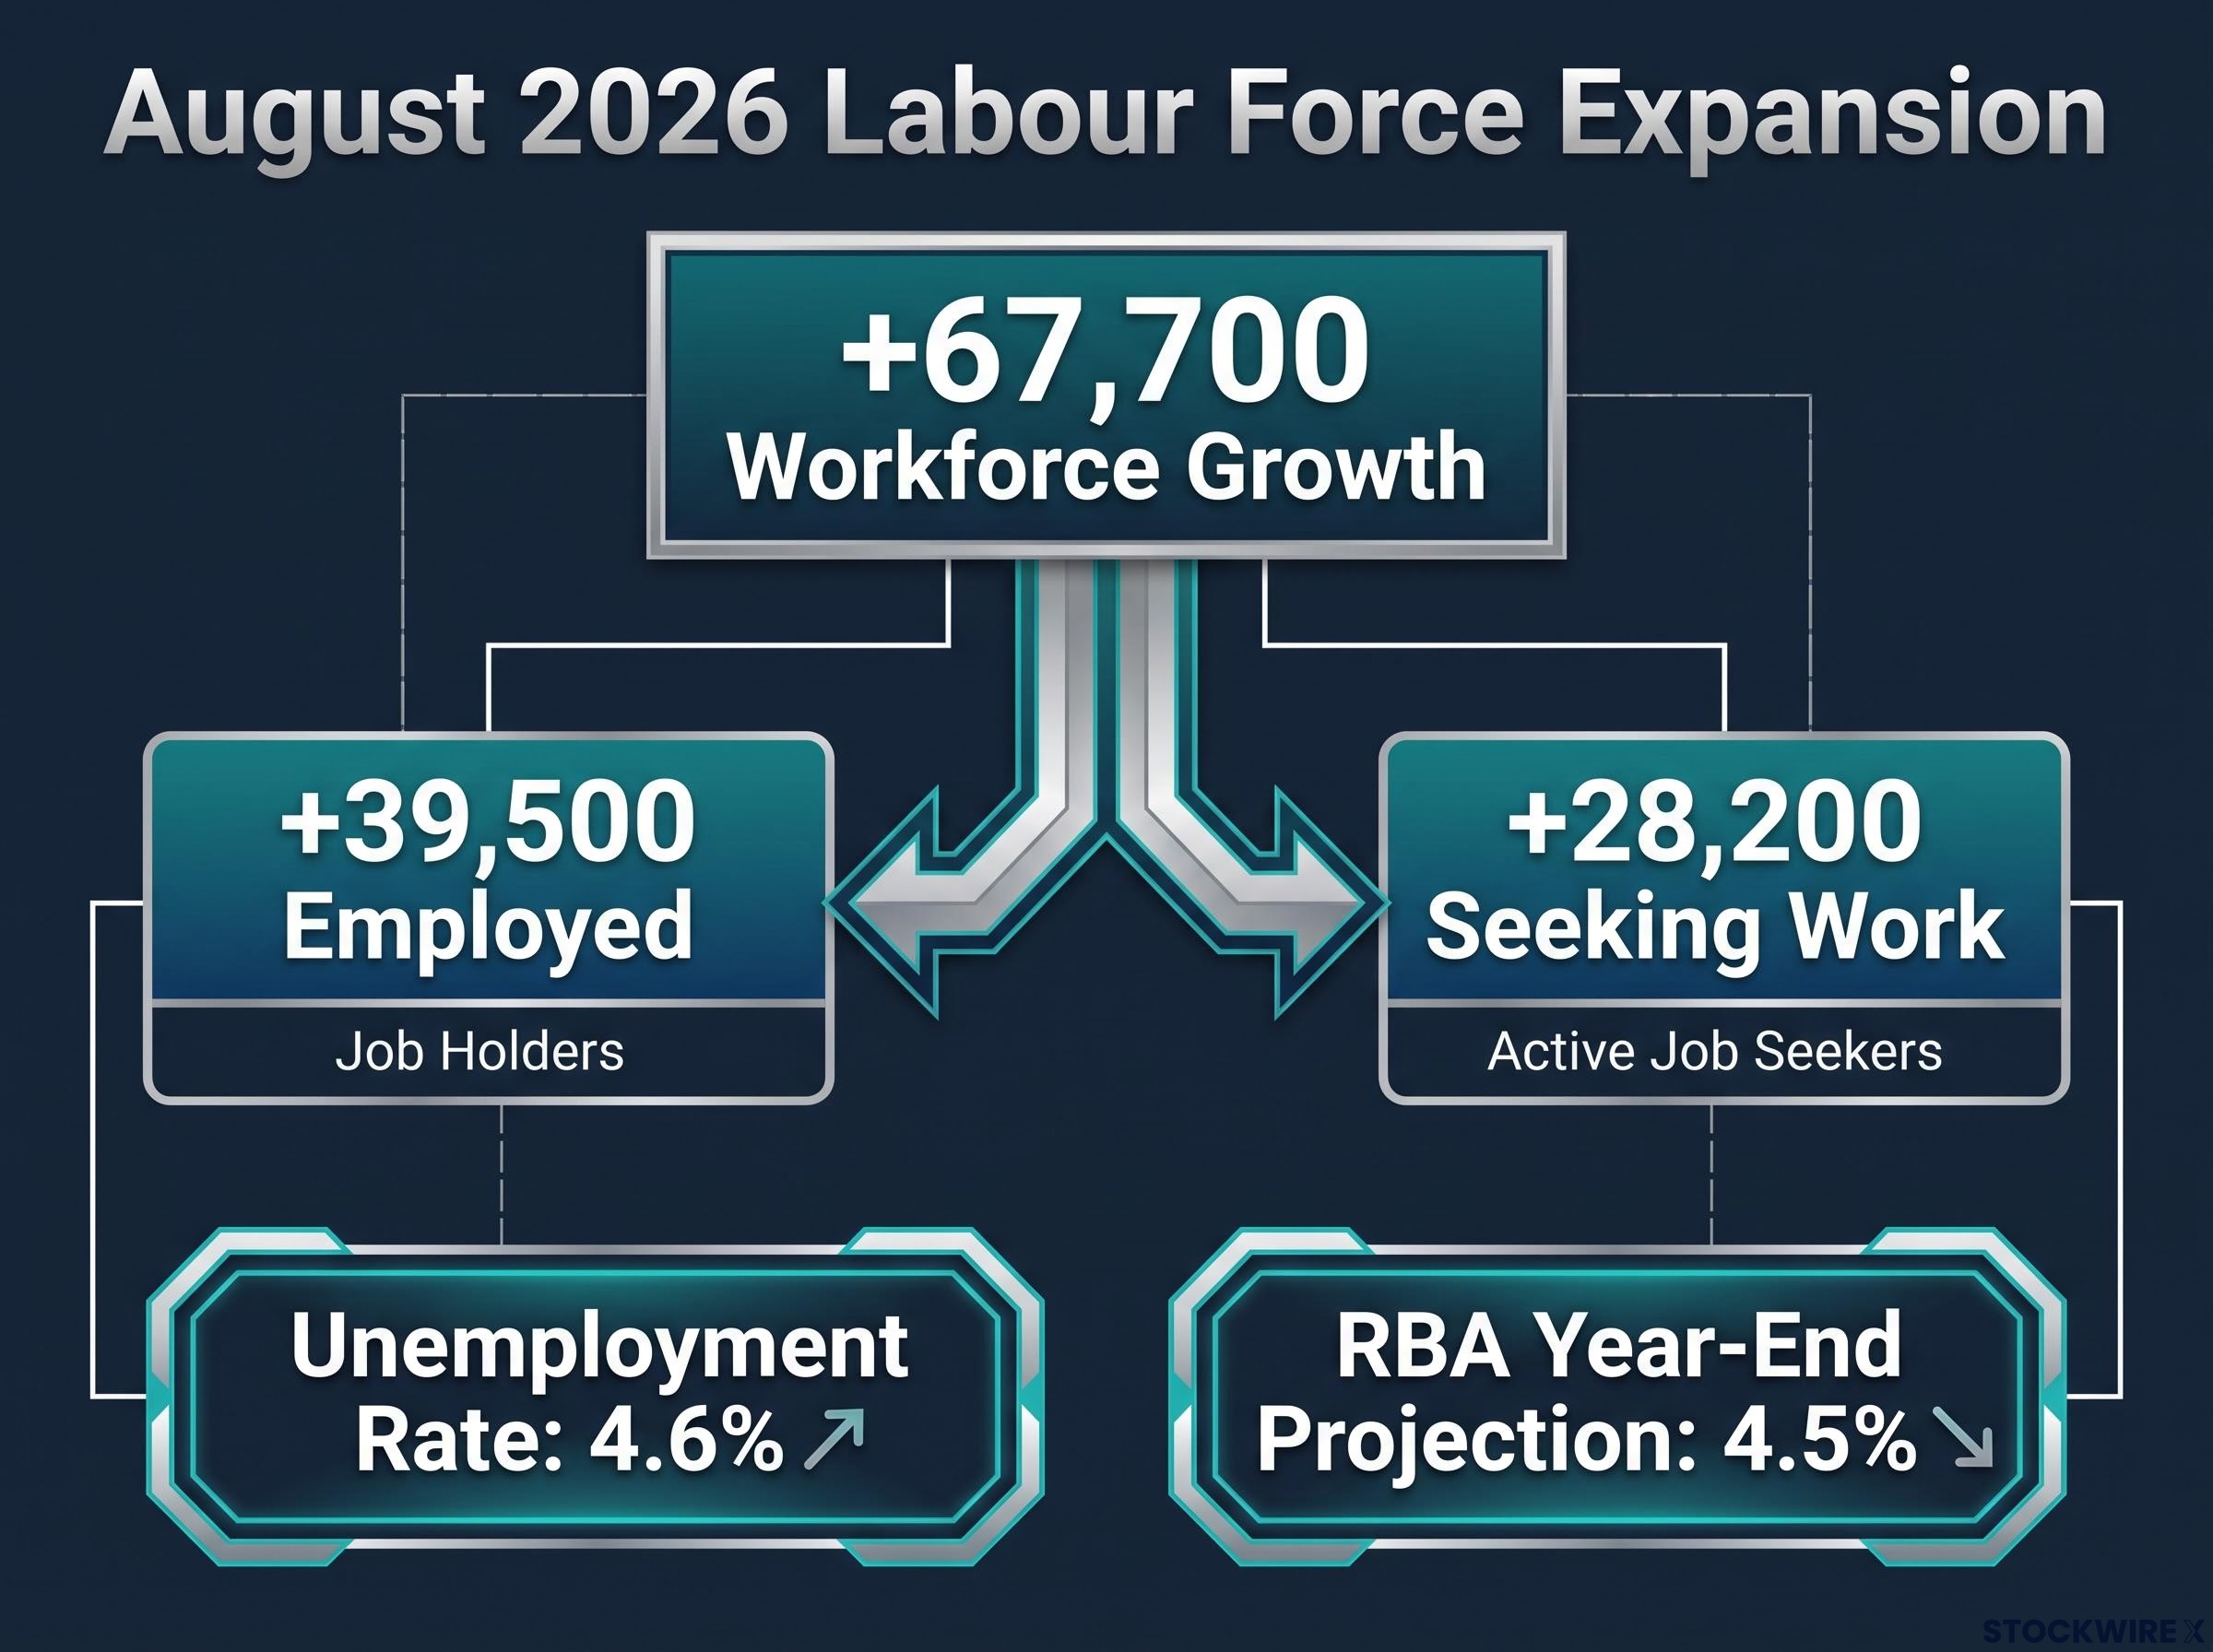
ABS head of labour statistics Sean Crick confirmed that the rise in unemployment reflected more people entering the labour force to look for work, not a wave of outright job losses.
| Metric | August 2026 | Change | Consensus / Prior | Significance |
|---|---|---|---|---|
| Net employment change | +39,500 | Reversal from -15,800 | Consensus +20,000 | Beat forecast by nearly double |
| Unemployment rate | 4.6% | Up 0.2 ppt | Above RBA target 4.5% | Highest since late 2021 |
| Participation rate | 67.1% | Up 0.2 ppt | Rising | Labour force expanding |
| Labour force growth | +67,700 | 39,500 employed, 28,200 seeking | Prior contraction | Explains rising jobless rate |
Composition adds one more layer. Roughly 45,800 of the new roles were part-time, a reversal of the part-time contraction seen in July. That does not make the rebound weak, but it tempers how much quality you should read into the headline.
The net read for RBA policy is not as clean as the top-line number suggests. Employment surprised sharply to the upside, which supports tightening, yet unemployment overshooting the RBA’s own target signals a labour market that is loosening at the edges. Both things are true, and that is precisely why the currency response has been muddled.
When big ASX news breaks, our subscribers know first
How central bank policy divergence moves a currency pair
Currency pairs move on the gap between two central banks, so start with the numbers. The RBA cash rate currently sits at 4.35%. If the meeting on 29 September 2026 delivers the widely expected quarter-point hike, it climbs to 4.60%. Markets put that outcome at 86% on CentralBank.watch (24 September 2026) and closer to 90% in analysis from Brown Brothers Harriman via FXStreet.
Elias Haddad of Brown Brothers Harriman frames the narrowing gap between the RBA and the US Federal Reserve as a support mechanism for the Australian Dollar. When the RBA moves closer to, or above, the Fed in rate terms, the relative yield advantage that has favoured USD begins to erode. The question is how that spread actually transmits into price.
There are three channels, and the current RBA-Fed dynamic runs through all of them:
- Interest-rate differentials and uncovered interest parity (UIP): Higher nominal and real yields on AUD assets raise the expected return to holding them, so a wider RBA-over-Fed margin draws capital toward the Australian Dollar when investors believe the yield gap will be sustained.
- Carry trade and portfolio rebalancing: Investors borrow in lower-yield currencies and hold higher-yield ones, so improved AUD carry attractiveness, as divergence narrows in Australia’s favour, pulls in speculative and portfolio flows.
- Rate expectations and the futures curve: What matters is the expected path, not just today’s rate, so a Fed seen as ending its cycle while the RBA hikes shifts forward differentials toward AUD.
Read together, these channels explain why a September hike is, in theory, AUD-positive. The rate is higher, the carry improves, and the forward curve tilts Australia’s way. But the framework has limits, and treating it as a standalone predictor is where analysis goes wrong.
Where the framework breaks down
The first failure mode is USD safe-haven demand. In risk-off episodes, capital rushes into US assets regardless of yield spreads, and AUD/USD can fall even when the RBA offers the better rate. Rate logic simply gets overridden by fear.
USD safe-haven demand intensified in the same window, with the DXY breaking above 100 for the first time in seven weeks as a unanimous Fed hike, a 30-basis-point dot-plot revision, and Middle East geopolitical risk converged to produce broad dollar appreciation across every major currency pair.
The second is commodity and China shocks. Australia’s terms of trade are tied to iron ore, coal, and LNG, so a downturn in Chinese industrial demand can drive AUD moves that dwarf any rate-differential effect.
The third is the empirical instability of UIP itself. Exchange rates frequently deviate from what rate spreads predict, and carry trades can unwind violently when volatility spikes, reversing the very flows that supported AUD. The lesson for you is precise: rate differentials are necessary but not sufficient, and the same maths that makes a hike bullish can be swamped by forces the RBA does not control.
Reading the technical picture when signals conflict
The chart is where the ambiguity becomes visible, because two credible frameworks disagree on the single most-watched level. That disagreement is not an error to dismiss. It reflects genuine methodological variation in how the 200-day moving average is calculated.
On the InvestingLive and Pluang frameworks, the 200-day MA sits near 0.701-0.702 and is rising, with spot trading just above it around 0.703-0.704 on 23-24 September 2026. In that reading, the pair is holding above dynamic support and the medium-term bias stays constructive. Investing.com, by contrast, places the 200-day MA higher at 0.7111 and flags a systematic “Sell” signal, which puts spot below the long-term average and the trend pointed toward USD strength.
| Framework | 200-day MA level | Spot vs MA | Signal implication |
|---|---|---|---|
| InvestingLive / Pluang | ~0.701-0.702 (rising) | Spot above | Constructive medium-term bias |
| Investing.com | 0.7111 (Sell signal) | Spot below | Bearish, USD-favoured trend |
| Summary | Contested zone | Straddling | Technically sensitive, framework-dependent |
The 200-day moving average matters because it represents the long-term trend: the average price over roughly the past year, which traders use as a boundary between an uptrend and a downtrend. A brief intraday dip below it carries little weight. A decisive daily or weekly close below it carries a great deal.
Moving average signals carry well-documented lag because the 50-day can only cross the 200-day after prices have already trended in the new direction for weeks, which is precisely why the contested 200-day MA zone in AUD/USD produces genuinely different reads across frameworks using different calculation methodologies.
Pluang also notes the 50-day MA at 0.70886, with spot trading below that shorter-term line, which tells you near-term momentum has already softened even where the longer-term picture stays intact.
AUD was the biggest single-session mover against the USD at -1.02% on 23 September 2026, per InvestingLive, underscoring the scale of recent US Dollar pressure.
Here is what the conflicting readings tell you. AUD/USD is sitting in a contested zone rather than resting on a clean support line, and the interpretation depends entirely on which framework a given trader uses. A decisive close below the 200-day MA area, confirmed by momentum and volume, would be read as a trend reversal and could trigger stop-loss flows that accelerate the move.
Australia’s structural commodity story and the long-term AUD case
Step back from the daily chart and a different argument comes into view, one that operates on years rather than days. Elias Haddad of Brown Brothers Harriman identifies Australia’s commodity positioning as a durable structural tailwind for the Australian Dollar, distinct from the near-term rate-differential case.
The tailwinds he points to cluster in three areas:
- Energy: Australia’s LNG and resource exports keep it tied to global energy demand, giving AUD a terms-of-trade bid when energy markets tighten.
- AI infrastructure-linked resources: Materials feeding the buildout of data centres and computing infrastructure add a newer source of structural demand for Australian output.
- Defence: Rising defence-linked industrial activity offers another channel of durable, policy-independent support.
The point for a longer-horizon investor is that this structural bid provides a floor that pure rate analysis misses. Commodity exposure can support AUD even in windows where the RBA-Fed spread offers little. But that floor is conditional, not guaranteed, because the same export concentration that supports AUD also exposes it. Australia’s basket leans heavily on iron ore, coal, and LNG, which routes Chinese industrial and property demand directly into AUD valuation.
Historical episodes that illuminate the current setup
The bullish precedent is 2010-2011. The RBA cash rate sat well above the near-zero Fed, and strong commodity prices plus robust China demand pushed AUD/USD above parity. That episode shows how wide positive rate differentials and favourable terms of trade can compound. The caveat matters, though: global growth and Chinese demand were materially more robust then than now, so the same mechanism may produce a more constrained result today.
The bearish precedent is the 2013-2015 taper period. As the Fed normalised policy after quantitative easing, USD strength became the dominant global theme and AUD/USD fell sharply despite its prior carry appeal. Softening commodity prices and RBA cuts amplified the decline. It is the clearest reminder that a USD-dominant cycle can override Australia’s yield and terms-of-trade advantages entirely.
Where AUD/USD resolves from here: the variables that will decide it
Four analytical layers now converge into a single watchlist. The labour data is mixed, the policy divergence is narrowing, the technical picture is contested, and the structural case is real but conditional. The next few weeks will sharpen which force wins, and three specific events do the sharpening.
- The RBA decision on 29 September 2026: A 25bp hike as priced confirms the carry and divergence narrative and is broadly AUD-supportive; a hold against 86-90% market pricing would likely trigger a sharp AUD sell-off as positioning unwinds.
- A daily or weekly close relative to the 200-day MA zone (~0.701-0.702): Sustained trading above it preserves the constructive medium-term bias; a decisive close below it shifts the technical read toward USD-dominant trend continuation.
- China demand and commodity price trajectory: Firm iron ore, coal, and LNG demand reinforces the structural floor and supports AUD; material deterioration undercuts it regardless of what the RBA does.
With the hike priced at 86-90%, the asymmetry sits on the downside. Delivery is already in the price, so a hold carries far more capacity to move AUD lower than a hike does to move it higher.
Elias Haddad’s reduced-divergence support argument is contingent on the hike actually arriving. If it does, the framework holds and the narrowing gap with the Fed becomes a genuine AUD tailwind. If it does not, the same framework flips into a headwind almost overnight.
The balance of forces and what informed watchers do next
The core tension is straightforward to name even if it is hard to resolve. The bullish case rests on RBA carry and Australia’s commodity positioning; the bearish case rests on USD dominance and a domestic labour market loosening at the edges. Both are live, and the meeting on 29 September 2026 is the nearest event that will begin to separate them.
This is a moment for watching rather than concluding. The three variables identified above, the RBA outcome, the 200-day MA close, and China demand, are the right filter for reading whatever data lands next. Each maps to a clear directional implication, which is more useful than any single forecast.
Over a longer horizon, Australia’s structural commodity positioning gives AUD a durable fundamental argument. But it runs on a different clock than the technical and policy-cycle forces currently in play, and separating the two is the whole task.
For investors wanting to stress-test the USD safe-haven scenario in more detail, our deep-dive into AUD/USD and geopolitical risk examines how Strait of Hormuz escalation asymmetrically skews the pair’s risk distribution toward the downside even when domestic fundamentals are supportive.
This article is for informational purposes only and should not be considered financial advice. Investors should conduct their own research and consult with financial professionals before making investment decisions. Past performance does not guarantee future results, and financial projections are subject to market conditions and various risk factors. These statements are speculative and subject to change based on market developments.