
Here is the trader habit that costs the most money: you spot a market falling hard, you feel certain it has gone too far, and you buy. Or it rips higher, you sense a top, and you short. Both times, you are guessing.
The problem is that markets are efficient at hunting the exact levels where your intuition tells you to place a stop. Price sweeps just past an obvious high or low, triggers a cascade of orders, and then reverses without you.
Institutional desks and algorithmic systems do not play that game. They do not guess where a trend ends. They calculate zones where the odds of exhaustion are high, places where several independent structural signals point to the same spot at the same time.
This is the foundation of a disciplined trade reversal strategy: a rules-based method that treats a trend’s likely ending as a mathematical estimation rather than a feeling.
Here is the framework for objectively identifying when a trend is likely to run out of fuel. It combines three technical layers into one checklist, so you stop reacting to price and start anticipating where it is most likely to react to you.
Understanding the three pillars of structural exhaustion
If technical analysis feels like an overwhelming pile of jargon, the fix is to stop treating each tool as a separate skill and start seeing how three of them work together as a filter.
The framework rests on three pillars, and each one answers a different question. Fibonacci extensions tell you where price might exhaust. Elliott Wave structure tells you what the trend is doing right now. Prior swing levels tell you where price is most likely to react.
Fibonacci extension levels are not magic barriers that price bounces off automatically. They are proportional measurements of prior price swings, and markets tend to move in these ratios because retail traders, institutions, and algorithms are all watching the same levels at once. That shared attention is what causes supply and demand to cluster there.
Fibonacci extensions are proportional measurements derived from the same mathematical sequence that governs retracement levels, and the Golden Zone spanning 50% to 61.8% retracement is widely regarded as the highest-priority pullback range before a trend resumes.
The core levels worth tracking are 127.2%, 161.8%, 261.8%, and 361.8%. For identifying major exhaustion zones, the 161.8% and 261.8% extensions do most of the work, partly because they double as standard Elliott Wave targets.
Elliott Wave Theory maps price into cycles. A standard trend moves in a five-wave impulse followed by a three-wave correction. Within that structure, Wave 3 often targets 161.8% of Wave 1, and a corrective Wave C frequently reaches a 161.8% extension of Wave A.
The signal that matters most for reversals is the 5-5 pattern. When a major trend ends, the counter-move develops as a five-wave structure rather than the usual three, typically projecting to around 261.8% in the opposite direction.
That requirement protects you. Demanding a full five-wave counter-move means the market must prove it intends to change direction fundamentally, which keeps you from buying a temporary pullback and mistaking it for a genuine bottom.
| Tool | Primary function | What it shows you |
|---|---|---|
| Fibonacci extensions | Targeting | Probable exhaustion points |
| Elliott Wave | Sequencing | Trend maturity and direction |
| Prior swings | Liquidity | Zones where price is likely to react |
Once you see how these overlap, you stop reading charts as isolated patterns and start seeing the liquidity mechanics underneath. That shift is what separates a disciplined process from reactive gambling.
Why prior swing levels act as magnets
Old highs and lows pull price toward them because they hold trapped orders. A previous swing low often contains buyers who entered there, while a prior swing high traps short sellers who bet on a top.
When price returns to those levels, that trapped money creates pressure. Traders who shorted near a prior high face mounting losses as price climbs, and many exit near their entry, generating buy orders that fuel the move.
Breaks of these thresholds trigger stop cascades. Shorts covering above a prior high, for example, produce the sharp, sudden reactions you often see at these exact points. A former resistance level, once broken, tends to convert into support, which is why these zones matter on both sides of a trade.
When big ASX news breaks, our subscribers know first
Executing the four-rule setup sequence
The framework only works if you can open a chart and run it the same way every time. Here is the exact sequence.
First, draw the Fibonacci tool correctly, because an incorrect anchor makes every level meaningless. To measure upside exhaustion, anchor at the swing low, then the swing high, then return to the original swing low. Reverse the order for downside exhaustion.
Use a pivot high/low indicator to identify exact swing points rather than eyeballing them, and input the levels numerically on platforms that allow it. Precision here removes the subjectivity that ruins most setups.
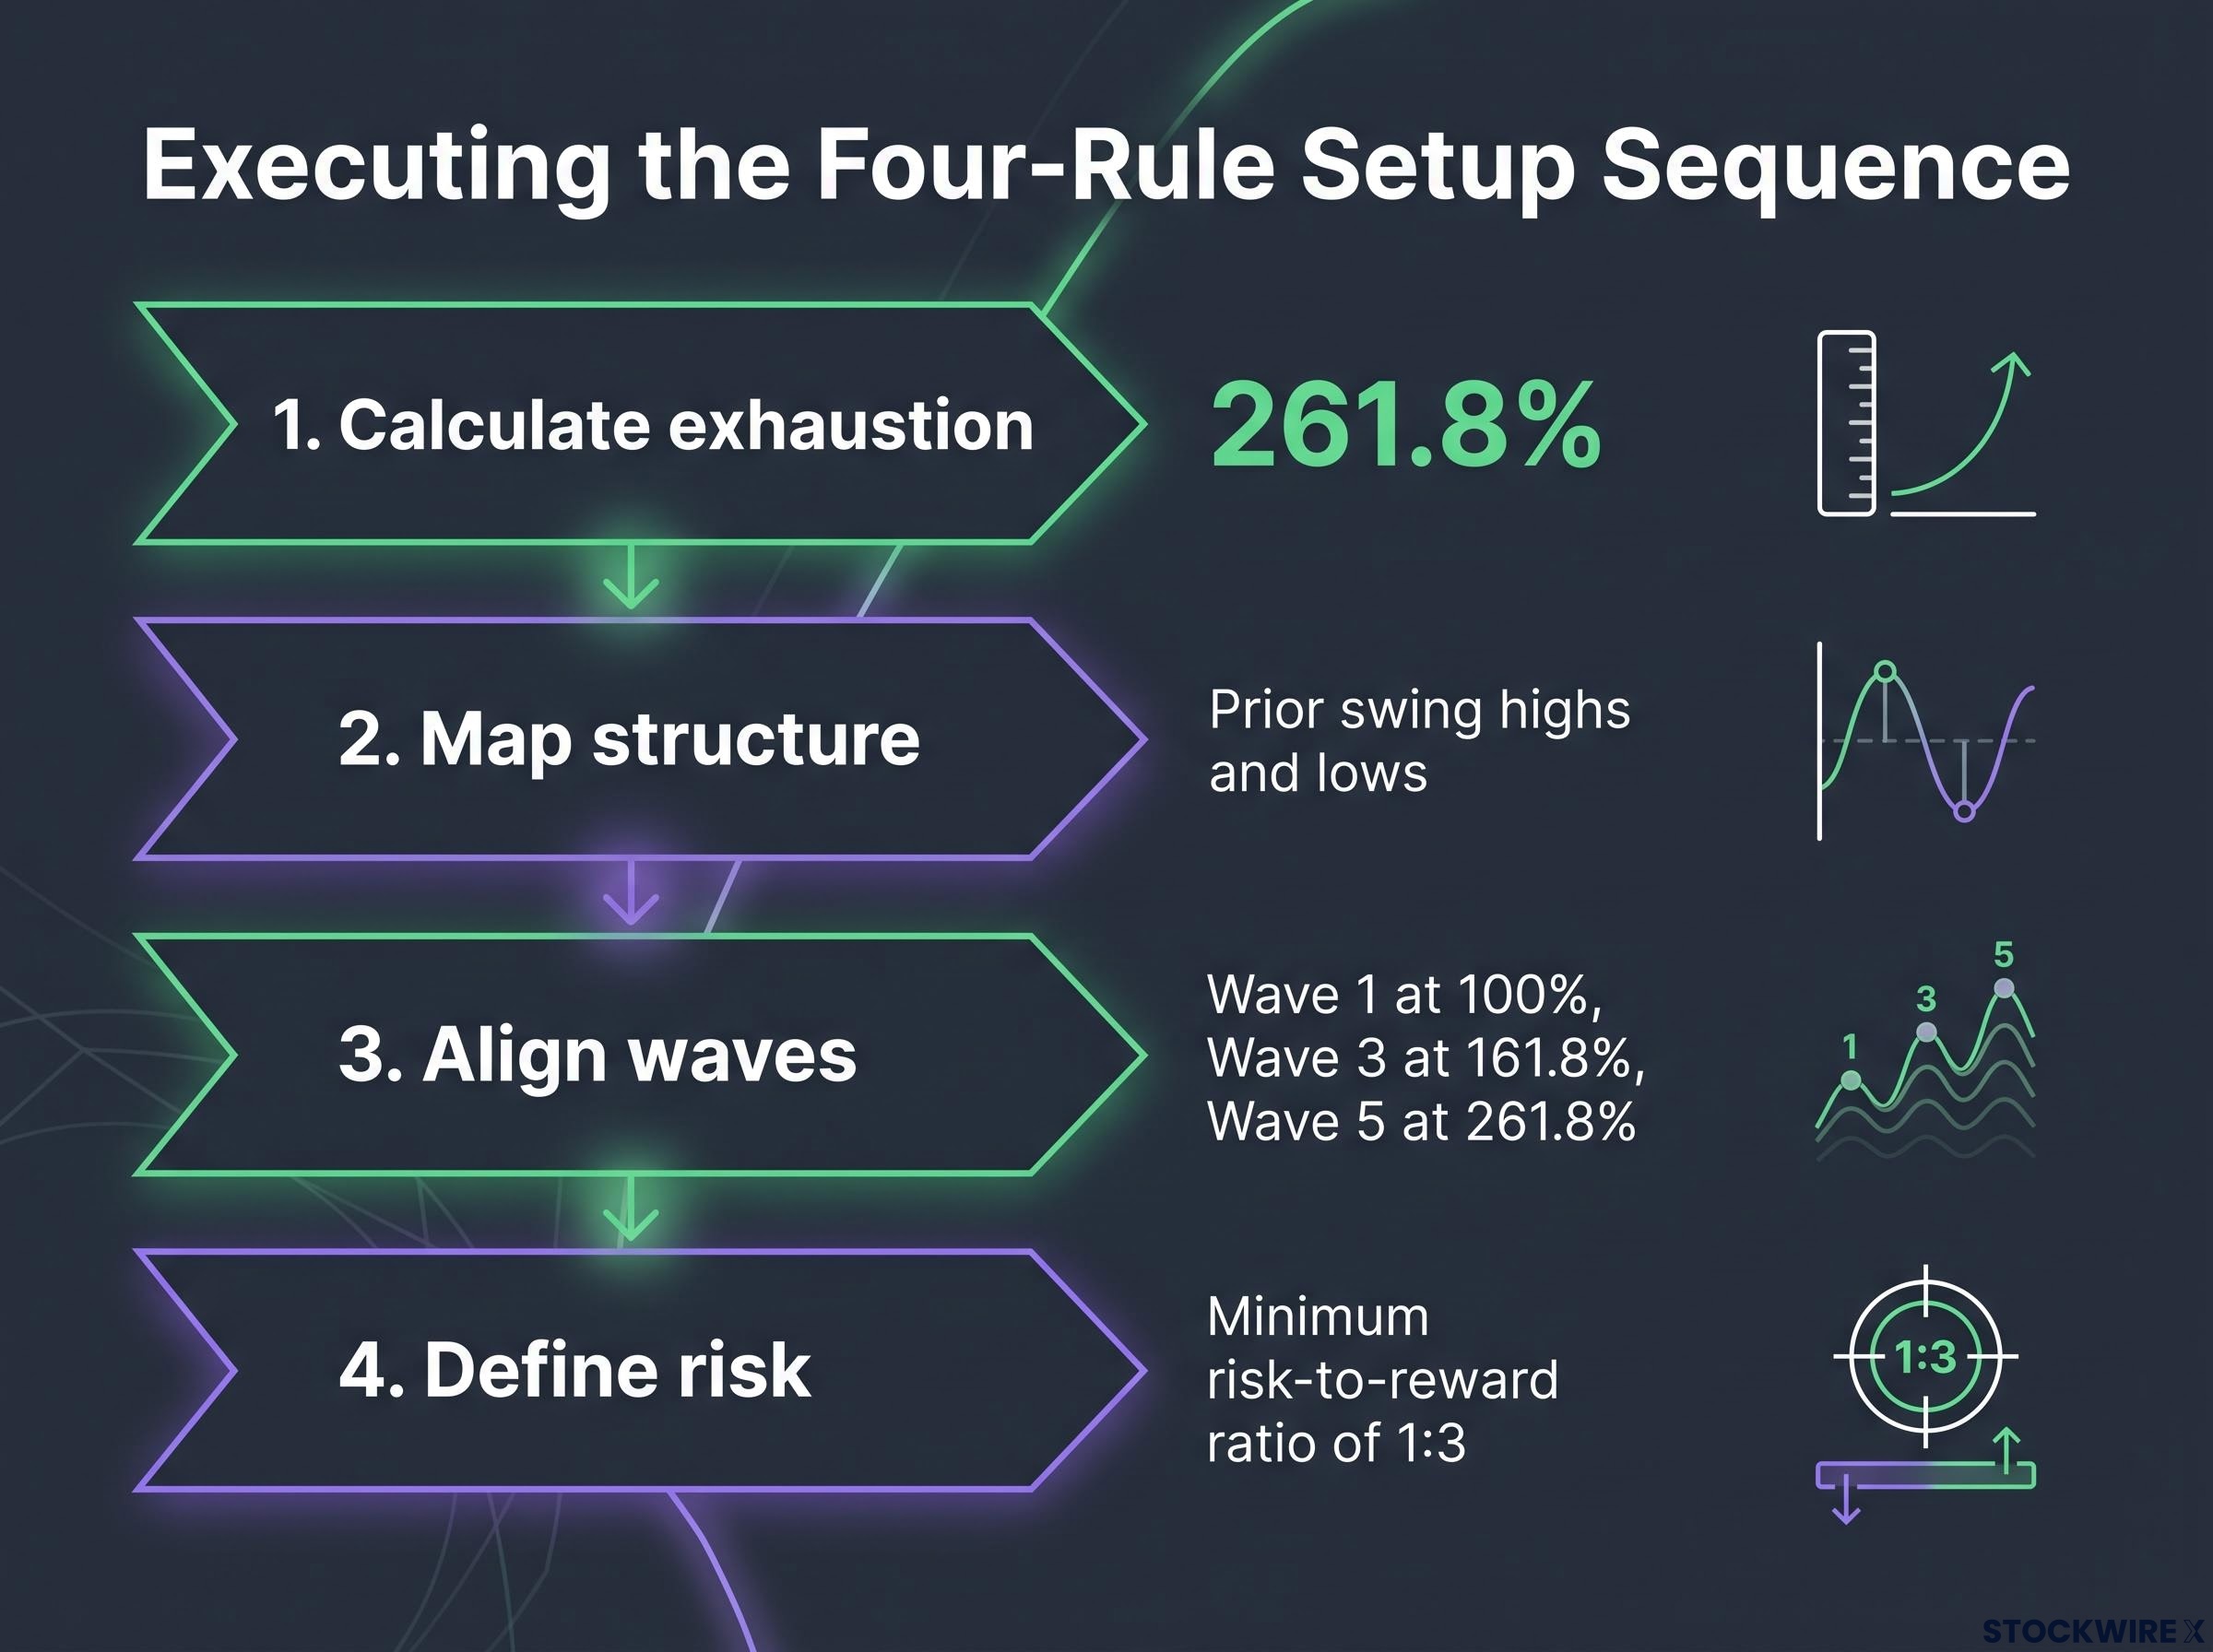
The routine breaks into four steps:
- Calculate exhaustion. Identify the 261.8% extension using a pivot tool, and anchor this level as your primary exhaustion target.
- Map structure. Mark relevant prior swing highs and lows, ideally with a horizontal mirror tool so those levels stay visible when you switch timeframes.
- Align waves. Find at least two prior pivot reference points that line up with Wave 1 at 100%, Wave 3 at 161.8%, or Wave 5 at 261.8%.
- Define risk. Set entry, stop-loss, and target using a minimum risk-to-reward ratio of 1:3.
Reaching a Fibonacci level does not confirm a reversal. When price arrives at your mapped confluence zone, you wait for structural reversal confirmation before entering. You do not fire off a market order the second price touches the line.
That 1:3 minimum is the discipline that protects your account. It means every trade risks one unit to make three, so the mathematical asymmetry sits heavily in your favour. You can be wrong on more than half your trades and still grow the account, because your winners are three times the size of your losers.
Trading expectancy, calculated as win rate multiplied by average win minus loss rate multiplied by average loss, is the mathematical engine that explains why a 1:3 risk-to-reward ratio can generate positive returns even when fewer than half of all trades succeed.
This checklist exists to remove emotion when charts are moving fast. It also gives you clear invalidation points, so you know the moment a setup is broken and can walk away before it costs you.
Avoiding the curve-fitting trap
The fastest way to fool yourself is to plot every Fibonacci ratio available until one of them happens to land near price. That is not analysis. That is forcing a story onto the chart.
Stick to a core set of levels and keep the chart clean. If you need a dozen ratios to justify a trade, the setup is not there. Demand confirmation from price action, wave rules, or momentum signals such as RSI divergence, where relative strength moves opposite to price and hints the trend is weakening.
Mapping the setup across global markets
Theory is easy to nod along to. Seeing the framework land on real charts is what builds the pattern recognition you will need when a live setup forms.
Consider a projected exhaustion top on the US Dollar Index (DXY), the benchmark that measures the dollar against a basket of major currencies. Analysts applied a Fibonacci retracement from a swing low of 98.304 to a swing high of 99.081, with a secondary reference at 99.574. The 261.8% extension calculated to roughly 100.338, marking the projected peak.
From there, the anticipated downside mapped a full five-wave decline: a Wave 1 drop, a Wave 2 bounce into a prior pivot, a Wave 3 fall to prior support, a Wave 4 recovery, and a Wave 5 slide into the earlier swing low.
The DXY matters beyond its own chart. Under EW-Strategy analysis, it functions as an Elliott Wave compass for the currency market, and when its wave count disagrees with the count on major dollar pairs, that disagreement tells you the read is flawed and needs rechecking.
DXY technical analysis applies the same EMA and RSI framework discussed here to the dollar index itself, and because the DXY is euro-heavy at 57.6% weighting, its readings can diverge sharply from what traders observe in emerging-market currency pairs.
When a calculated DXY zone lines up with a buy zone on a pair like AUD/USD, that alignment tells you the macro market is moving as one synchronised sequence. That is the moment your confidence to execute should rise.
Currency pair application and wave alignment
The same logic maps onto individual pairs. On AUD/NZD, a swing high of 1.21024 and low of 1.19136 projected a 261.8% extension near 1.2408 as the upside exhaustion zone, with a prior resistance band between 1.22582 and 1.22869 expected to flip into support during the pullback.
The AUD/JPY setups in November 2025 show the framework working in both directions. On 9 November 2025, Elliott Wave Forecast mapped the pair in a zigzag, with Wave ((b)) completing in the 50-61.8% retracement zone near 100.293 as a short setup.
The trade parameters were clean:
- Short zone: the 50-61.8% retracement, between 100.017 and 100.293
- Downside buyer zone: projected lower at 97.97-97.48
- Invalidation: a prior high near 100.40, the level that voids the count if breached
A day later, on 10 November 2025, FXStreet read the same pair as a double three correction and flagged an equal-legs projection zone between 96.268 and 95.509 as a high-probability long entry. That one led to fresh highs.
The lesson there is subtle but important. A confluence zone does not always mark a reversal. Sometimes it hosts a trend-continuation entry, which is exactly why you wait for structural confirmation rather than assuming the direction.
An EWPlans forecast on AUD/USD reinforces the buy-zone logic, placing Wave 3 at 0.7238 and mapping Wave 4’s correction to a defined buy zone between 0.7051 and 0.7007 before a projected Wave 5 advance. Line that up against the DXY read, and the macro picture either agrees or warns you to stand aside.
Managing the execution gap and avoiding cognitive traps
A perfectly mapped chart does not equal a profitable trade. The gap between the two is behavioural, and this is where most of the real risk lives.
Start by taking the criticisms of Elliott Wave seriously. Institutional and academic commentators classify it as a subjective heuristic rather than a statistically validated model, and standard finance curricula tend to group it among discretionary practices where evidence of consistent outperformance is limited.
The core complaint is subjectivity. Two skilled analysts can look at the identical chart and produce entirely different wave counts, which makes rigorous backtesting difficult and leaves room for you to see whatever you already want to see.
Even proponents admit to edge cases. A truncated Wave 5, where the final wave fails to exceed the prior extreme, breaks the standard template and reminds you that real price action does not always obey the model.
This is why the framework is not a crystal ball. It is a risk management filter. The Fibonacci extensions and prior swing levels are hard mathematics; the wave count is the interpretive layer, and you lean on the maths when the two disagree.
The difficulty of getting timing right is not opinion. It is measured.
DALBAR’s “Guess Right Ratio”, which tracks how often investors correctly time their entries and exits, dropped to a record-tying low of 25% in 2024, according to analysis cited by Investing.com.
That 25% figure shows you exactly what happens when traders rely on intuition instead of a strict structural framework to define their risk. Three out of four timing calls missed. If you take one thing from this section, let it be that a rules-based filter exists to protect you from precisely that outcome.
For readers wanting to see how professional desks enforce the kind of rules-based sequencing described throughout this article, our dedicated guide to prop trading discipline examines how firms such as Jane Street and Optiver structure habit formation before permitting position growth.
Overcoming subjectivity in wave counting
You cannot remove subjectivity entirely, but you can box it in with hard invalidation rules. The clearest one is that Wave 4 must never enter the price territory of Wave 1. Wave 3 is also rarely the shortest of the three impulse waves.
When your chart violates one of these rules, your count is wrong. Full stop. Those rules are how you objectively confirm a read is broken before your bias talks you into holding a losing position.
Building a rules-based trading routine
Profitability here does not come from predicting the future perfectly. It comes from running a repeatable process where the maths, not your mood, governs your capital.
Keep the core thesis simple. Fibonacci extensions show you where to look, Elliott Wave shows you what to look for, and prior swings show you where price may react. When all three point to one spot, you have a zone worth watching.
Reaching that zone is a signal to pay attention, never an automatic instruction to trade. Confirmation comes first, then execution, then a stop that respects your 1:3 ratio.
Start on higher timeframes. Daily and 4-hour charts filter out the intraday noise that shreds beginners, and they give you cleaner swings to anchor your Fibonacci tool to. Practise there until the routine feels automatic before you risk live capital.
This article is for informational purposes only and should not be considered financial advice. Investors should conduct their own research and consult with financial professionals before making investment decisions.
Past performance does not guarantee future results. Any levels, projections, or forecasts referenced are speculative, drawn from third-party analysis, and subject to change as market conditions develop.