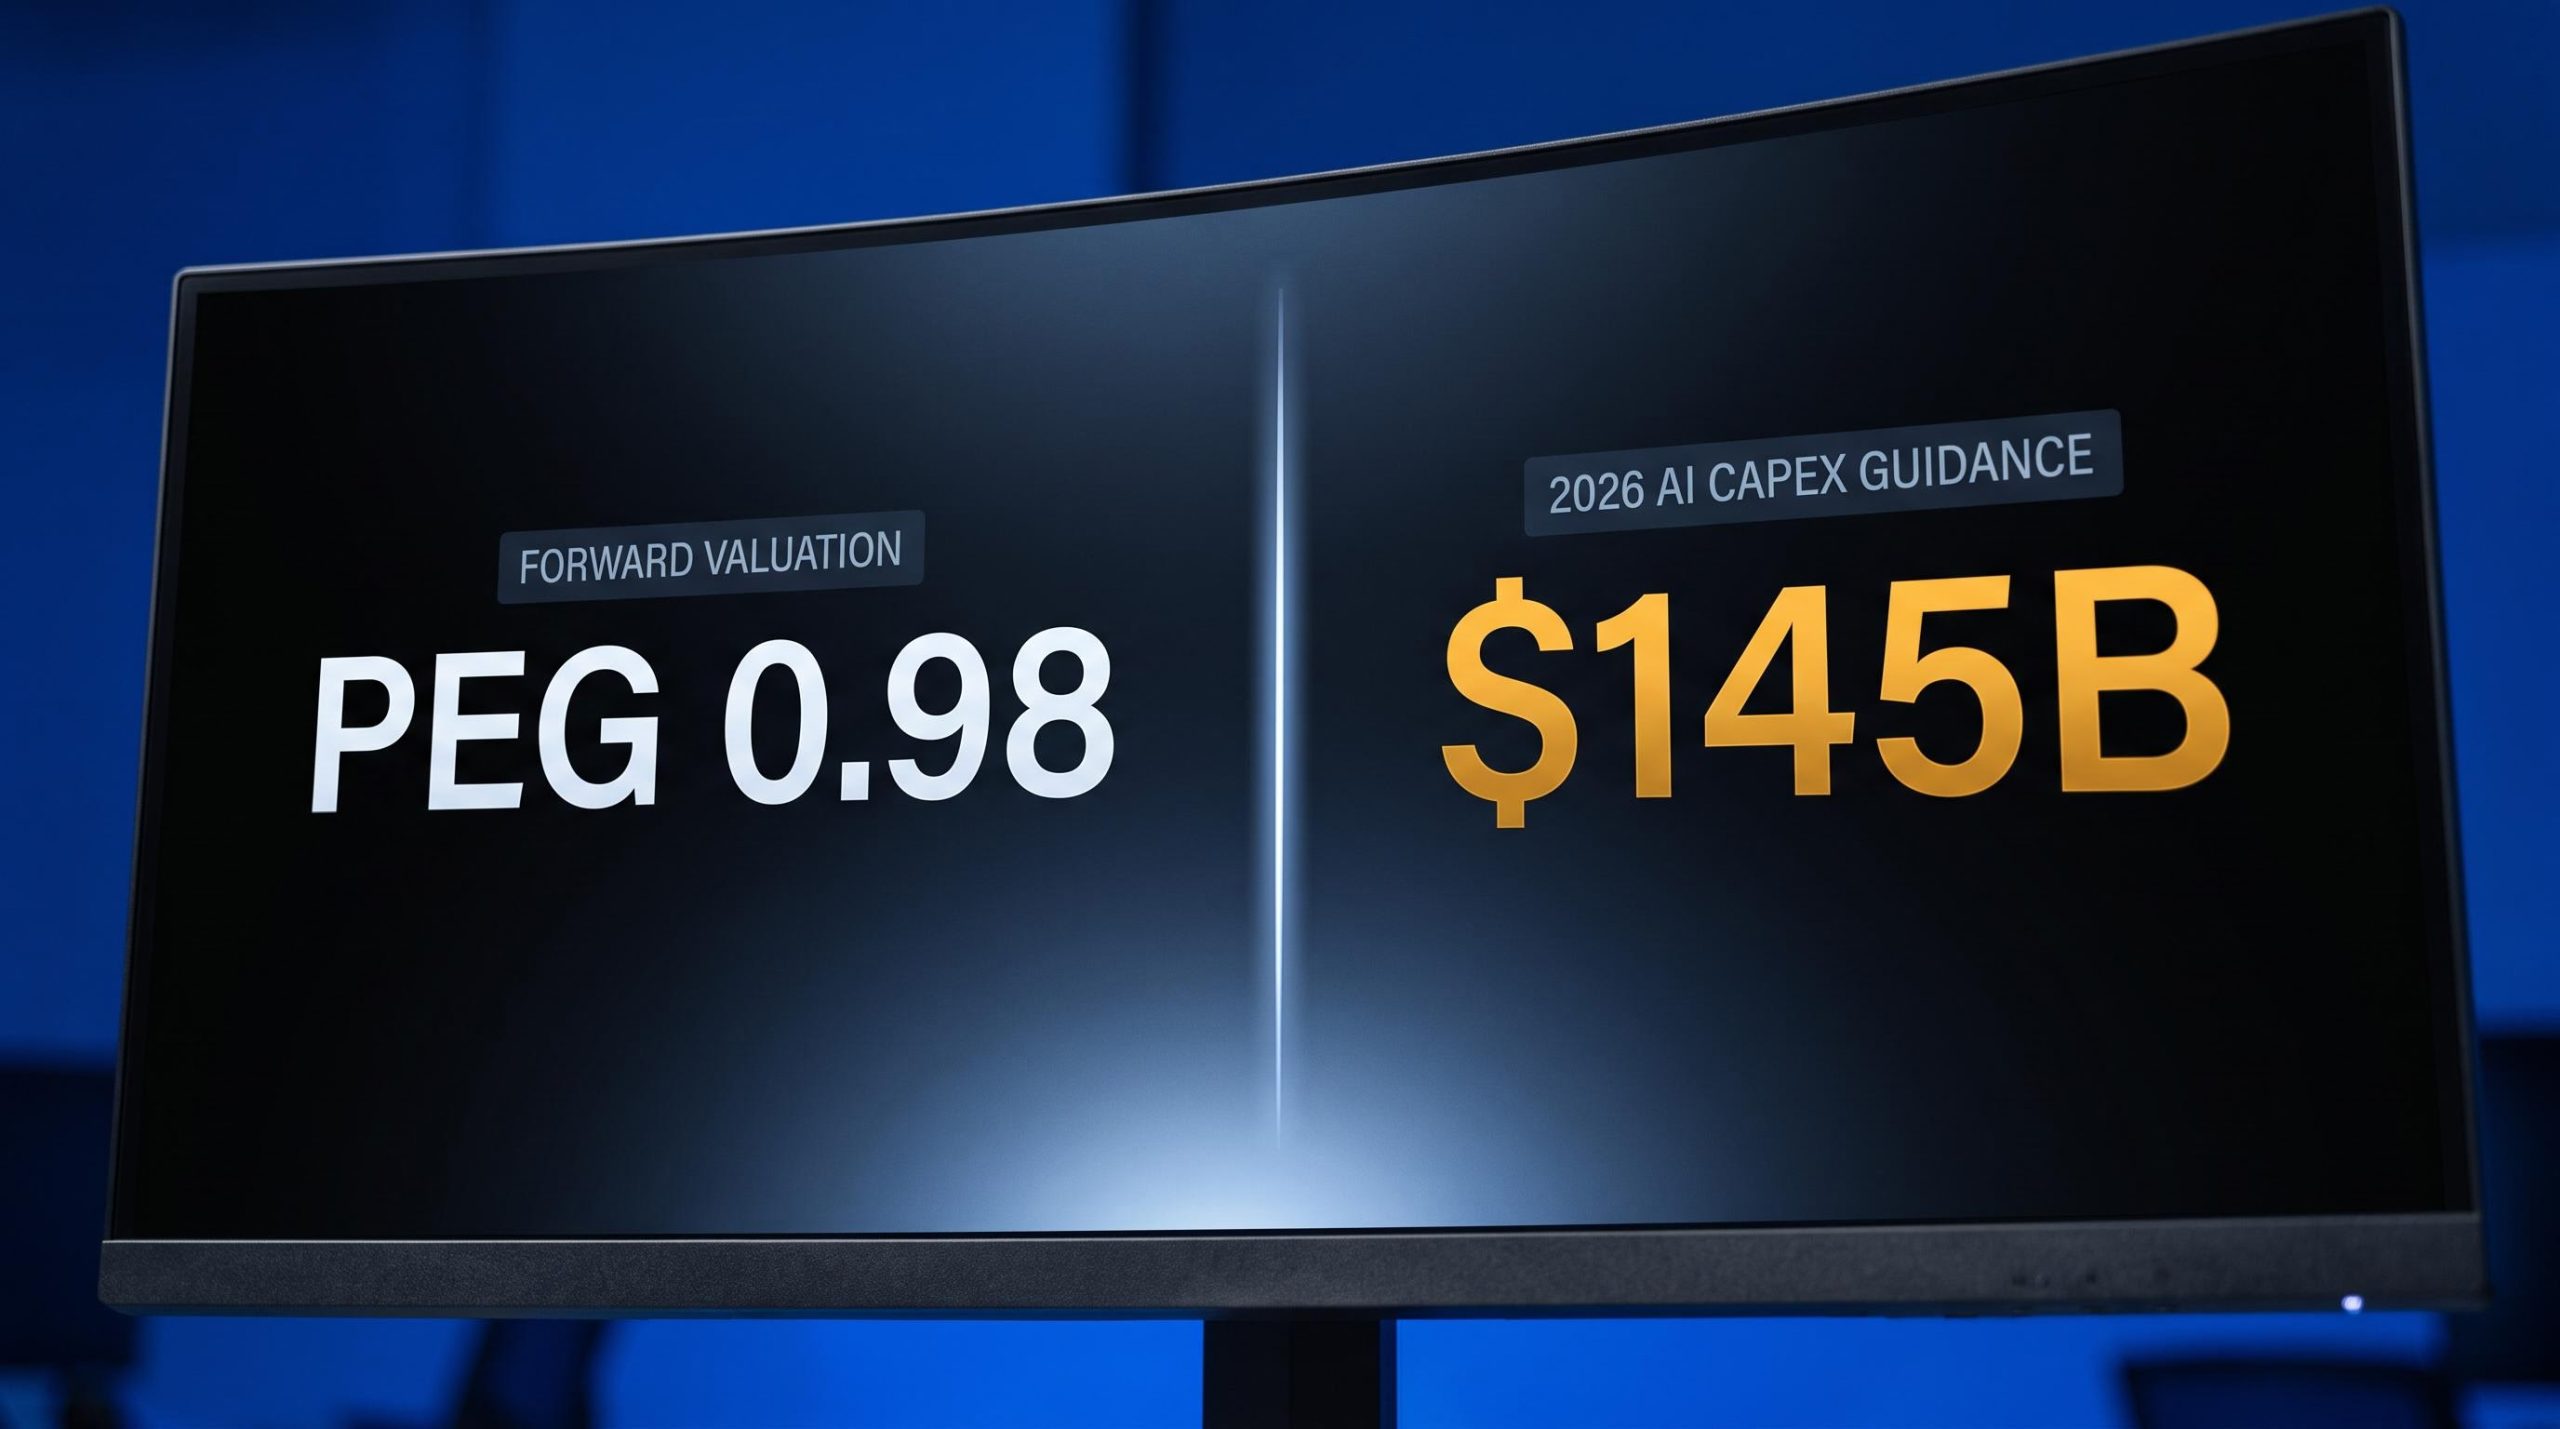
Meta Platforms is committing between $130 billion and $145 billion to artificial intelligence infrastructure in 2026, a figure whose midpoint nearly doubles what the company actually spent last year. This is one of the most aggressive capital deployment stories in corporate history.
Yet the metric most retail investors reach for first, the PEG ratio, sits at roughly 1.0. That is the reading you would expect from a fairly valued consumer staples business, not from a company remaking its entire cost base around a technology bet.
That dissonance between the scale of ambition and the apparent modesty of the valuation is where this piece begins. For US investors weighing a high-profile technology position, the question is not whether Meta is cheap or expensive on any single measure. It is how to read a stock where each individual framework produces a partial, and potentially misleading, picture.
This is not a news update. It is a structured Meta stock analysis treated as a case study in applying three valuation lenses at once: fundamental metrics, analyst consensus, and options market positioning.
What this analysis gives you is a repeatable framework for situations where the obvious valuation number tells only part of the story, with Meta as the worked example.
What the PEG ratio is actually telling you about Meta right now
Start with the number that looks reassuring. As of 14-22 September 2026, Yahoo Finance reported Meta’s forward P/E at 21.98 and its five-year expected PEG ratio at 0.98. MarketBeat, updated 18-22 September 2026, projected earnings growth of 23.02% for the coming year (from $27.93 to $34.36 per share) and cited a PEG of 1.16.
| Metric | Yahoo Finance | MarketBeat |
|---|---|---|
| Forward P/E | 21.98 | ~22x |
| EPS growth (next year) | ~23% | 23.02% |
| PEG ratio | 0.98 | 1.16 |
A PEG at or near 1 is conventionally read as fair value: the price you are paying is roughly in line with the growth you are buying. On the surface, that settles the question.
It does not. The moment you place that PEG next to Meta’s capex cycle, the reading starts to look thin.
The PEG ratio, P/FCF, and EV/EBITDA each address a specific failure mode of single-metric screening, and the case for using valuation metrics beyond P/E becomes clearest exactly when a company’s capex cycle is actively distorting reported earnings.
Meta’s 2026 capital expenditure guidance of $130-145 billion nearly doubles its $72.22 billion in actual 2025 spend, yet the PEG registers near 1 as though the investment cycle were entirely unremarkable.
The problem is that PEG was built to compare near-term earnings growth against a multiple. It was not built to see what happens when a company pours over $130 billion a year into infrastructure designed to pay off over a decade. Several structural limitations apply directly to Meta right now:
- Heavy capex generates large depreciation charges that can distort reported EPS in ways that do not track underlying economic value.
- PEG typically leans on one-to-five-year earnings estimates, while AI infrastructure is built for a payoff horizon that stretches far beyond that window.
- The metric is blind to capital intensity, so a hyperscaler spending over $100 billion a year and a light-asset software firm can show identical PEGs while facing entirely different risk.
- It depends on forward growth forecasts that are especially unstable during technology transitions, where adoption and pricing curves are hard to predict.
- It ignores free cash flow and return on invested capital, which is why many institutional investors treat those measures as more reliable during an investment cycle.
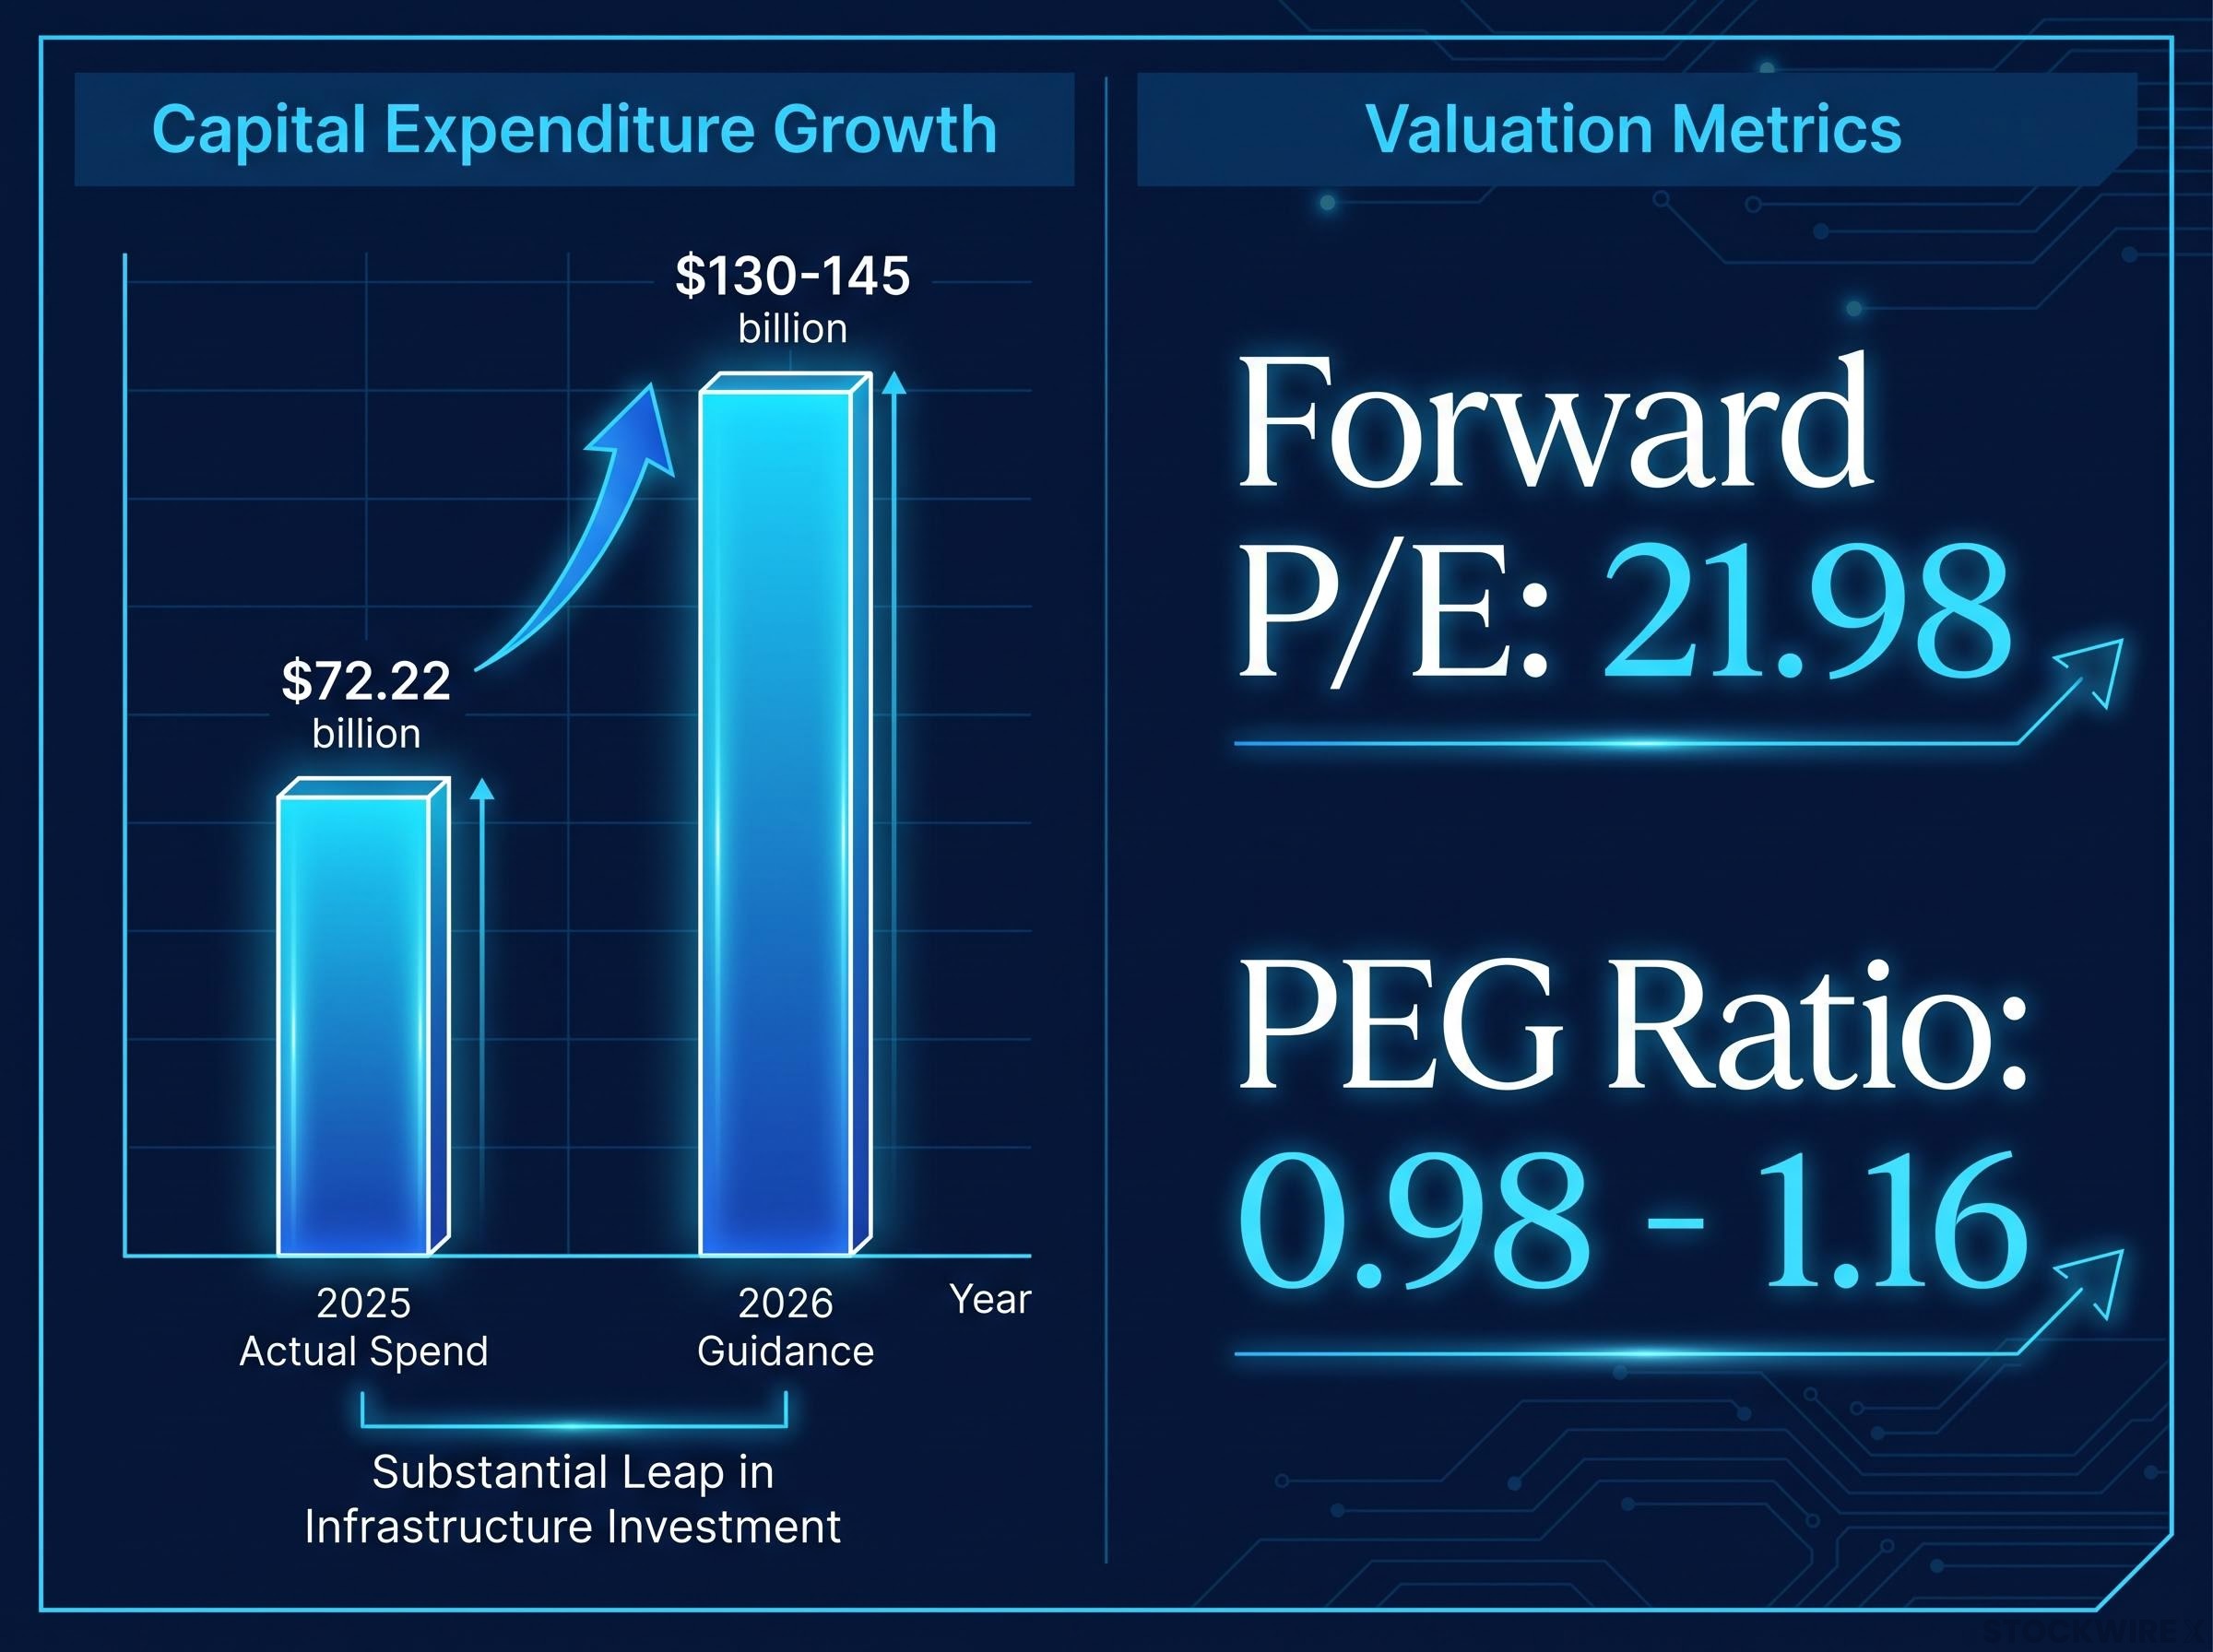
Here is what the PEG near 1 actually tells you: Meta is not wildly expensive relative to its near-term earnings trajectory. What it does not tell you is whether that trajectory is reliable given the scale of spending behind it. For Meta in 2026, that second question is the entire question.
When big ASX news breaks, our subscribers know first
How analysts are pricing Meta’s AI bet, and where the targets cluster
If PEG offers a starting point, professional analysts offer a second layer. But their targets are only as good as the assumptions baked into them, and those assumptions are worth surfacing.
Wells Fargo provides the clearest illustration. In a note dated 21 September 2026, the bank raised its price target to $796 from $640 while keeping an Overweight rating. The mechanics matter more than the number: Wells Fargo shifted from applying a 20x multiple to a 25x multiple on its 2027 earnings estimate.
That change is not a minor tweak. Lifting the multiple by five turns is an explicit bet that Meta’s AI investment will translate into premium-worthy earnings by 2027, rather than merely funding future potential.
| Institution | Price Target | Prior Target | Rating |
|---|---|---|---|
| Wells Fargo (Sept 2026) | $796 | $640 | Overweight |
| JPMorgan (rally period) | $820 | $640 | Raised |
| Citigroup (rally period) | $800 | Not disclosed | Raised |
The JPMorgan and Citigroup targets landed during a striking run. Meta gained roughly 33% over about a month, and a large chunk of that came in a single session that added approximately $76-80 points. Notably, that surge was not driven by a company-specific catalyst but by broad technology-sector strength, with the Nasdaq up close to 3% on the day. Price target revisions tracked the rally rather than leading it, which is worth remembering when reading them as signal.
What the consensus distribution reveals beyond the average
Aggregated across 47 analysts, MarketBeat’s forecast page (updated 22 September 2026) put the average 12-month target at $789.63, implying roughly 7.2% upside from a contemporaneous $736.59.
The average, though, hides the real story. The high target sits at $1,000 and the low at $600.
A $400 spread across 47 professional analysts on a single stock is not outlier noise or a quibble about discount rates. It reflects genuine disagreement about the AI monetisation timeline. What this tells you is that even institutional consensus contains a wide dispersion of views on how Meta’s spending resolves, and the average is best read as the midpoint of a broad distribution, not a confident point estimate.
Reading the options market: what sophisticated traders are positioning for
Analyst notes tell you what professionals say. The options market tells you what they are willing to pay. That distinction matters, because premiums reflect real capital at risk rather than a research opinion.
Options chain sentiment signals, including implied volatility rank, call-to-put premium ratios, and far-out-of-the-money strike crowding, provide the interpretive framework for reading the skew data the Meta analysis surfaces without assuming familiarity with options market mechanics.
At the time of this analysis, with Meta trading near $743, the options market was pricing an implied move of roughly $112-113 around the November earnings cycle. Against a typical benchmark implied move of about $74-75 (roughly 10%), that is a market bracing for outsized event risk. Through the December 18 expiration, the total expected range widened to approximately 128 points.
The call side is where the positioning gets interesting. The $840 call was priced near $34 ($3,400 per contract), with a delta around 34 and a touch probability, the chance the stock reaches that level at any point before expiry, of roughly 70% within 88 days. Further out, the $940 call ran about $1,600 per contract with a touch probability near 40%, while the $1,000 strike carried only about a 13% chance of finishing in the money.
Now compare the downside. The $640 put was priced at roughly $20 ($2,000 per contract) with a delta near 20, and the $540 put cost around $500 per contract with a delta of about 6.
| Strike | Type | Price per contract | Delta | Touch probability |
|---|---|---|---|---|
| $840 | Call | ~$3,400 | ~34 | ~70% |
| $940 | Call | ~$1,600 | ~19 | ~40% |
| $1,000 | Call | Not disclosed | Not disclosed | ~13% ITM |
| $640 | Put | ~$2,000 | ~20 | Not disclosed |
| $540 | Put | ~$500 | ~6 | Not disclosed |
Call options at equivalent distances above the then-current price carried materially higher premiums than the corresponding puts below it, reflecting a market positioned asymmetrically for further upside.
This data was drawn from live quotes on the Options Math Check program at the time of broadcast, so treat it as a snapshot rather than a fixed reading.
Here is what the skew tells you. At that moment, the options market was not treating upside and downside as mirror images. Participants were paying meaningfully more for the right to benefit from a further rise than for protection against an equivalent fall. That asymmetry is itself a signal, and it gives you a market-priced probability distribution to set alongside analyst targets and fundamental metrics, a third and independent data layer for testing your conviction.
The distribution advantage and the capex ROI question: where the bull and bear cases diverge
The three lenses so far describe how Meta is priced. This section is about why, and it is where the bull and bear cases become two internally coherent frameworks rather than one right answer and one wrong one.
The bull case rests on distribution. Meta’s app family, Facebook, Instagram, WhatsApp, and Messenger, reaches roughly 3 billion users. That gives the company a built-in channel to push Meta AI, Llama-powered features, and better ad targeting into products people already open every day. The customer acquisition cost for rolling out AI is, in effect, close to zero, a structural edge standalone AI companies cannot match.
The bulls point to four monetisation pillars:
- Advertising efficiency, as AI improves relevance and measurement, letting Meta charge more for higher-performing campaigns.
- Engagement and retention, as AI-driven feeds and assistants lift time spent across the apps.
- New AI products, including Muse and Meta One, sold or embedded across the installed base.
- Potential infrastructure revenues from monetising excess compute capacity, which remains speculative.
There is early evidence the products can land. Meta’s AI agent Muse briefly overtook ChatGPT for the top app store position and scored 62 on an AI analyst benchmark, trailing only two Anthropic models.
The sceptical case is equally coherent, and it starts with a number.
Oppenheimer estimates Muse would need roughly 115 million paying subscribers at $20 per month to generate about $28 billion in revenue. Meta One currently sits at approximately 15 million subscribers.
The bear case runs across four risks that mirror the bull-case pillars:
- Conversion uncertainty, because high usage of free AI features does not automatically become higher revenue per user.
- The subscriber gap, with current penetration a fraction of what the AI subscription thesis requires.
- Regulatory scrutiny over data usage, content moderation, and bundling, particularly in the EU.
- Competitive pressure from OpenAI, Google, Microsoft, and Amazon, whose AI is increasingly native to operating systems and productivity suites.
The spending scale sharpens both sides. Meta’s $130-145 billion guidance sits within a hyperscaler cohort whose combined 2026 outlay reaches roughly $730 billion: Amazon at about $220 billion, Alphabet at $195-205 billion, and Microsoft near $175 billion. Goldman Sachs projects big-tech AI capex approaching $1.14 trillion by 2027.
Meta’s AI infrastructure cost efficiency gains, particularly the $22 billion per gigawatt build rate that is roughly half the prior Wall Street assumption, mean the $130-145 billion capex commitment buys materially more compute capacity than the Wells Fargo multiple expansion already prices in.
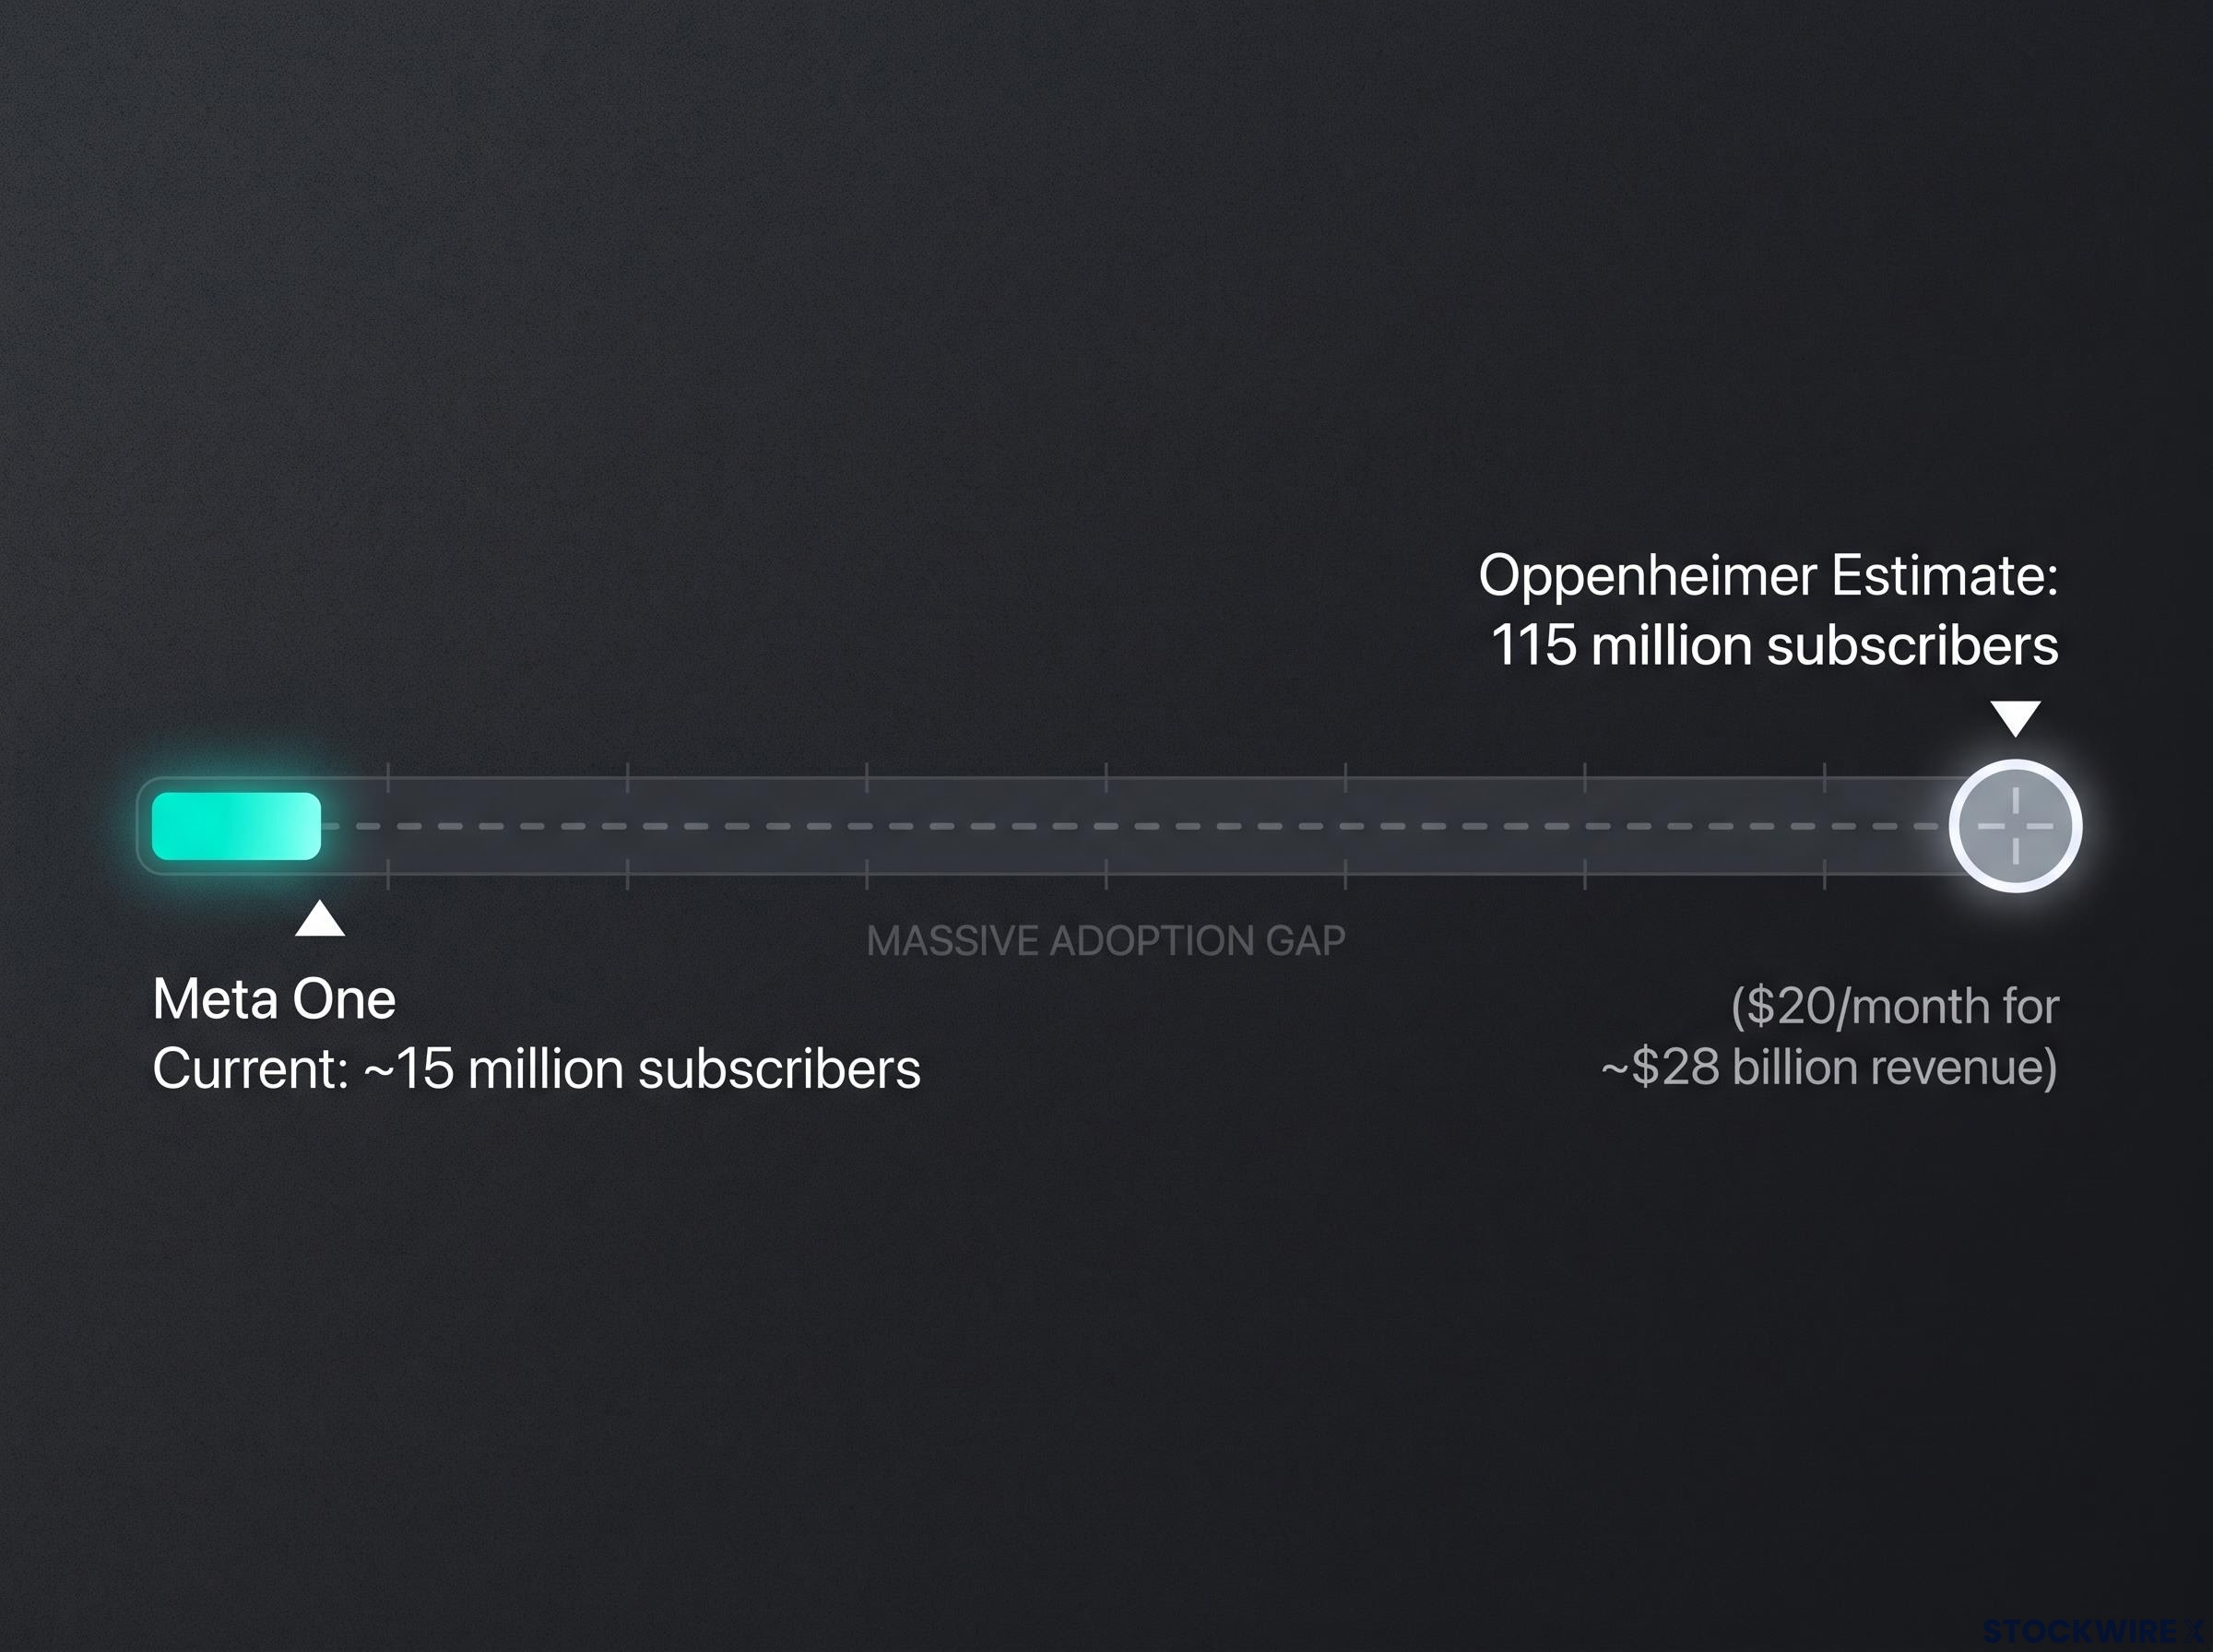
The gap between Meta One’s 15 million subscribers and the 115 million Oppenheimer says are needed tells you exactly how much conversion must still happen before the AI subscription story becomes a genuine earnings driver. That distance is the central unresolved variable in any buy or hold decision today, and it is precisely what Wells Fargo’s shift to a 25x multiple is implicitly betting gets closed.
What the three-lens framework tells an investor today, and what it leaves open
Put the three lenses together and a picture forms. The PEG range of 0.95-1.16 suggests the current earnings trajectory is not dramatically overpriced. Analyst consensus clusters around $789.63 with a $600-$1,000 spread. And the options skew, with an implied move near $112-113, shows sophisticated participants leaning asymmetrically bullish.
Convergence across three independent lenses raises your confidence in the read. It does not eliminate the core uncertainty.
That uncertainty is singular: whether $130-145 billion in annual AI capex converts into durable earnings growth, or whether the flattering near-term EPS trajectory is being funded by investment that never earns its cost of capital. Worth remembering, too, that a 33% monthly rally means a good deal of the optimism may already sit in the price.
The AI capex return-on-investment question extends well beyond Meta: BCA Research’s proportionality benchmark, which sets annual AI infrastructure revenue requirements at roughly $10 trillion against JPMorgan’s $2.5-3 trillion projection by 2030, frames why the capex-to-earnings conversion concern applies across the entire hyperscaler cohort.
So the honest output is not buy or sell. It is a clear statement of what you would be betting on either way.
Two indicators worth tracking over the next 12-18 months
For the bull case to hold, two assumptions must prove out: that AI features convert users to incremental revenue at meaningful scale, and that Meta’s distribution advantage stays durable against OS-native and productivity-suite rivals.
Both are testable. Watch these:
- Muse and Meta One subscriber growth rates, the most concrete near-term read on whether monetisation is gaining traction against that 115 million threshold.
- AI-driven ARPU (average revenue per user) contribution in quarterly commentary, where management guidance language will signal traction before it shows clearly in reported figures.
This article is for informational purposes only and should not be considered financial advice. Investors should conduct their own research and consult with financial professionals before making investment decisions.
Past performance does not guarantee future results. Financial projections are subject to market conditions and various risk factors, and forward-looking statements are speculative and subject to change based on market developments and company performance.