
The capital pouring into AI data centres has reached a scale where the revenue required to justify it exceeds the annual output of entire global industries. BCA Research pegs the figure at roughly $10 trillion per year, placing it in the same bracket as the largest categories of global expenditure, not as a forecast of what AI will ultimately earn but as a benchmark for what the infrastructure economics demand it must earn.
That distinction matters more than the number itself. BCA’s $10 trillion is an annual revenue requirement, not a cumulative spending forecast or a market capitalisation target. It arrives at a moment when early returns on AI capital expenditure are appearing in earnings reports, which makes the structural question more urgent, not less: markets may be pricing those early signals as confirmation of a thesis that the underlying maths has not yet validated.
Here is a framework for separating the near-term hardware trade from the longer-term justification risk, and a monitoring checklist for the metrics that will tell you which side of that divide the evidence is building toward.
What $10 trillion a year actually means
The figure sounds like hyperbole until you measure it against things that already exist at that scale. Global annual healthcare expenditure runs at roughly this level. So does worldwide food spending. Those are industries that serve every person on the planet, every day, with decades of demand history behind them.
BCA Research’s $10 trillion is a proportionality estimate: the annual revenue the AI ecosystem would need to generate to economically justify the data centre capital currently being committed. It is not a cumulative capex forecast, not a market capitalisation scenario, and not a prediction of failure. It is a benchmark designed to test whether the spending and the returns are in the same order of magnitude.
Distinguishing the three uses of “$10 trillion”
The same number circulates in AI discourse with three entirely different meanings, and conflating them is now one of the most common analytical errors in the space. Nvidia’s Jensen Huang has referenced $10 trillion as a potential market capitalisation under a scenario where AI becomes a foundational infrastructure layer for the global economy. JPMorgan estimates cumulative AI data centre capex through 2030 at approximately $5-5.5 trillion, a multi-year spending total. BCA’s figure is the annual revenue required to justify that spending base.
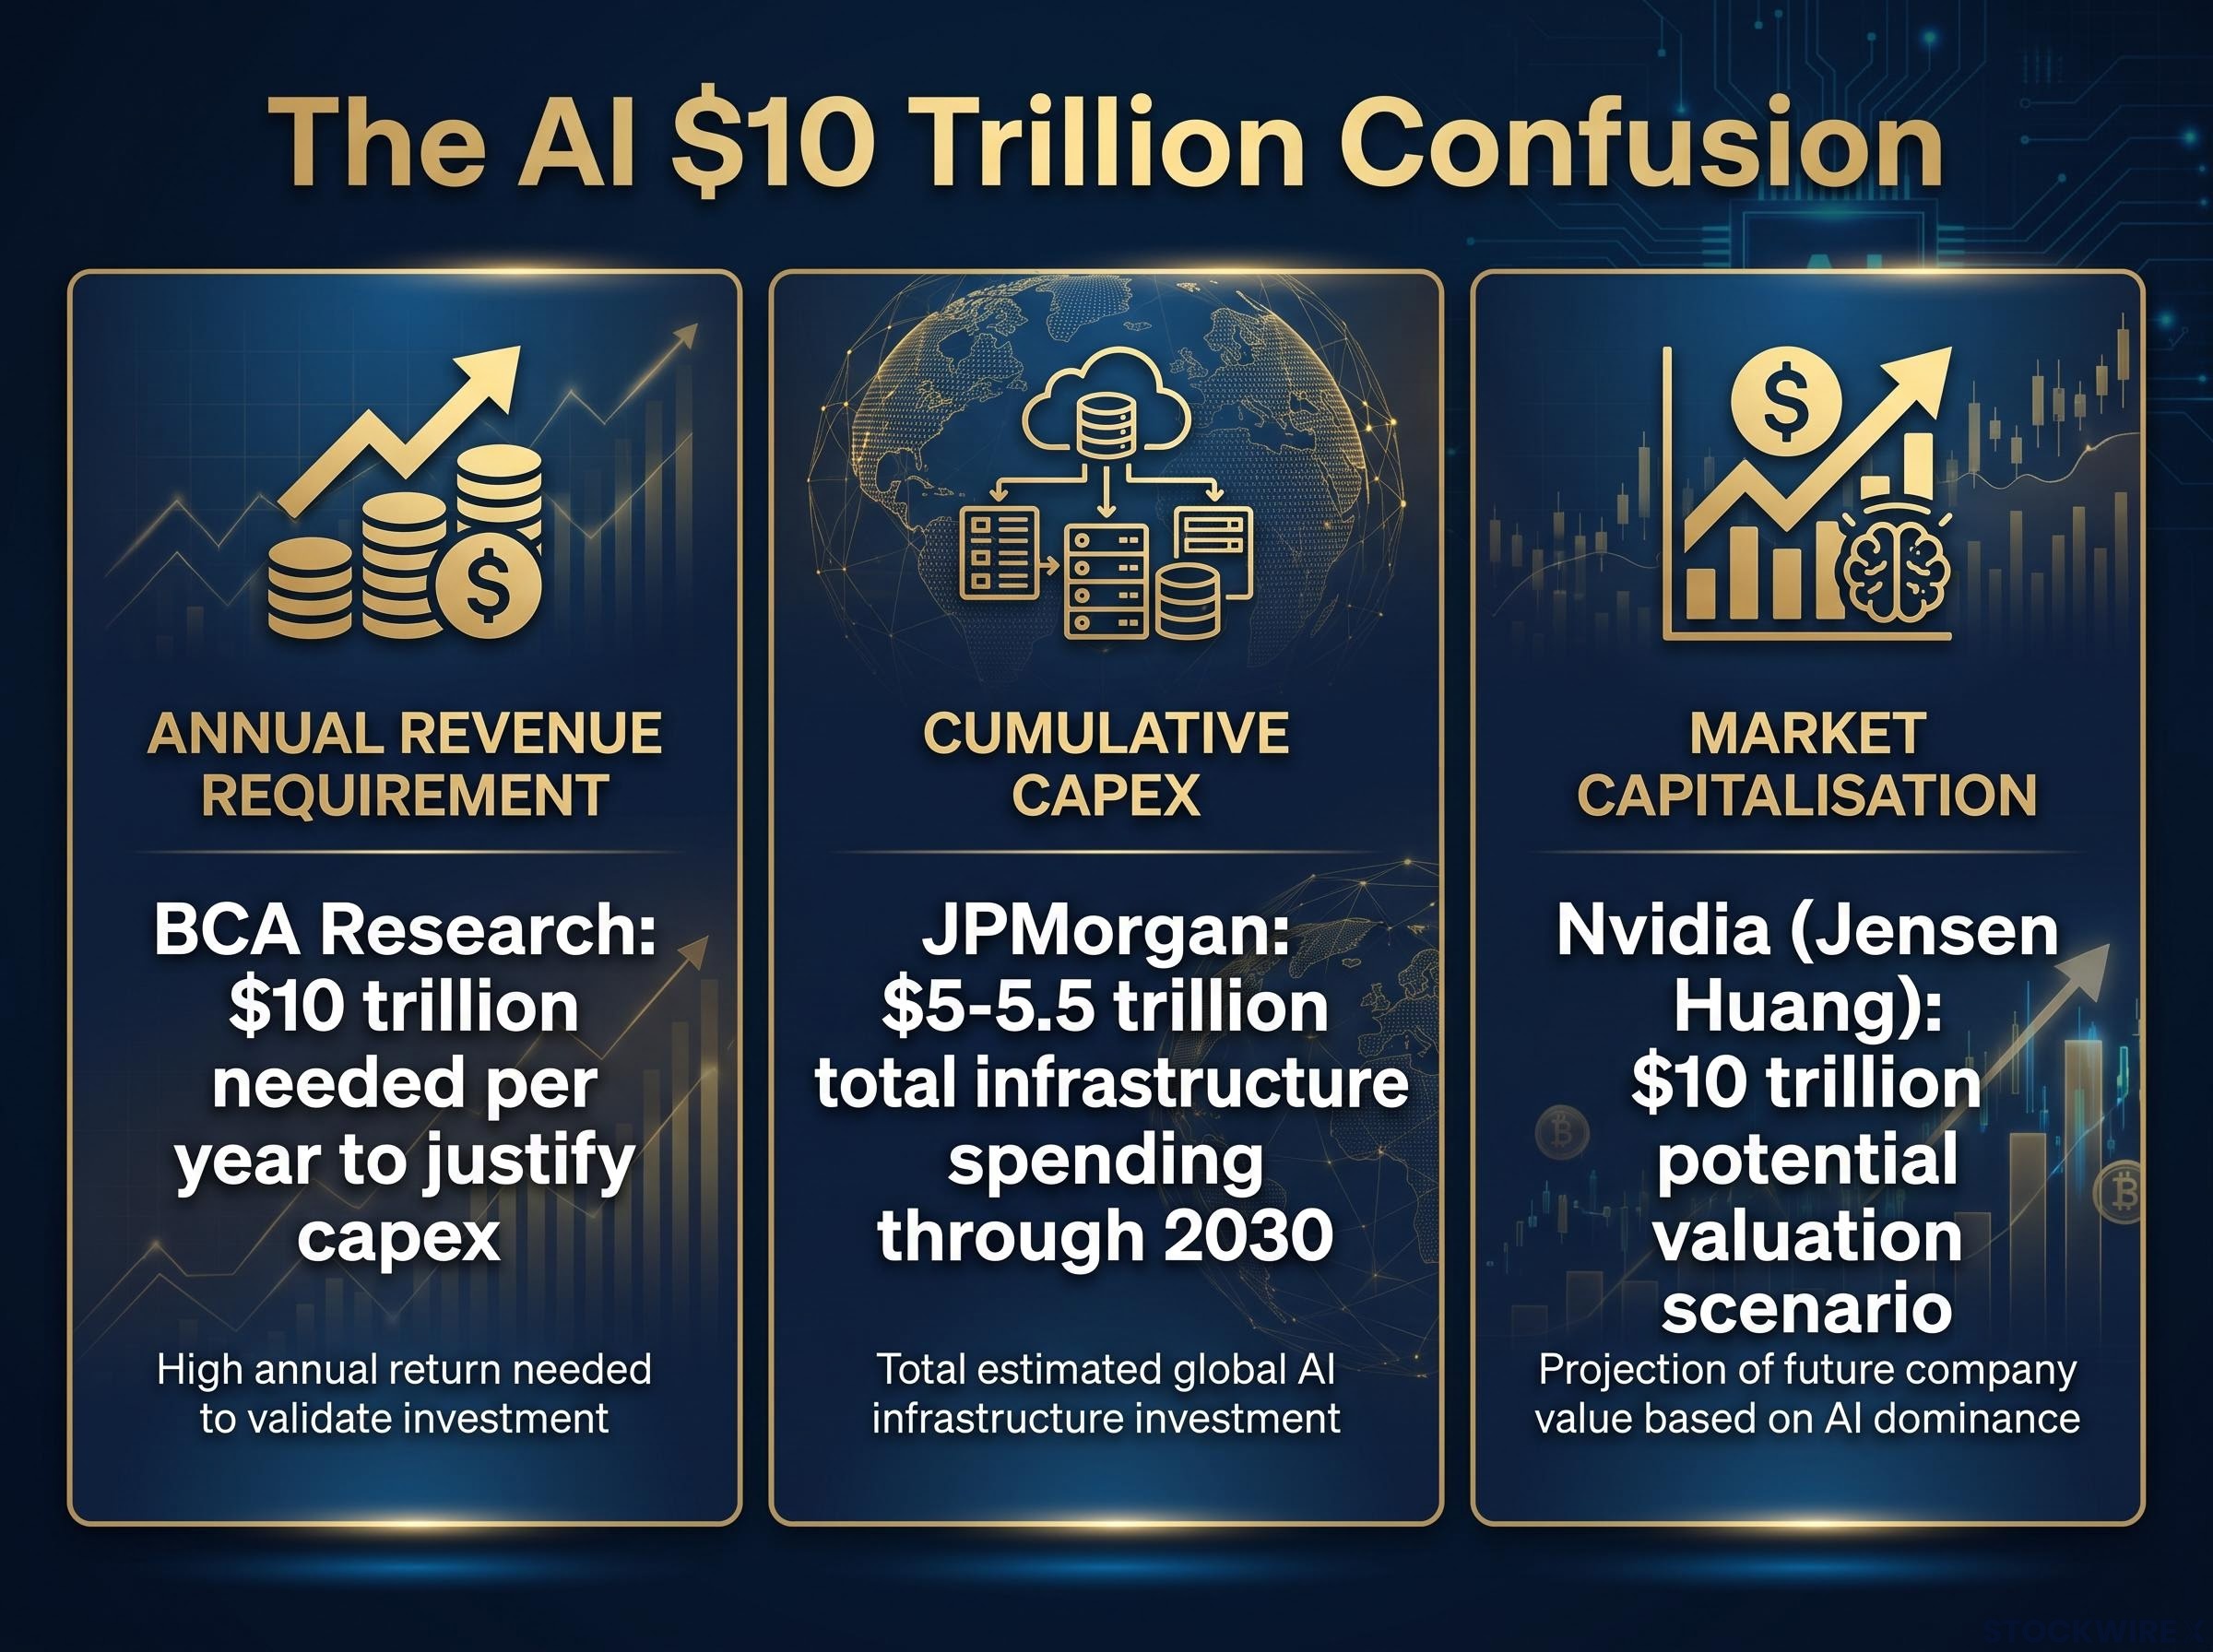
| Context | What the figure refers to | Source | Why it matters for investors |
|---|---|---|---|
| Annual revenue requirement | Revenue AI must generate each year to justify capex | BCA Research (August 2026) | Sets the proportionality test for infrastructure economics |
| Cumulative capex through 2030 | Total multi-year infrastructure spending ($5-5.5T) | JPMorgan (2025-2026) | Defines the investment base ROE/ROIC must be measured against |
| Market capitalisation scenario | Potential valuation if AI becomes foundational infrastructure | Nvidia (Jensen Huang commentary) | Describes a stock-price outcome, not an economic return |
Understanding which version of $10 trillion is being invoked in any given research note or earnings call is now a basic due-diligence requirement before acting on an AI-related thesis.
When big ASX news breaks, our subscribers know first
The gap between what is being built and what must be earned
Start with the spending. JPMorgan estimates cumulative AI data centre capex through 2030 at approximately $5-5.5 trillion. That capital is being committed now, with construction timelines measured in years and depreciation schedules stretching well beyond them.
AI capex commitments from the four largest hyperscalers reached $130 billion in Q1 2026 alone, with full-year 2026 guidance landing at approximately $725 billion and the trajectory pointing toward $1 trillion annually by 2027, a spending base that substantially exceeds JPMorgan’s cumulative $5-5.5 trillion estimate when annualised across the remaining build period.
Now set the revenue against it. Even optimistic institutional projections place combined AI-related revenues, spanning cloud providers, model firms, and AI-native infrastructure companies, at levels that fall far short of BCA’s annual threshold:
- JPMorgan projects a combined AI revenue run rate of approximately $1.6 trillion by end-2026, according to the bank’s research
- By 2030, JPMorgan’s estimates reach $2.5-3 trillion, according to their published projections
- BCA’s annual revenue benchmark sits at roughly $10 trillion, several multiples higher than even the optimistic trajectory
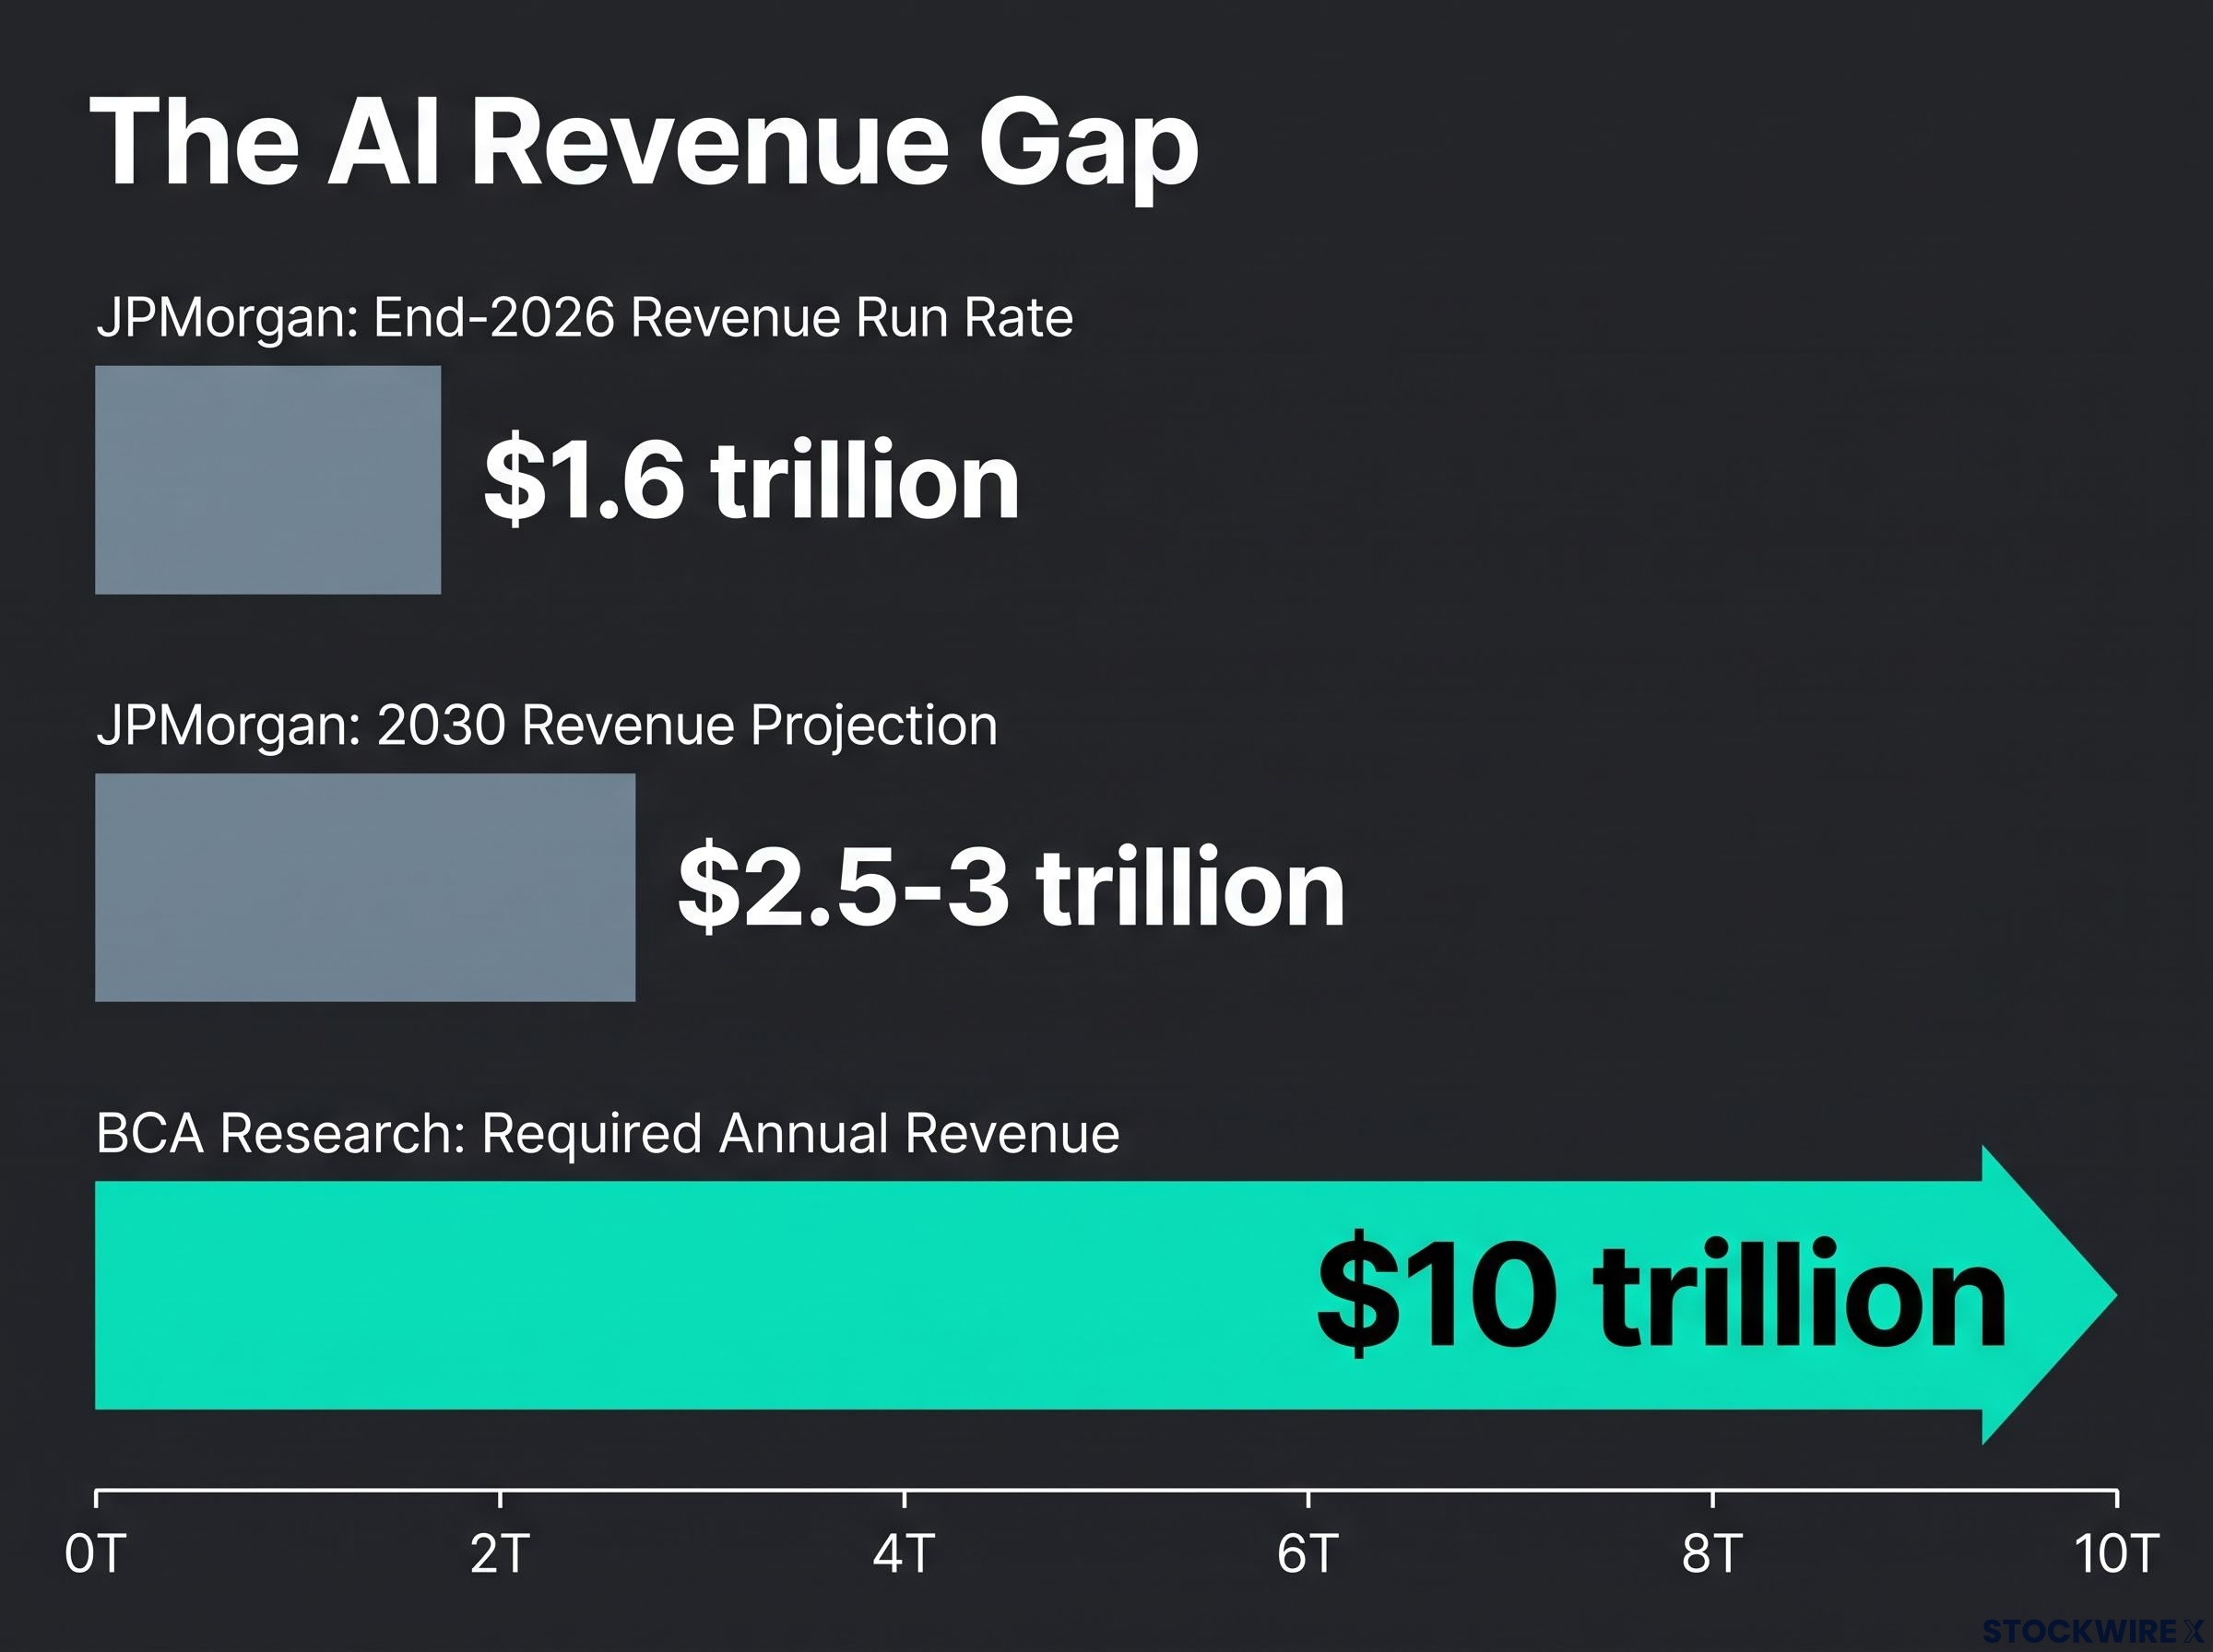
The gap is not closing. It is widening as capex commitments accelerate.
BCA Research has characterised the current AI surge as “primarily an earnings bubble rather than a valuation bubble,” a distinction that shifts the risk from price multiples to the profit forecasts themselves.
That framing changes what you should be screening for. BCA acknowledged in its August 2026 report that return on AI capex “has begun to show up” in the current earnings season. The argument is not that AI generates zero returns. It is that the scale of those returns remains small relative to the capital base against which they must be measured. For you, the risk to flag is not an expensive price multiple but an earnings estimate constructed on a revenue trajectory the infrastructure economics cannot yet support.
Why utilisation numbers are harder to read than they look
On the surface, the utilisation data presents a contradiction. One sector analysis suggests effective utilisation is capped near 15% due to power constraints, even as hundreds of new facilities come online. Goldman Sachs, meanwhile, projects physical data centre occupancy rates rising above 95% by late 2026, with AI growing to approximately 27% of total workloads by 2027, according to the bank’s research.
Both can be true simultaneously. They measure different things.
Physical capacity, power, and economically productive workloads
Physical capacity refers to rack occupancy: how many server slots are filled. Goldman’s 95% figure sits here. A facility can be physically full while a large share of its racks sit idle or throttled because the power supply cannot feed them at full compute intensity.
Power availability is the binding constraint. The IEA reports that electricity consumption from AI-focused data centres grew approximately 50% in 2025, while overall data centre electricity demand rose 17%. Schneider Electric estimates AI workloads currently account for approximately 4.3 GW of data centre power, growing at 26-36% CAGR to 2028, according to the firm’s published projections. Demand is surging, but grid delivery has not kept pace with rack installation.
AI electricity demand growth of approximately 50% in 2025 is the clearest empirical confirmation that adoption is real at the infrastructure layer, but the IEA projects total data centre and AI consumption exceeding 1,000 TWh by 2026, a figure that illustrates how power constraints are becoming a structural ceiling on how quickly utilised capacity can translate into economically productive workloads.
Economically productive workloads are the subset of active compute that generates revenue rather than running test, training, or experimental cycles. This is the metric that connects utilisation to the justification question, and it is the least visible of the three.
| Factor | What it measures | Current signal | Investment implication |
|---|---|---|---|
| Physical capacity | Rack occupancy | Projected above 95% by late 2026 | Headline metric; may overstate productive use |
| Power availability | Electricity delivered vs. demanded | AI electricity demand grew ~50% in 2025; grid constraints persist | Binding ceiling on actual throughput |
| Economically productive workloads | Revenue-generating compute as a share of total | Least visible; not separately reported by most operators | The metric that links utilisation to the $10T revenue test |
When a hyperscaler reports high occupancy rates, the follow-up question you should be asking is: what share of that capacity is power-constrained, and what share of active compute is running economically productive workloads rather than training and test cycles?
What productivity data tells investors that earnings season does not
According to BCA Research and Investing.com, Q2 2026 productivity figures for the U.S. landed broadly in line with the 10-year historical average, leaving no discernible AI-driven lift visible in the macro data. That is the macro-level test AI infrastructure investment has not yet passed, and it is distinct from the application-layer revenue growth that appears in model provider earnings.
At the application layer, the signals are unambiguously strong. The IEA reports that major AI model providers recorded approximately a threefold increase in active users and a fivefold increase in revenue year-over-year. Those are real adoption metrics.
But aggregate productivity is where the infrastructure thesis lives or dies. Transformative technologies historically show a lag between deployment and measurable economy-wide productivity gain, a pattern economists call the productivity paradox. That lag does not resolve the justification question for you if your investment horizon is 12 months.
The productivity paradox, the documented lag between technology deployment and measurable economy-wide output gains, is not unique to AI; Bank of America’s research places five structural barriers between task-level efficiency gains and GDP-visible productivity growth, including legacy IT systems, workforce skills gaps, and organisational change costs that compress the translation rate even when adoption metrics are strong.
Peter Berezin, Chief Economist at BCA Research, has indicated that moving to a structurally more constructive stance on equities would depend on productivity growth picking up materially, a condition the Q2 2026 figures failed to satisfy.
The productivity data is not a reason to exit AI positions. It is a reason to weight the near-term hardware trade differently from the long-run structural thesis, because right now only one of those has empirical support:
- Application layer: Users, revenue, and energy consumption all accelerating rapidly
- Macro layer: Aggregate productivity growth remains at its decade-long average, with no AI-driven breakout visible in the data
How the hardware shortage is masking the longer-term risk
Tight hardware supply across the AI sector is, for the time being, acting as a genuine prop for AI-related equities, according to BCA Research. This is not a fabricated condition. When demand exceeds supply at the hardware layer, pricing power and margins are elevated, and earnings reports reflect a market structure that will change.
The masking mechanism works in sequence:
- Hardware shortage creates pricing power for semiconductor and infrastructure suppliers
- Elevated margins appear in quarterly earnings, beating consensus estimates
- Markets price the result as structural rather than cyclical
- Capacity expansion changes the supply-demand balance as new facilities come online
- The underlying justification gap, the distance between revenue generated and revenue required, becomes visible
According to BCA Research, Peter Berezin remains cautious on equities overall, with the firm viewing the extended outlook as unfavourable even if prices grind somewhat higher before year-end 2026. Over a 12-month window, the risk skew is to the downside.
If you are positioned in AI hardware names, you are currently benefiting from a supply-demand dynamic, not yet from a demonstrated justification of the infrastructure economics. Those are not the same trade, and the conditions producing current results have a finite duration.
ROE, ROIC, and the metrics that will settle this debate
BCA Research identifies return on equity (ROE), the profit a company generates relative to shareholder capital, as the ultimate test of whether hyperscalers’ AI capex is economically coherent. Return on invested capital (ROIC), which measures profit relative to total capital deployed including debt, provides an even sharper lens when set against the cost of that capital.
These metrics will emerge as the definitive signals as the infrastructure base matures and early-cycle pricing power normalises. JPMorgan’s cumulative capex estimate of $5-5.5 trillion through 2030 is the denominator against which any return calculation must eventually be run. Consensus analyst forecasts are currently embedding expectations of record profit growth layered on top of margins that are already at historic highs, a compounding assumption whose logic depends entirely on a sharp acceleration in the revenue trajectory from current levels.
| Metric | What it tests | What to watch for | Time horizon |
|---|---|---|---|
| Forward EPS revisions | Whether consensus profit forecasts are being maintained | Downward revisions in AI-exposed names | Near-term (quarterly) |
| ROIC trend (hyperscalers) | Whether returns justify the capital base | ROIC declining toward or below cost of capital | Medium-term (2-4 quarters) |
| U.S. productivity growth | Whether AI is producing economy-wide gains | Sustained acceleration above 10-year average | Long-term (annual releases) |
The investor’s decision is ultimately a horizon question. The near-term hardware trade and the long-run infrastructure economics are legitimate separately. Conflating them produces a position with unclear risk parameters. If you take one monitoring action from this analysis, add ROIC trend for major hyperscalers to your standard earnings review. That is the metric that will show whether the infrastructure economics are resolving toward the bull case or against it.
- Forward EPS revisions: the first visible signal of repricing
- ROIC trend relative to cost of capital: the structural test
- Quarterly U.S. productivity data: the macro-level confirmation or denial
What the data has settled and what it has not
The two-speed picture is now clear. Application-layer demand metrics, users, revenue, energy consumption, are unambiguously strong. IEA data, model provider earnings, and power consumption statistics all confirm rapid adoption. The infrastructure economics required to justify the capital base remain an open empirical question. BCA’s August 2026 assessment is that ROI is beginning to appear in earnings but remains small relative to the investment being made.
The near-term hardware trade and the long-run justification thesis are not the same bet. Treating them as interchangeable is the structural error this analysis has been building toward.
What settles the debate is knowable and calendared:
- Near-term monitoring: Forward EPS revisions in AI-exposed equities, ROIC trends at major hyperscalers, and shifts in hardware supply-demand balance as new capacity comes online
- Long-run structural condition: A meaningful acceleration in U.S. productivity growth above the 10-year average, the threshold BCA’s Peter Berezin has identified as the condition for a structural bull shift, and the threshold Q2 2026 data did not meet
The $10 trillion benchmark is not a prediction of failure. It is a proportionality test, and quarterly data will increasingly be measured against it.
For investors wanting to understand how the application-layer revenue story connects to specific equity positions, our dedicated guide to AI software revenue timelines examines Goldman Sachs’s 2027 monetisation thesis and the quantified additive revenue test that separates real fundamental stories from narrative momentum.
This article is for informational purposes only and should not be considered financial advice. Investors should conduct their own research and consult with financial professionals before making investment decisions. Forward-looking statements, including revenue projections and productivity forecasts cited in this analysis, are subject to change based on market developments and evolving economic conditions.