
A composite PMI reading of 53.6 landed last week, down from 54.6 the month before, and within hours the ripples were visible everywhere. Equity futures ticked lower. The dollar firmed. Bond traders quietly repriced how much room the Federal Reserve has left to move.
One survey number. Three asset classes shifting at once. If you have watched PMI flicker across a headline or a terminal and kept scrolling, you have been walking past something professional investors act on in real time.
Here is why they move so fast. PMI data arrive weeks, sometimes months, before official GDP figures, which makes them one of the few genuinely forward-looking macro signals available every single month. The September flash readings for the US, eurozone, and UK have just landed, and they tell a consistent story: mild deceleration, services holding up, manufacturing softening. That is exactly the kind of reading that splits economists and reshapes Fed positioning.
By the time you finish this, you will know what PMI actually measures, why it moves markets before GDP does, and how to read the September data for what it means to your thinking on equities, bonds, and the dollar. This is a practical framework, not a definition.
What PMI actually measures, and why it arrives before the official data
On a screen, PMI shows up as a single number with a threshold burned into it: above 50 means the economy is expanding, below 50 means it is contracting. The US flash composite at 53.6 in September tells you activity is still growing, just less quickly than August’s 54.6. Simple enough on the surface. The structure underneath is what makes it useful.
PMI, short for Purchasing Managers’ Index, is a diffusion index built from monthly surveys of the people who actually buy things for businesses. Each month, purchasing managers across manufacturing and services report whether five core conditions are rising, falling, or staying the same. Those responses get aggregated into a single figure.
The distance from 50 matters as much as the direction. A reading of 53.6 signals moderate growth; a reading of 58 would signal much faster growth. It measures pace, not level, which is why a fall from 54.6 to 53.6 registers as “still growing, but cooling” rather than “shrinking.”
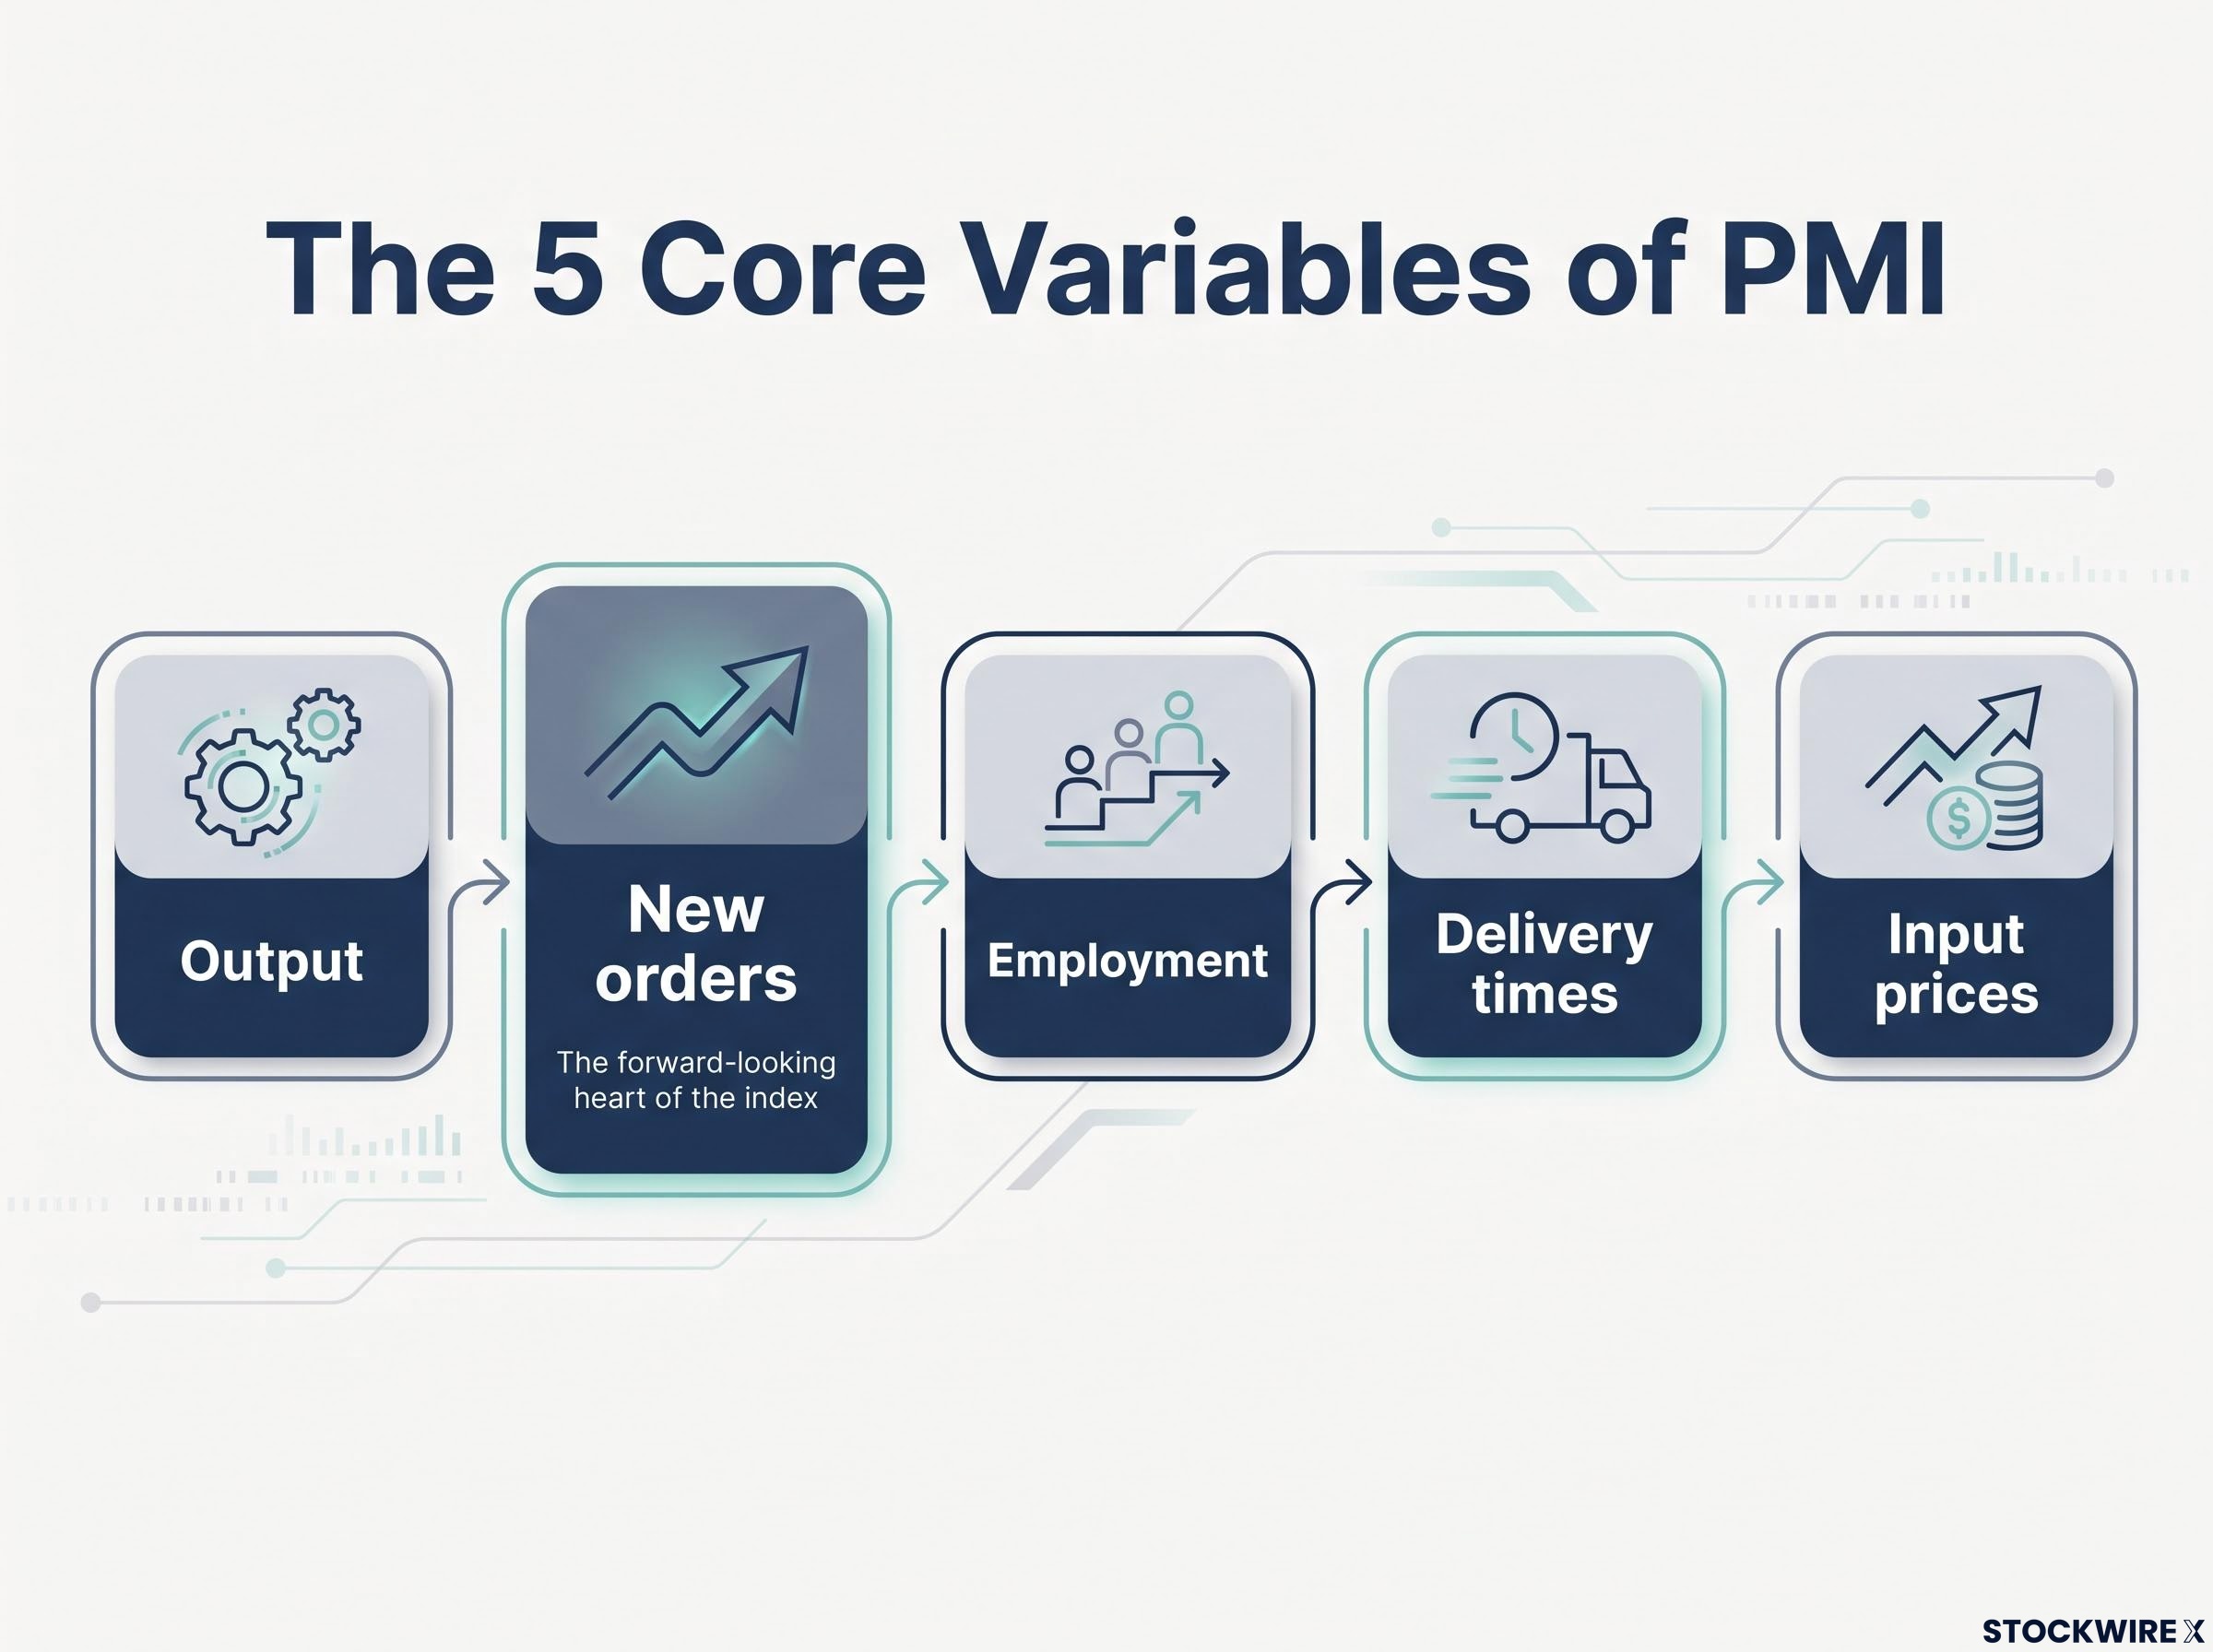
Here are the five variables every PMI survey tracks:
- Output: whether businesses are producing more or less than the previous month.
- New orders: whether incoming demand is rising or falling. This is the forward-looking heart of the index.
- Employment: whether firms are hiring or cutting staff.
- Delivery times: whether suppliers are getting faster or slower, a proxy for supply chain pressure.
- Input prices: whether the cost of materials and services is climbing or easing.
Why it arrives early enough to trade on
PMI’s leading quality comes from two structural features, and the first is pure timing. The survey is released within days of month-end, while official GDP data arrive with a lag of a full quarter or more and then get revised. That gap is not incidental. It is precisely why professional investors act on PMI before an official GDP print ever exists, and that asymmetry is where the number’s market-moving power lives.
The second feature is what the sub-indices capture. New orders and future expectations measure demand that has not yet turned into production, so they preview the GDP data before the economy has even generated it. S&P Global’s own PMI economists routinely translate the composite output index into an implied GDP growth rate.
PMI to GDP, in practice S&P Global’s economists linked a recent weak eurozone composite reading to an estimated quarterly GDP decline of roughly 0.3%. That is the mechanism in action: a survey number converted directly into a growth forecast, weeks before the official figure would confirm it.
Once you see that new orders are the leading edge of a leading indicator, you can read a flash PMI report with far more precision than a simple above-or-below-50 glance. Manufacturing new orders, and export orders in particular, are watched closely as an early signal of global trade momentum.
When big ASX news breaks, our subscribers know first
Where PMI can mislead you, and how to read around its blind spots
Confidence is useful. False precision is expensive. The same PMI number can mean genuinely different things depending on context, and reading it as a single, settled truth is how investors talk themselves into the wrong position.
Start with the sector problem. Many PMI series were designed decades ago, when manufacturing carried a much larger share of economic output. Services now dominate modern economies, yet manufacturing weakness still pulls hard on the composite. That means a manufacturing-driven decline can overstate how much the whole economy is slowing.
The 2015-2016 episode is the cleanest example. Global manufacturing PMIs softened toward and below 50 as Chinese demand cooled and commodity prices collapsed. The signal correctly flagged weaker trade and industrial production, but the US never entered a technical recession. A manufacturing-heavy index had flagged a sector recession, not a broad one.
Then there is the gap between what people feel and what actually gets produced. PMI reflects sentiment, and sentiment can overshoot in both directions on the back of headlines, temporary shocks, or a shift in who happened to answer the survey. It does not always map cleanly onto recorded output.
PMI false recession signals have been documented at a rate of roughly 30-40% across advanced economies, meaning a sub-50 composite reading is a warning to investigate rather than a verdict to act on immediately.
The 2022-2023 period showed this at scale. Eurozone and UK manufacturing PMIs sat in sustained contraction while services held near 50, producing soft composite readings. S&P Global tied some of those readings to quarterly GDP declines of about 0.3%, yet several economies delivered only shallow or short-lived contractions rather than deep recessions.
The four blind spots worth holding in mind:
- Manufacturing bias: the index can exaggerate overall weakness when the drag is concentrated in factories rather than the wider economy.
- Survey sentiment drift: it captures mood, which can run ahead of or behind the hard data.
- Turning-point noise: a dip from 55 to 52 is consistent with slower but healthy growth, not imminent contraction.
- Country calibration differences: the same PMI level maps to different GDP growth rates depending on an economy’s structure.
| Episode | PMI signal | What happened to GDP | Key lesson |
|---|---|---|---|
| 2015-2016 global slowdown | Manufacturing PMIs fell toward or below 50 | US avoided a technical recession | Manufacturing-heavy PMIs can overstate broad recession risk |
| 2020 pandemic shock | Composite PMIs collapsed across regions | Sharp Q2 GDP plunge, closely matched | PMI is an accurate real-time signal once a shock is unfolding |
| 2022-2023 divergence | Manufacturing in contraction, services near 50 | Only shallow or short-lived GDP declines | Recession signals are strongest at sector level, not headline |
Apply that to September. The US composite sits at 53.6 while eurozone manufacturing is at 49.5, below the line. That is not one unified recession signal. It is a set of readings that demand disaggregation, and if you treat the composite as a single verdict, you will misread current conditions in one of two equally costly directions.
How the September readings translate into equity, bond, and currency signals
PMI does not move markets directly. It moves the expectations that markets are built on, and those expectations run through three channels before they show up as a price change.
Here is the transmission chain, step by step:
- The print lands relative to the prior month, the 50 line, and the consensus forecast.
- The expectation channel fires: the number shifts the outlook for corporate earnings, the path of interest rates, and relative growth between economies.
- The asset-class outcome follows: equities reprice on earnings, bonds reprice on the rate path, and currencies reprice on growth differentials.
Context decides how each print lands. Right now, that context is unusual. The Fed has already moved its projected year-end rate from 3.88% in June to 4.1%, implying at least one more hike is coming. Meanwhile the Atlanta Fed’s GDPNow model put Q3 2026 growth at 5.1% annualised, updated 17 September 2026.
Growth strong, policy tightening GDPNow tracking 5.1% annualised against a Fed rate target of 4.1% frames the whole picture. This is not a fragile economy where a soft PMI reads as a recession warning. It is a firm economy where a soft PMI reads as welcome cooling, or as the first crack, depending on what comes next.
That distinction matters for what you do with a print like 53.6. In a weak or rate-cutting environment, a mild deceleration would feed straight into a dovish rate call. In this environment, it lands more ambiguously, which is why the surprise relative to consensus does so much of the work. A number that stays comfortably above 50 can still trigger a risk-off move if it undershoots forecasts, because it nudges the perceived odds of a soft landing.
The market pre-pricing of PMI trends means the absolute reading matters less than the surprise relative to consensus, a dynamic that explains why a print comfortably above 50 can still trigger a risk-off move if it undershoots forecasts by even a point.
| Economy | Composite PMI (Sep) | Composite PMI (Aug) | Direction | Immediate market signal implied |
|---|---|---|---|---|
| United States | 53.6 | 54.6 | Lower | Still growing; direction supports caution, not alarm |
| Eurozone | 51.2 | 51.0 | Higher | Marginal improvement, but manufacturing still below 50 |
| United Kingdom | 52.9 | 53.8 | Lower | Softening from a solid base |
The clearest near-term read from this table is a dollar-supportive one. US growth at 53.6 is outrunning the eurozone at 51.2 and the UK at 52.9, and stronger relative growth tends to support the currency of the faster-growing economy. That is the firmer-dollar thesis in a single row.
Watch one variable above the rest: selling price inflation. The S&P Global flash report noted it cooling, and that complicates the higher-for-longer narrative. If prices keep easing, the Fed’s next move could get pulled forward. If they re-accelerate, the tightening trajectory holds. That single sub-index is the swing factor for all three asset classes.
Why mild deceleration is the hardest PMI signal to interpret
An above-50-but-falling reading is the most contested signal in the whole toolkit, and serious analysts genuinely disagree about what September is telling them. These are not idle positions. They are three coherent readings of the same data, and the uncertainty between them is the uncertainty professionals actually sit with.
The first reading is the soft landing. On this view, the drift from the high-50s toward the low-50s is policy working exactly as designed: demand cooling without breaking. S&P Global’s own G4 PMI output index, at 52.6 and down from 53.2, was described by its economists as consistent with above-trend but moderating developed-world growth. That is the soft-landing case in a single data point.
The second reading is the precursor to contraction. Deceleration has a habit of persisting, and once manufacturing weakness broadens, sub-50 composite readings and softer GDP tend to follow. Eurozone manufacturing at 49.5 in September, already below the line while services hold at 51.4, is the detail this camp points to.
The third reading is sectoral noise. On this view, manufacturing weakness reflects inventory cycles or one-off shocks that never spread to the wider economy, so a soft composite overstates the risk. The Citigroup Economic Surprise Index, which fell sharply through August before stabilising, gives this camp something to work with.
The indicators that will tell you which PMI narrative is winning
You do not resolve this ambiguity by staring harder at the PMI. You resolve it by watching what the October data does to a handful of complementary signals. Chris Williamson and the S&P Global PMI team have long stressed that the index is at its most predictive when confirmed by labour markets, credit conditions, and nowcast models like GDPNow.
Here is the checklist to carry into next month’s data:
- Labour market data: continued strength contradicts the contraction narrative and supports the soft landing.
- Credit spreads: widening spreads support the contraction narrative; stability undercuts it.
- Housing indicators: further weakness would broaden the case that the slowdown is real, not sectoral.
- GDPNow revisions: a downward move would shift the balance materially toward the defensive read.
The honest verdict on September is that it sits in a zone where the outcome depends on whether manufacturing weakness broadens or price indices re-accelerate. The scenario that would trouble the Fed most is stagflationary: mild deceleration alongside still-elevated prices, which denies the Fed a clean dovish pivot and complicates policy and allocation at the same time. Anyone claiming certainty in either direction right now is running ahead of the evidence.
The Federal Reserve dual mandate requires the Fed to balance price stability against maximum employment, and a PMI reading that shows growth cooling alongside still-elevated prices puts those two objectives directly in tension, which is precisely why the September composite creates interpretive difficulty for policy positioning.
Putting it together: how to use PMI as one input in a multi-signal framework
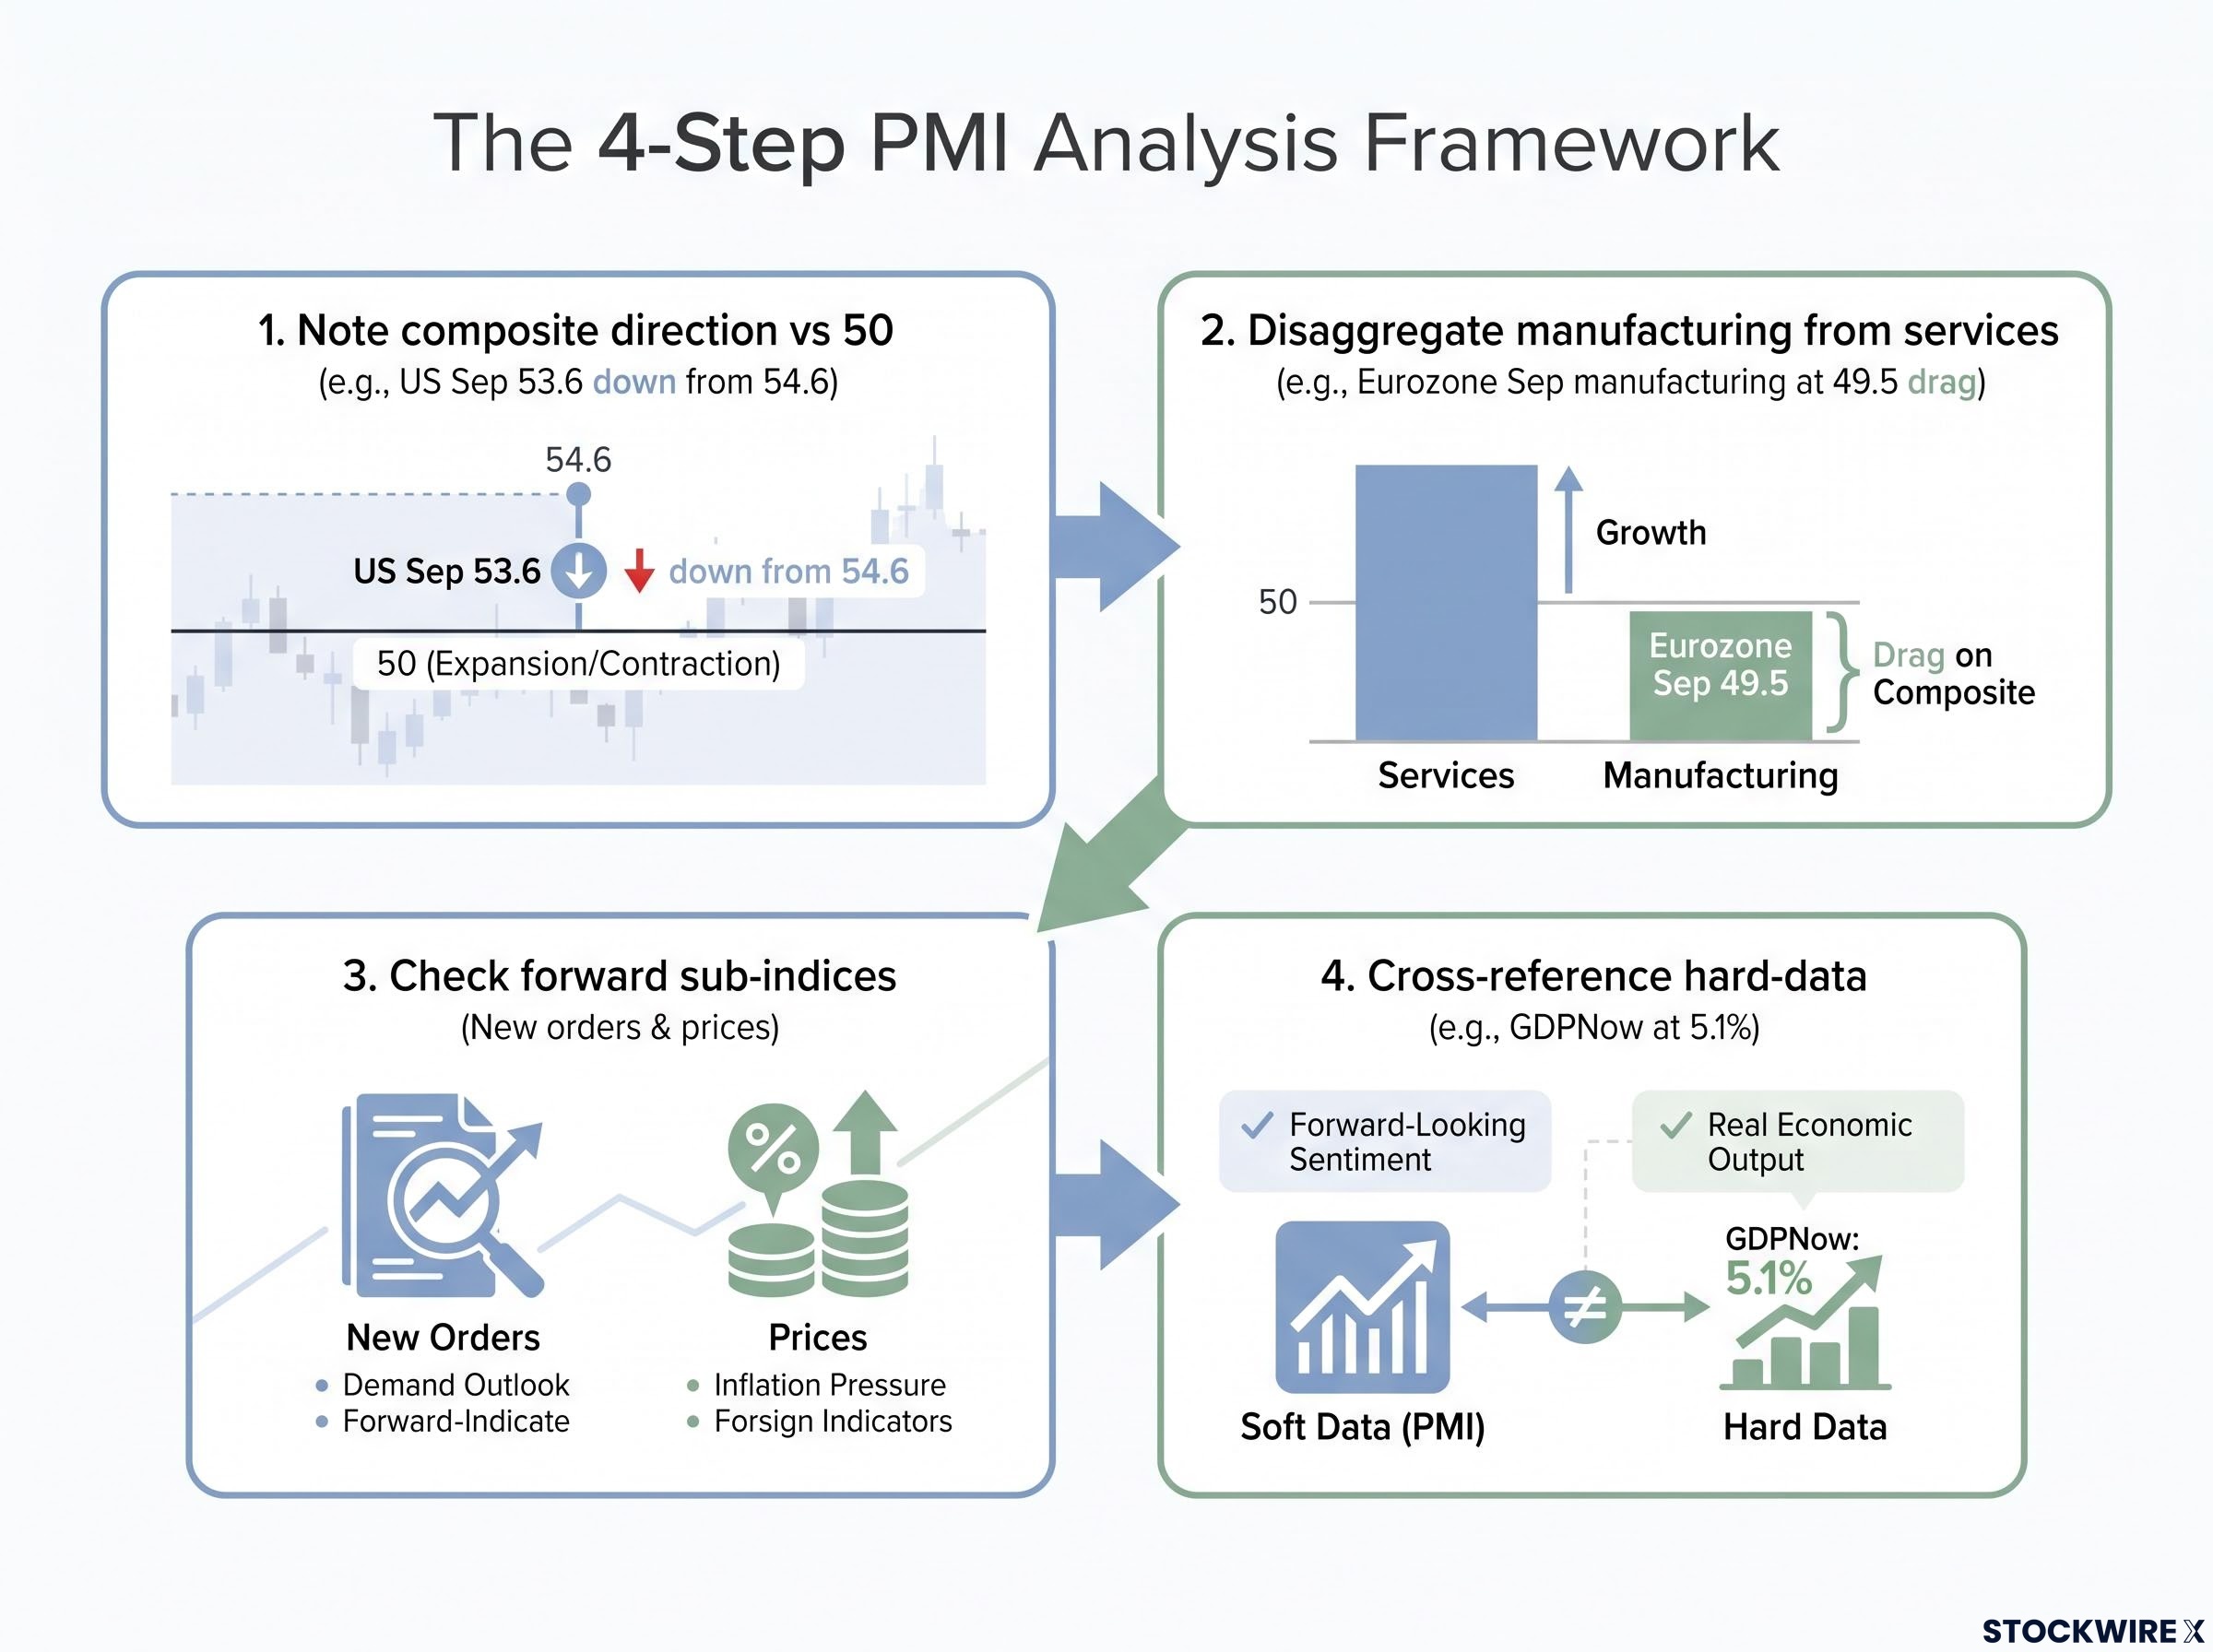
Understanding PMI is one thing. Using it without being whipsawed by the headline number is another. Here is a repeatable four-step process you can apply to the next release, and every release after it.
- Note the composite direction. Where does it sit versus the prior month, and versus 50? September’s US composite at 53.6, down from 54.6, tells you growth is intact but slowing.
- Disaggregate manufacturing from services. Identify which sector is driving the move. In September, eurozone manufacturing at 49.5 is the drag; services are holding the composite up.
- Check the forward sub-indices. New orders and prices carry the signal about what comes next. Cooling selling prices are the variable to flag this month.
- Cross-reference one hard-data input. Before drawing any conclusion, check the PMI against GDPNow, payrolls, or the ISM. GDPNow at 5.1% annualised currently argues against reading September’s softness as a warning.
The Atlanta Fed GDPNow model updates its nowcast estimate in near real time using available hard economic data rather than subjective adjustments, which is what makes its Q3 reading a genuinely independent cross-check on the PMI survey signal rather than a correlated one.
The surprise relative to consensus matters as much as the absolute reading, so track economist forecasts ahead of each release. You want to arrive with a prior expectation, read the surprise against it, and update your view only on the variables that actually move your positions.
How institutions treat it The IMF and OECD both use PMI as a key input to their nowcasting frameworks, run alongside other high-frequency indicators, rather than as a standalone predictor. If the institutions with the most resources treat PMI as one signal among several, that is a useful discipline for a self-directed investor to borrow.
The 2020 pandemic is the clearest case of this framework working as intended. Composite PMIs collapsed at the same time as every other high-frequency signal, and together they delivered an early, accurate recessionary read that no single indicator would have confirmed alone. That is the difference between knowing what the data said and knowing what to do with it.
What September’s readings mean for the months ahead
The September pattern is coherent once you hold all of it at once: composite readings above 50 in the US, eurozone, and UK, manufacturing underperforming services in every geography, and a mild deceleration that genuinely fits both the soft-landing story and the early-warning story. You are not meant to have a verdict yet. You are meant to know what would produce one.
G4 PMI expansion through August 2026, with all four major economies posting composite readings above 50 for a second consecutive month, provides important context for reading the September deceleration: it represents a drift from an unusually strong base, not a break from a fragile one.
Three variables will settle it through Q4:
- Eurozone manufacturing PMI: a move back above 50 would ease the contraction case; a further slide below 49.5 would broaden it.
- US selling price inflation in PMI reports: continued cooling releases pressure on the Fed and could pull a rate cut forward; re-acceleration keeps the tightening path in place.
- GDPNow revisions: holding near 5.1% supports the soft landing; a downward move tilts the balance toward a defensive posture.
The first hard-data test comes soon. The Atlanta Fed’s 5.1% GDPNow estimate for Q3 will be checked against official GDP data expected in late October, the first proper read on whether PMI’s resilient signal was accurate. The specific moment to reassess your positioning is when October PMI lands alongside those revised GDPNow figures, because together they will either confirm the soft landing or shift the balance toward caution across equities and duration.
Remember the lesson of 2019: PMI highlighted underlying fragility well before the COVID shock arrived. It cannot predict shocks, but it can flag which economies are entering one with limited buffer. That is your role now, not passively reading PMI headlines, but evaluating each monthly release on its own terms.
This article is for informational purposes only and should not be considered financial advice. Investors should conduct their own research and consult with financial professionals before making investment decisions.
Past performance does not guarantee future results. Financial projections are subject to market conditions and various risk factors. These statements are speculative and subject to change based on market developments.