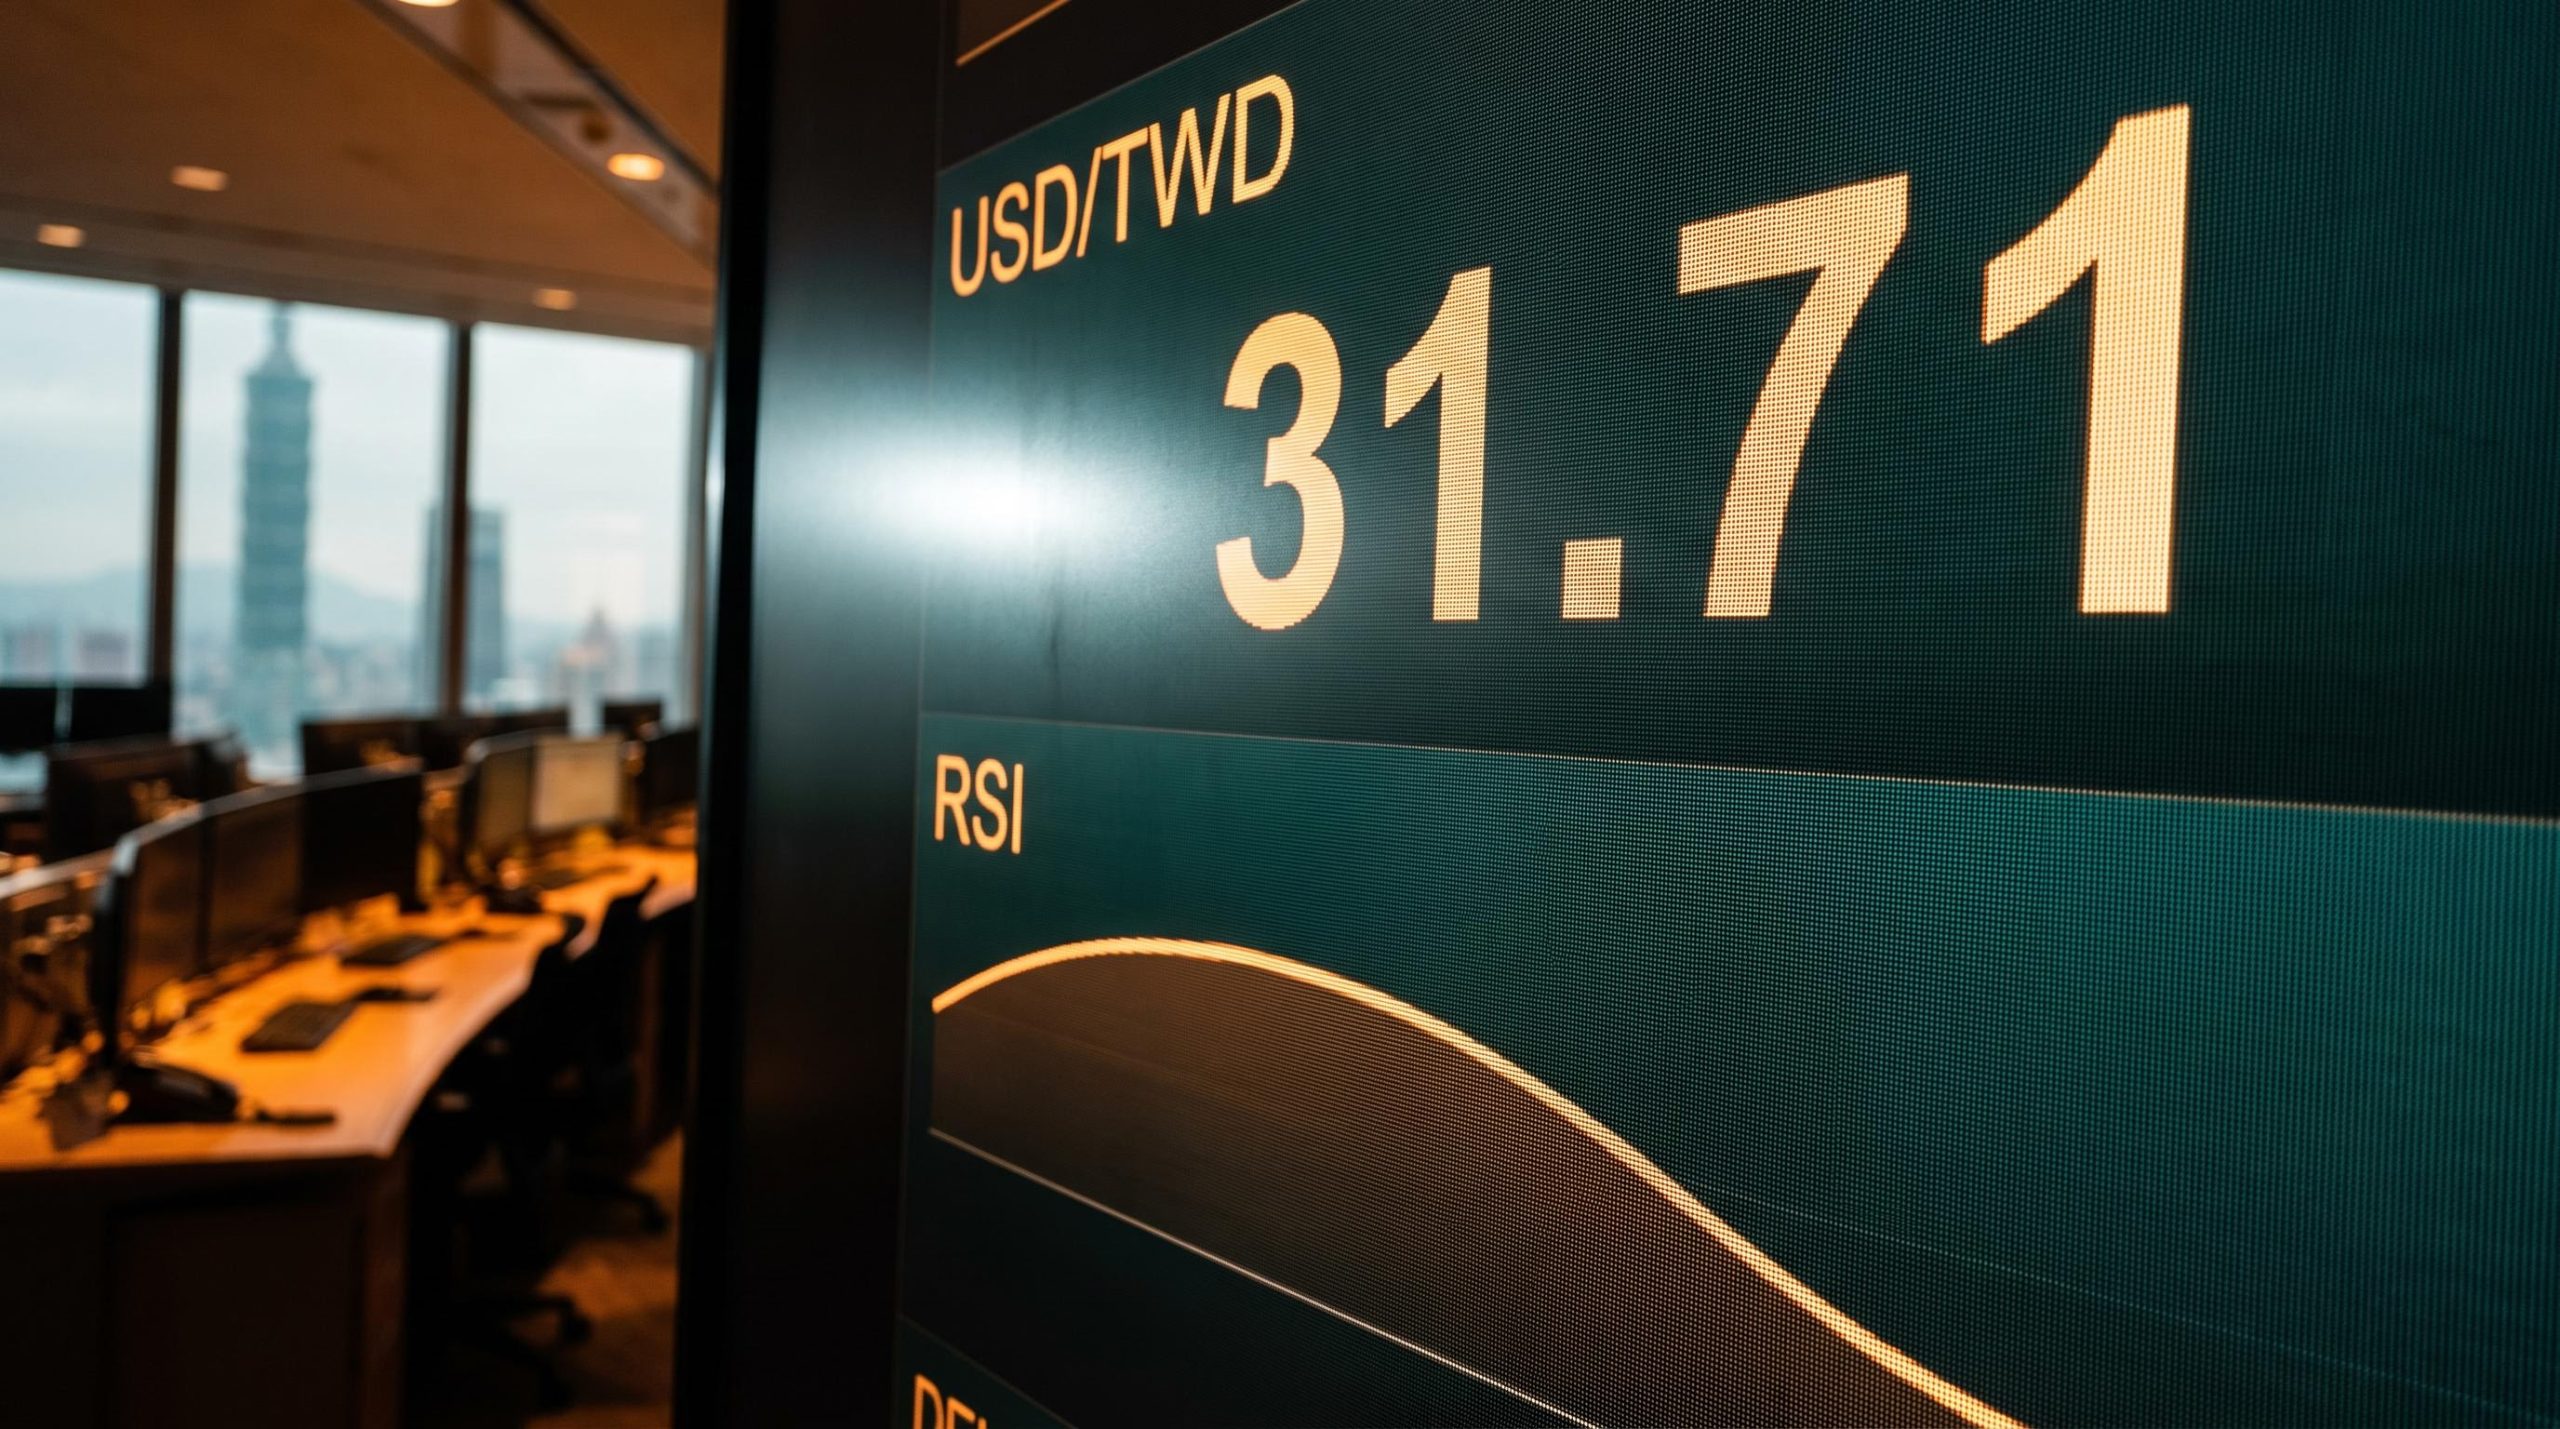
The simple story about the Taiwan dollar goes like this: artificial intelligence is booming, TSMC sits at the centre of it, foreign money floods into Taiwanese equities, and the currency rises. It is clean. It is also incomplete. Right now, the Taiwan dollar has arrived at a technical confluence zone around 31.70-31.71 at the very moment its momentum indicator is turning down and institutional investors have quietly trimmed their bullish bets.
That tension is the whole story. The USD/TWD pair is not a routine currency trade; it is the product of a mechanical linkage between global AI capital flows, TSMC’s gravitational pull on foreign equity portfolios, and a central bank threading the needle between smoothing volatility and avoiding US Treasury scrutiny. For anyone holding Taiwanese equities, Asian currency exposure, or AI-linked assets, the next move matters directly.
Here is what the charts and the capital flow data together tell you about the Taiwan dollar’s likely direction, which flow variables act as the real leading indicators, and which risks could break the appreciation case before year-end.
What the charts are actually saying at 31.71
Start with where the pair sits. Taiwan’s Central Bank (CBC) reported the USD/TWD exchange rate at 31.758 on 21 September 2026, with the currency trading tightly around the 31.71 zone in the sessions that followed. Earlier in the month, rates hovered between 31.73 and 31.78, and Reuters used an indicative rate of 31.7770 on 2 September 2026. This is a market that has stopped moving decisively and started consolidating.
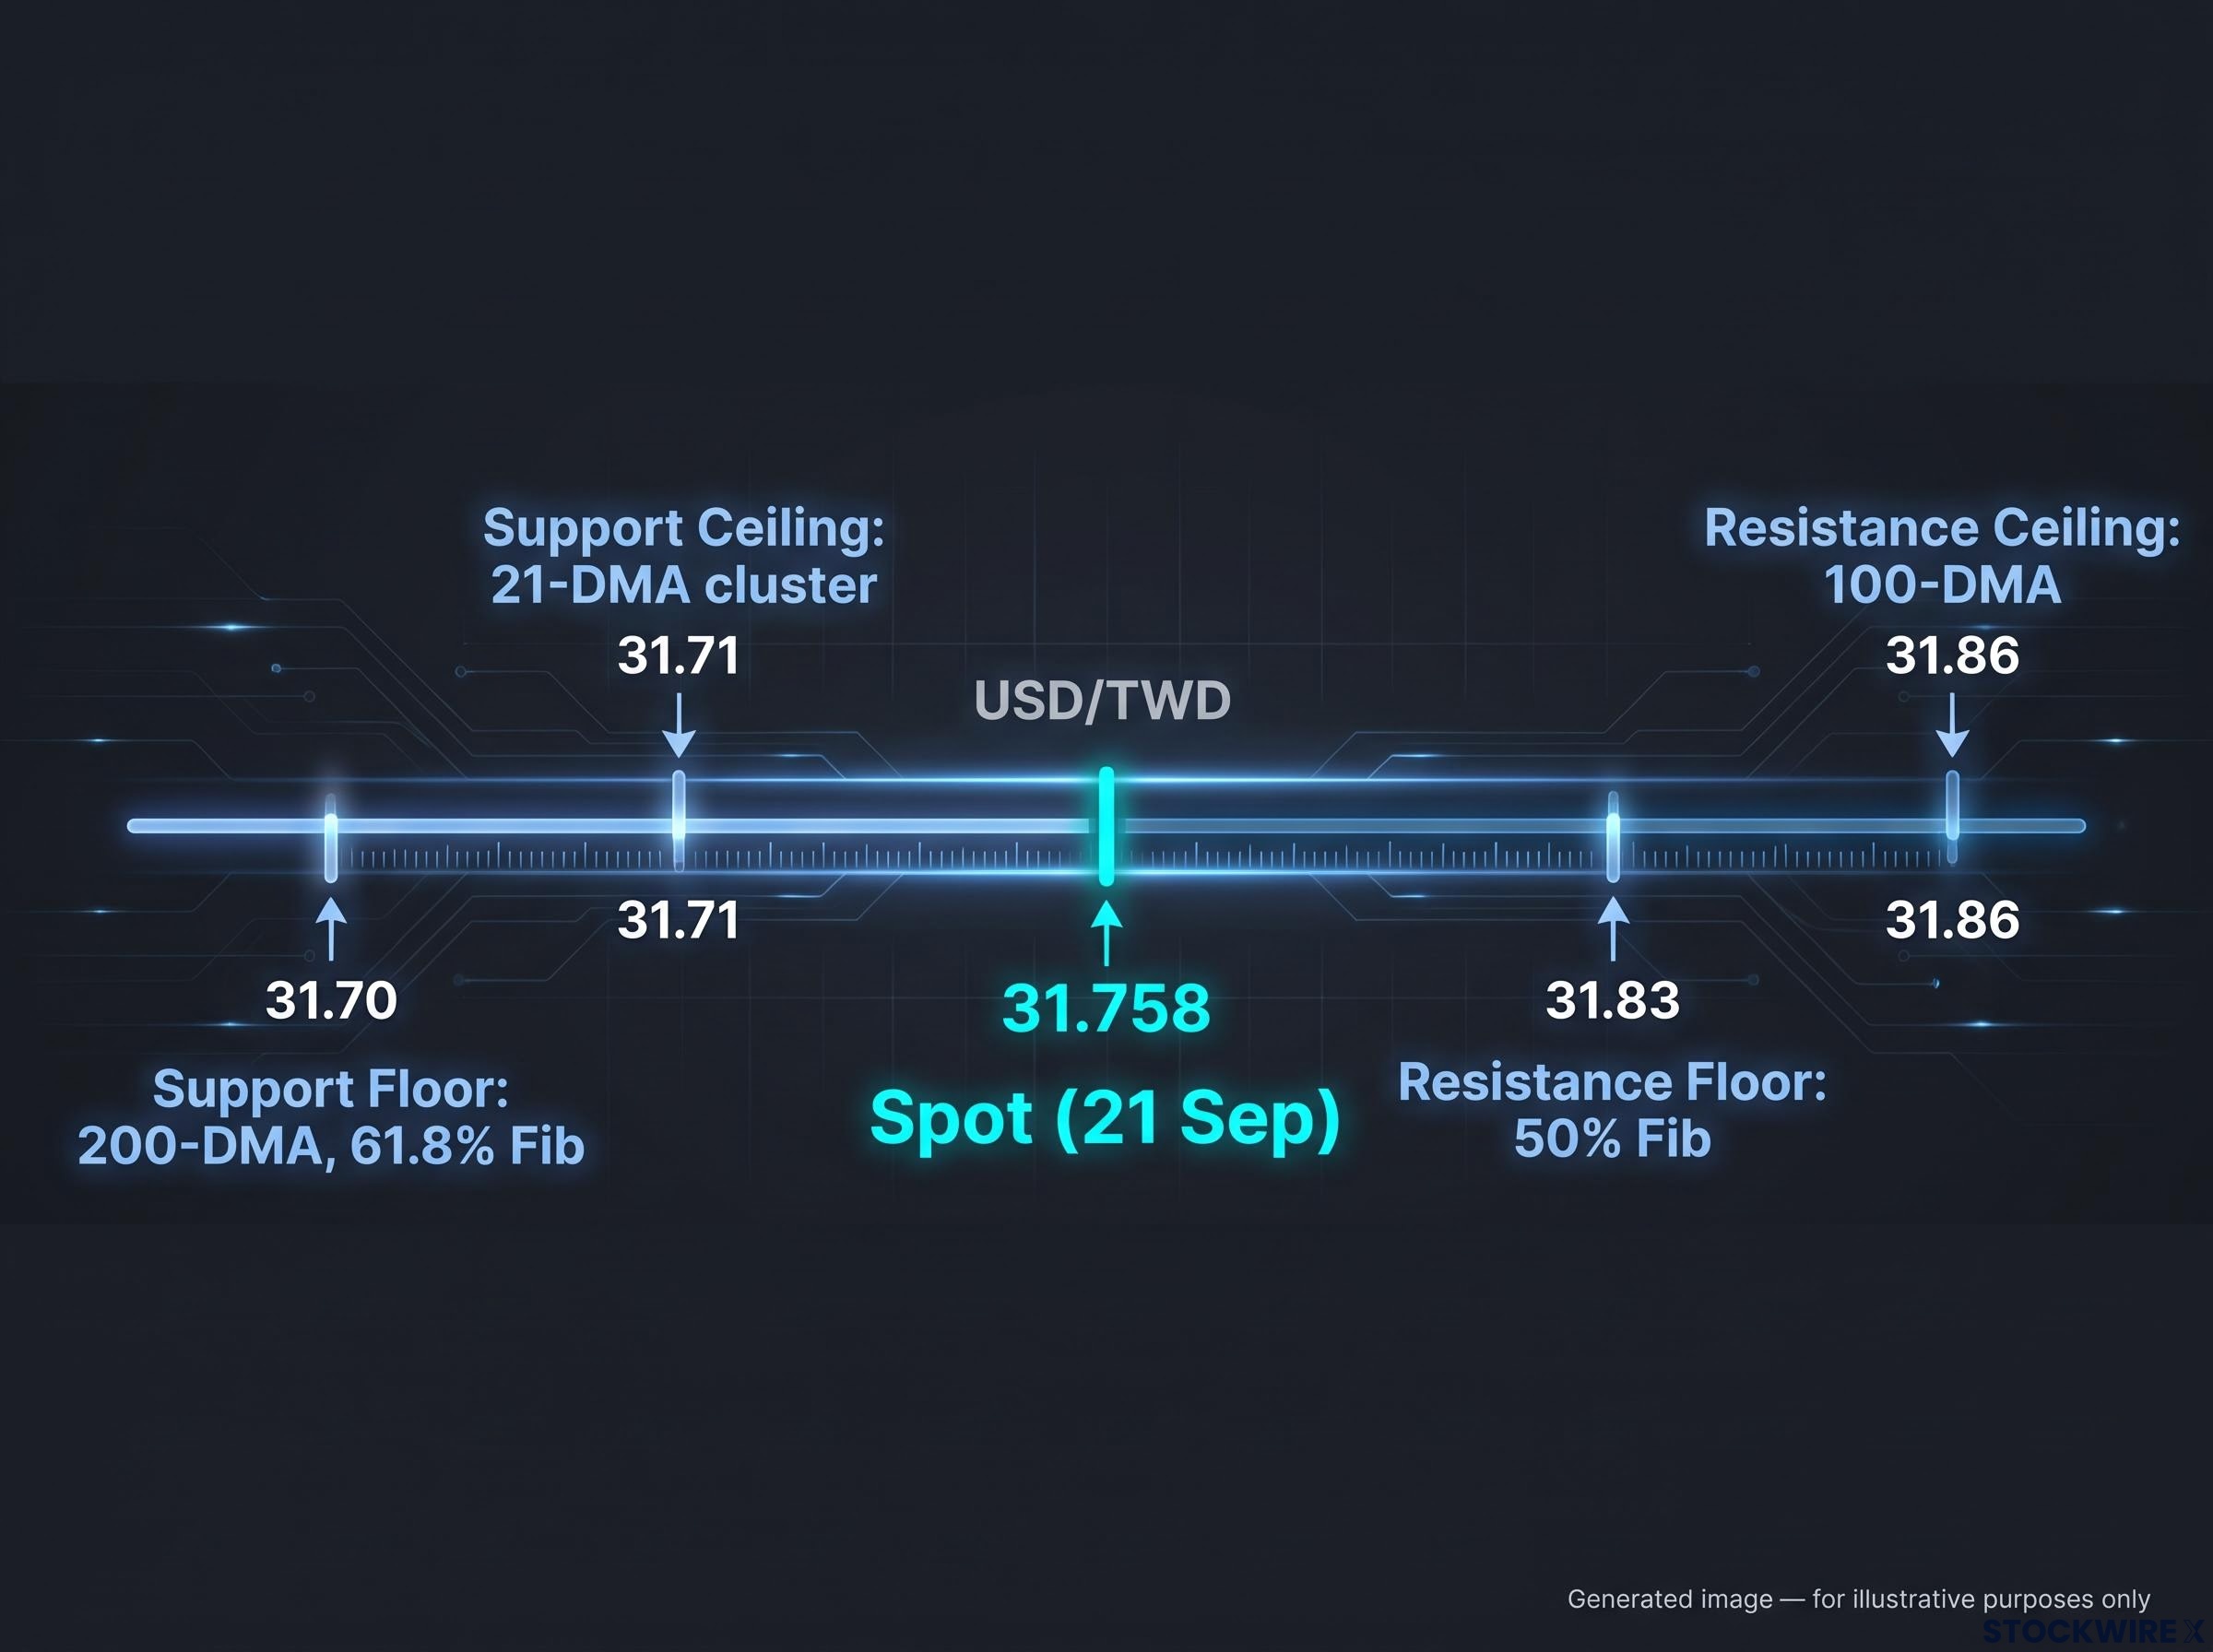
Now look at what makes 31.71 more than a round number. According to OCBC strategists Sim Moh Siong and Christopher Wong, the 31.70-31.71 support zone lines up with three separate technical markers at once: the 21-day moving average, the 200-day moving average, and the 61.8% Fibonacci retracement of the 2026 low-to-high range.
OCBC on the structural anchor The 31.70-31.71 zone represents a rare alignment of the 21-day and 200-day moving averages with the 61.8% Fibonacci retracement of the 2026 range, making it a structurally significant floor rather than an arbitrary line on the chart, according to OCBC strategists Sim Moh Siong and Christopher Wong.
The ceiling is just as defined. Resistance sits between 31.83 and 31.86, where the 100-day moving average meets the 50% Fibonacci retracement. For the appreciation thesis to advance, the Taiwan dollar has to push through that band and hold there.
The pair has tested but not broken either boundary. An intraday low of roughly 31.709 briefly touched the stronger side of support before retreating, which is textbook consolidation behaviour, not a breakout.
Here is the map in one view.
| Level | USD/TWD | Technical basis | Directional implication |
|---|---|---|---|
| Support floor | 31.70 | 200-DMA, 61.8% Fib retracement | TWD-positive if it holds |
| Support ceiling | 31.71 | 21-DMA cluster | Decision line for consolidation |
| Spot (21 Sep) | 31.758 | CBC reference rate | Mid-range, no conviction |
| Resistance floor | 31.83 | 50% Fib retracement | First hurdle for TWD strength |
| Resistance ceiling | 31.86 | 100-DMA | Confirms bullish break if cleared |
The triple confluence at 31.71 tells you this is a level professional positioning has clustered around deliberately. A sustained break in either direction carries more weight than an ordinary daily move, which is exactly why it is the line to watch.
What the RSI turn means in practice
The complication is momentum. The Relative Strength Index, a measure of how fast and how far price has moved recently, has turned downward from bullish territory on the daily chart.
A falling RSI is not a sell signal. It signals that upward momentum is cooling, not that the trend is reversing. That distinction matters most at a level like this one, where the currency is already sitting on heavy support.
Read together, the downward RSI and the proximity to the 31.71 floor point toward consolidation as the base case. The market is pausing to reassess rather than committing to a new direction.
When big ASX news breaks, our subscribers know first
The AI-to-currency pipeline: how foreign equity flows move the Taiwan dollar
Currency strength that appears to come from sentiment usually has a mechanism underneath it. With the Taiwan dollar, the mechanism is unusually direct and worth understanding link by link.
When a foreign investor buys Taiwanese shares, they must first convert their money into Taiwan dollars. That conversion is spot demand for the currency. And crucially, equity investors behave differently from bond investors here.
Global capital flows in 2026 have sorted along AI supply chain fault lines, with US semiconductor ETFs posting record monthly gains while Taiwan and South Korea attract institutional positioning that travels through equity markets rather than bond markets, bypassing the hedging mechanisms that would otherwise dampen spot currency demand.
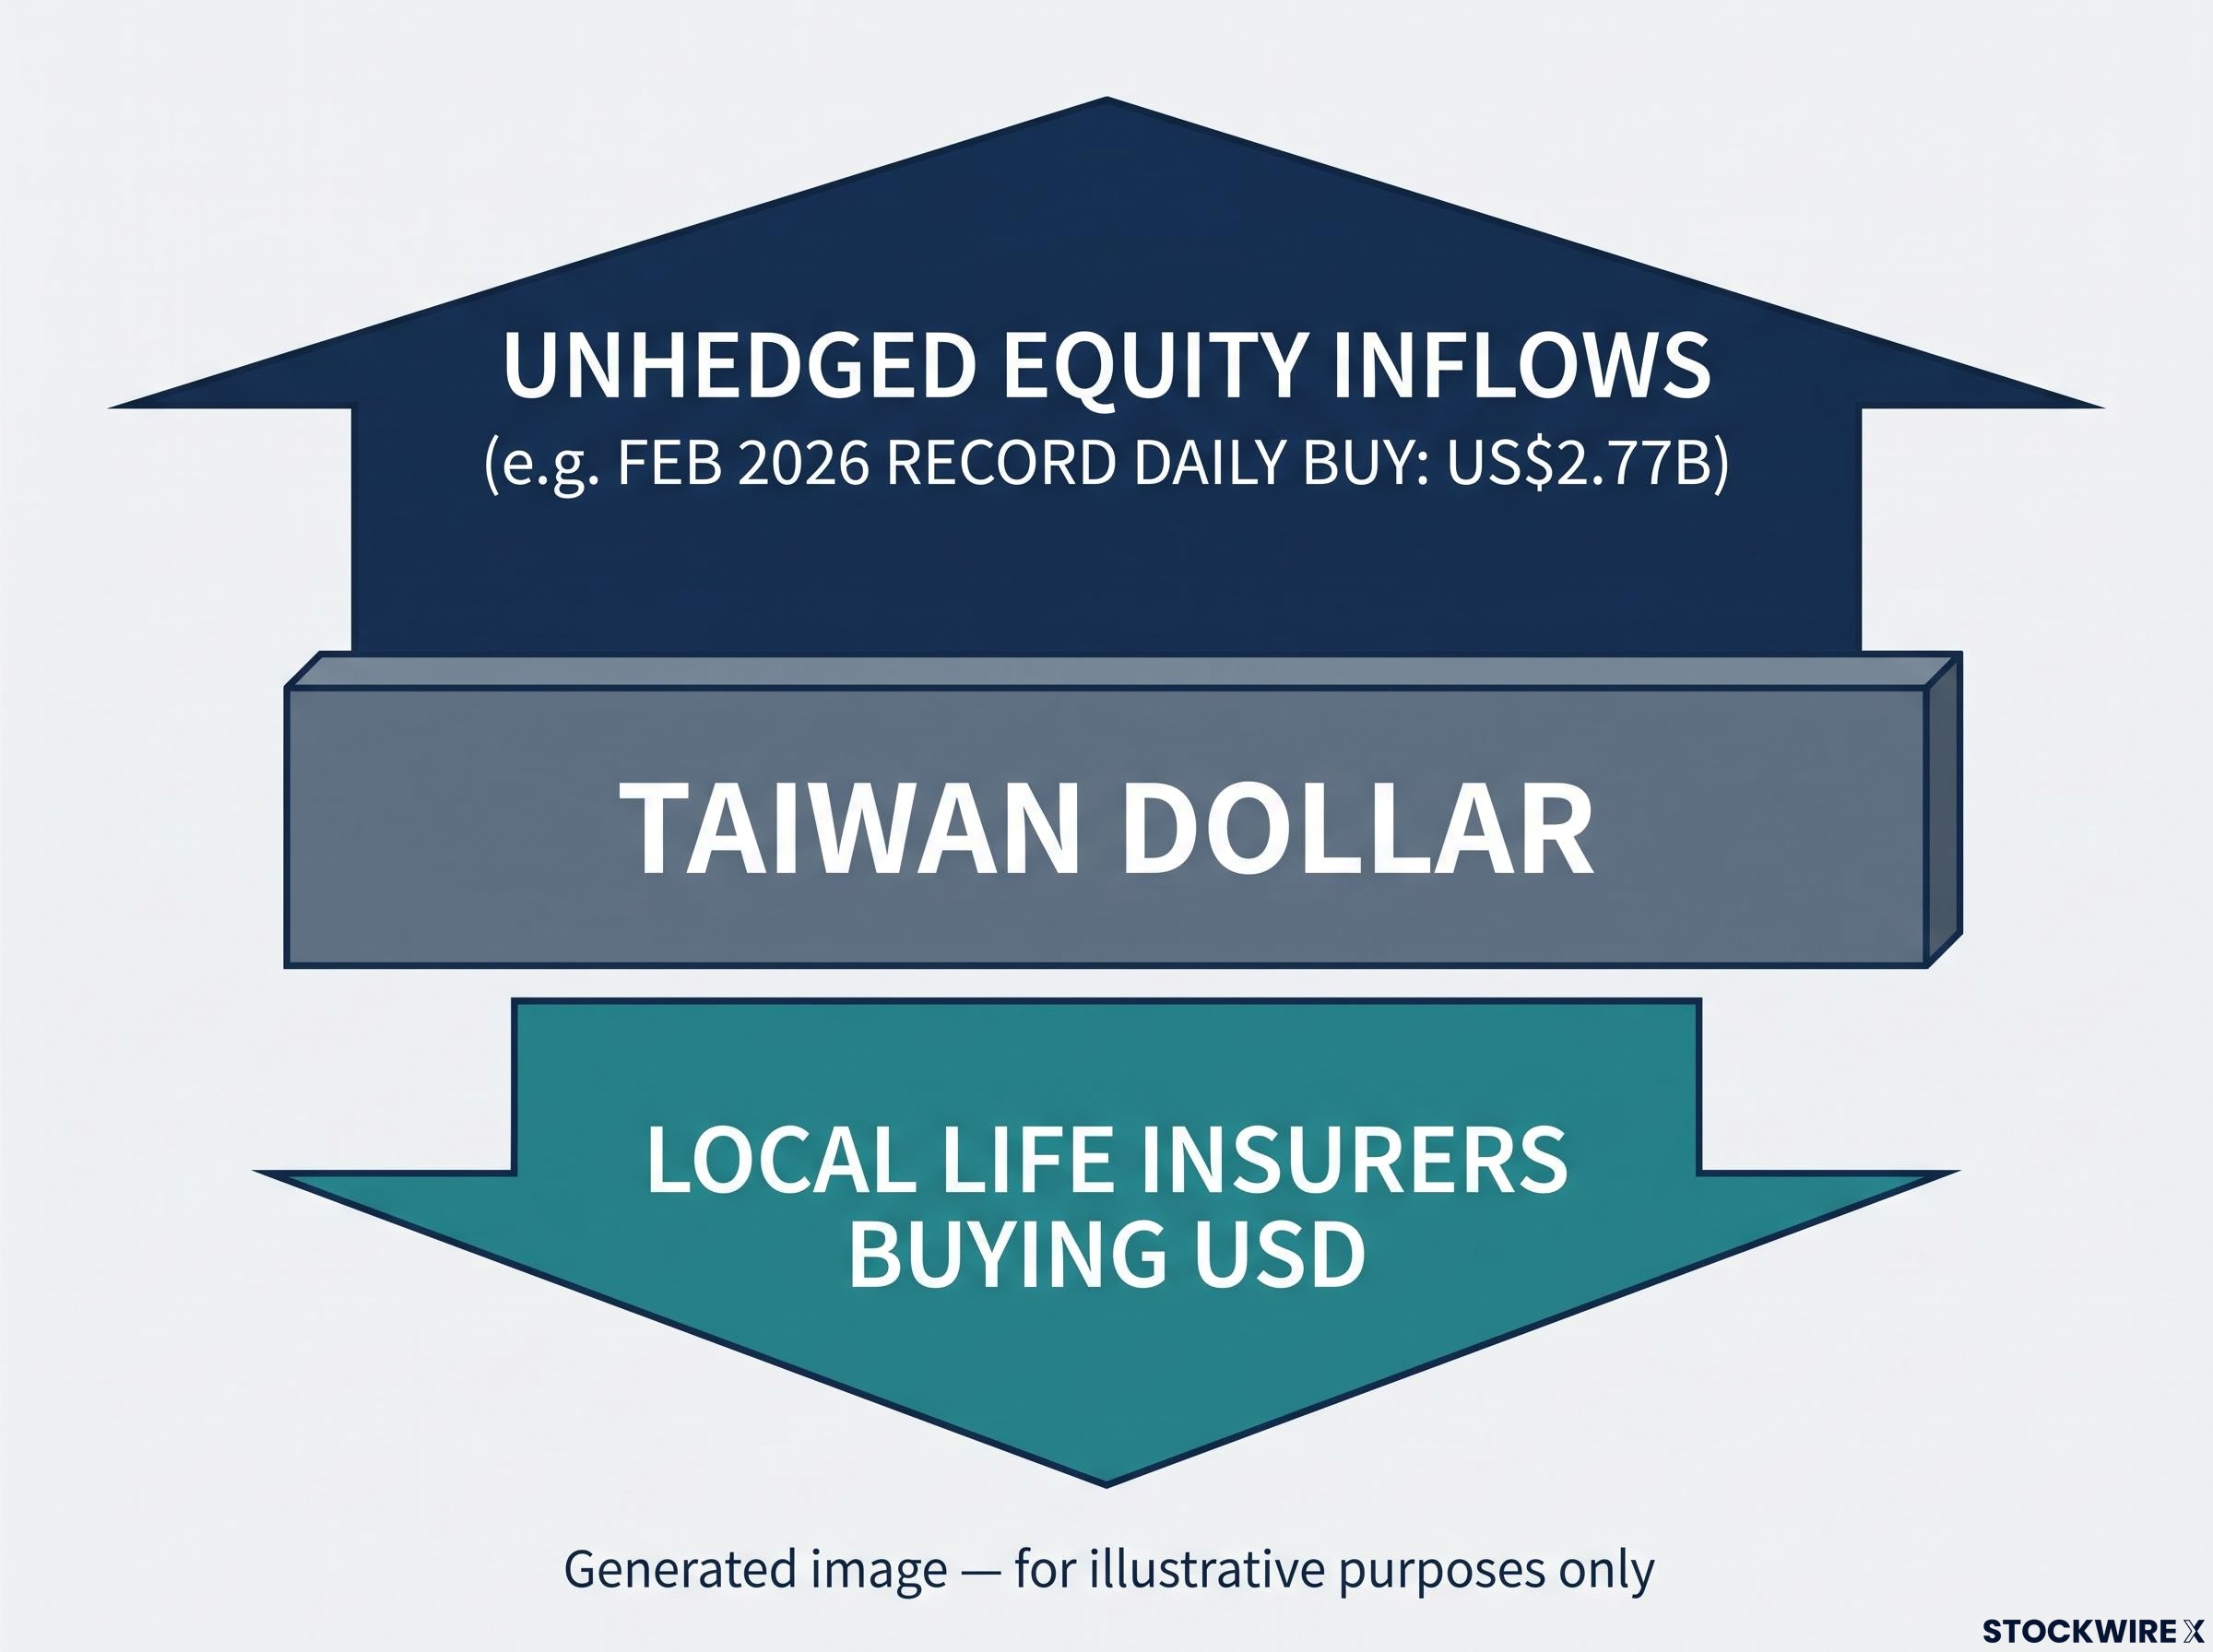
DBS Bank’s Eugene Goh on why equity flows hit spot directly Equity investors typically do not hedge their foreign exchange exposure the way fixed-income investors do, according to DBS Bank’s Eugene Goh, cited by the Taipei Times. That absence of hedging means equity inflows translate almost directly into demand for the Taiwan dollar.
The scale of those inflows across 2026 tells the story of the mechanism at work:
- Q1 2026 net foreign institutional inflow of US$17.852 billion (FSC via FocusTaiwan, 8 April 2026), part of a cumulative US$338.012 billion since Taiwan opened to foreign institutional money at the end of 1990.
- A record single-day net buy of US$2.77 billion in February 2026 during TSMC’s rally toward a US$2 trillion market cap, the largest daily net purchase since December 2005 (Bloomberg via Taipei Times), putting the month on track for roughly US$7 billion of inflows.
- A net foreign buy of NT$17.34 billion in the 22 July 2026 session (TWSE via Taipei Closing Bell).
- Roughly US$372 million in net foreign equity purchases in the most recent session referenced by OCBC.
That is the buying side. But there is a counterforce most currency-watchers miss, and it explains why the Taiwan dollar rarely rises as far as the gross flow numbers suggest.
Local life insurers are steady buyers of US dollars. The Taipei Times notes that their consistent USD purchasing tempers the Taiwan dollar’s gains even during strong inflow periods, effectively soaking up part of the appreciation pressure that foreign buying creates.
For you, the practical implication is timing. Because the life insurer counterflow runs constantly in the background, the currency’s appreciation path is slower and choppier than a headline inflow figure implies. Anyone trying to time a currency entry around an equity flow catalyst is working with a net outcome, not the gross number, and the two can diverge meaningfully.
Structural tailwind or cyclical trade? Reading the AI semiconductor cycle for currency signals
The structural case for the Taiwan dollar is genuinely strong, and it starts with the central bank itself.
At its 17 September 2026 decision, the CBC held its policy rate at 2.0% for a tenth consecutive meeting. Commerzbank analysts Charlie Lay and Henry Hao noted that the bank nudged up both its 2026 GDP and inflation forecasts, citing AI-related semiconductor demand as the driver.
The CBC monetary policy decision from 17 September 2026 confirmed the benchmark rate hold at 2.0% while revising up both the 2026 GDP growth and CPI forecasts, with the board explicitly citing AI-driven semiconductor demand as the primary upside driver.
Commerzbank on the policy backdrop The CBC’s stance is best described as “patient,” with the bank holding rates while monitoring inflation and leaving open the possibility of a first hike in Q1 2027 if price pressures persist, according to Commerzbank analysts Charlie Lay and Henry Hao.
This is the credible version of the bull case. Taiwan’s centrality to the global AI hardware supply chain, anchored by TSMC, gives it a durability of foreign interest that most emerging markets simply do not have. A central bank raising its growth forecasts on that basis is not a trivial endorsement.
Then June 2026 happened. According to the Institute of International Finance (IIF), reported by Reuters on 10 July 2026, foreign investors pulled US$18.3 billion out of Taiwanese equities in a single month, part of a broader US$46.1 billion exodus from emerging-market stocks. Tech-heavy Taiwan and South Korea led the retreat.
Asian equity outflows reached US$134 billion through mid-June 2026, more than triple the full-year 2025 figure, a regime change in capital flow behaviour that placed Taiwan alongside South Korea as the primary sources of institutional selling and demonstrated how quickly the structural AI positioning can unwind under global risk-off conditions.
That single figure is the most important data point for calibrating how durable the appreciation story really is. A US$18.3 billion exit in one month can undo months of structural positioning, which demonstrates that AI optimism, however well-founded, is not a hedge against a global risk-off episode.
The comparison below shows how sharply the same market can swing within one calendar year.
| Period | Direction | Magnitude | Trigger | TWD impact |
|---|---|---|---|---|
| Q1 2026 | Net inflow | US$17.852B | AI/semiconductor rally | Appreciation pressure |
| June 2026 | Net outflow | US$18.3B | Global risk-off | Depreciation pressure |
The IIF and Reuters framing places Taiwan alongside South Korea as a tech-heavy market exposed to boom-bust equity cycles. That gives you a useful historical analogy: the Taiwan dollar tends to behave like the Korean won through semiconductor and memory-chip cycle turns, rising hard on the way up and reversing sharply on the way down.
The honest read is hybrid. The AI semiconductor tailwind is real and structural, but realised currency demand runs through cyclical portfolio flows that can reverse fast. You do not have to choose between the two views. You have to hold both at once and size your risk accordingly.
The risk map: what could break the TWD appreciation thesis before year-end
Not all risks deserve equal attention. The useful question is which variables you should actively monitor and which are background noise. Three near-term risks sit at the top of the list.
- Global risk-off and USD strength: A Reuters mid-September 2026 positioning poll found investors had already pared back bullish bets on the Taiwan dollar, alongside the Singapore dollar and Korean won, amid renewed dollar strength and higher oil prices. This risk is not hypothetical; it is already showing up in positioning data.
- Domestic life insurer USD buying: The steady USD purchasing documented by the Taipei Times acts as a persistent structural cap, quietly limiting how far the currency can appreciate regardless of foreign inflows.
- The technical pain point: With the RSI turning down and institutional bullishness trimmed, the market’s near-term vulnerability is a failure to hold 31.71, not a failed breakout through 31.83-31.86.
Dollar strength and EM currency pressure are not independent risks: BIS research links a 100-basis-point rise in the US term premium to roughly a 6% depreciation in emerging market currencies and sizeable equity outflows, a transmission mechanism that would hit TWD positioning through the same global risk-off channel that drove the June 2026 exit.
Combine those and the picture sharpens. The 31.71 floor is thinner than the technical confluence alone suggests, because the same conditions that would test it (a stronger dollar, deteriorating risk sentiment) are the ones already reflected in reduced institutional conviction.
Medium-term structural risks: policy, geopolitics, and concentration
The CBC’s room to defend the currency is more constrained than it looks. After the US Treasury’s currency report, the bank publicly stated it maintains good communications with the Treasury (Reuters, 24 July 2026), a signal that its FX smoothing operations face external scrutiny. If appreciation accelerates, the CBC cannot lean against it as freely without inviting a currency-manipulation label.
Geopolitics is the slower-moving risk. Reuters reported on 2 September 2026 that Taiwan plans for its 2027 defence budget to exceed T$1 trillion for the first time. Rising defence spending is a proxy for cross-Strait tension, and heightened tension can dampen foreign risk appetite for Taiwanese assets independent of AI fundamentals.
Then there is concentration. The flow story leans heavily on TSMC and a handful of related semiconductor names, which makes the currency’s structural support a single-point vulnerability. A sector-specific shock, whether shifting AI demand or export controls, could dent the flows regardless of the broader macro backdrop.
What the confluence of signals tells a currency-aware investor right now
Pull the three threads together and the Taiwan dollar sits at a genuine inflection point rather than a clear directional call. The triple technical confluence at 31.71, the fading RSI, and the trimmed institutional positioning all describe the same thing: a market pausing to reassess, not one reversing or accelerating.
That makes the current setup a case for defined risk levels rather than conviction bets. The two paths are clean:
Three independent analyst teams converge on a structural ceiling near 32.00 for USD/TWD, with Bank of America revising its year-end target up to 32.0 from 30.8 and Commerzbank placing near-term consolidation in a 31.50-32.00 band, a range consistent with CBC intervention acting as the binding constraint on appreciation.
- Bullish case: AI-driven equity inflows resume and 31.71 holds. The path opens toward the 31.83-31.86 resistance band. Confirm it with sustained net foreign buying in the TWSE daily flow data.
- Bearish case: Global risk-off returns or the CBC faces FX policy pressure, and the 31.71 floor gives way. The currency could retrace toward the July 2026 level near 32.27. Watch for the RSI continuing lower and outflows building.
The medium-term policy variable The most important forward catalyst beyond spot flows is the CBC’s rate path. Commerzbank’s Charlie Lay and Henry Hao flag a possible first hike in Q1 2027, which would meaningfully shift the currency’s fundamental backdrop if it arrives.
For a reader with live exposure to Taiwanese equities or Asian currency positions, 31.71 is the line that separates a consolidation story from a retracement story. Know which side of it you are positioned on, and watch three things: TWSE daily foreign flow data, CBC communications around FX smoothing, and whether the RSI recovers or keeps falling.
This article is for informational purposes only and should not be considered financial advice. Investors should conduct their own research and consult with financial professionals before making investment decisions. Past performance does not guarantee future results. Financial projections are subject to market conditions and various risk factors, and forward-looking statements are speculative and subject to change based on market developments.