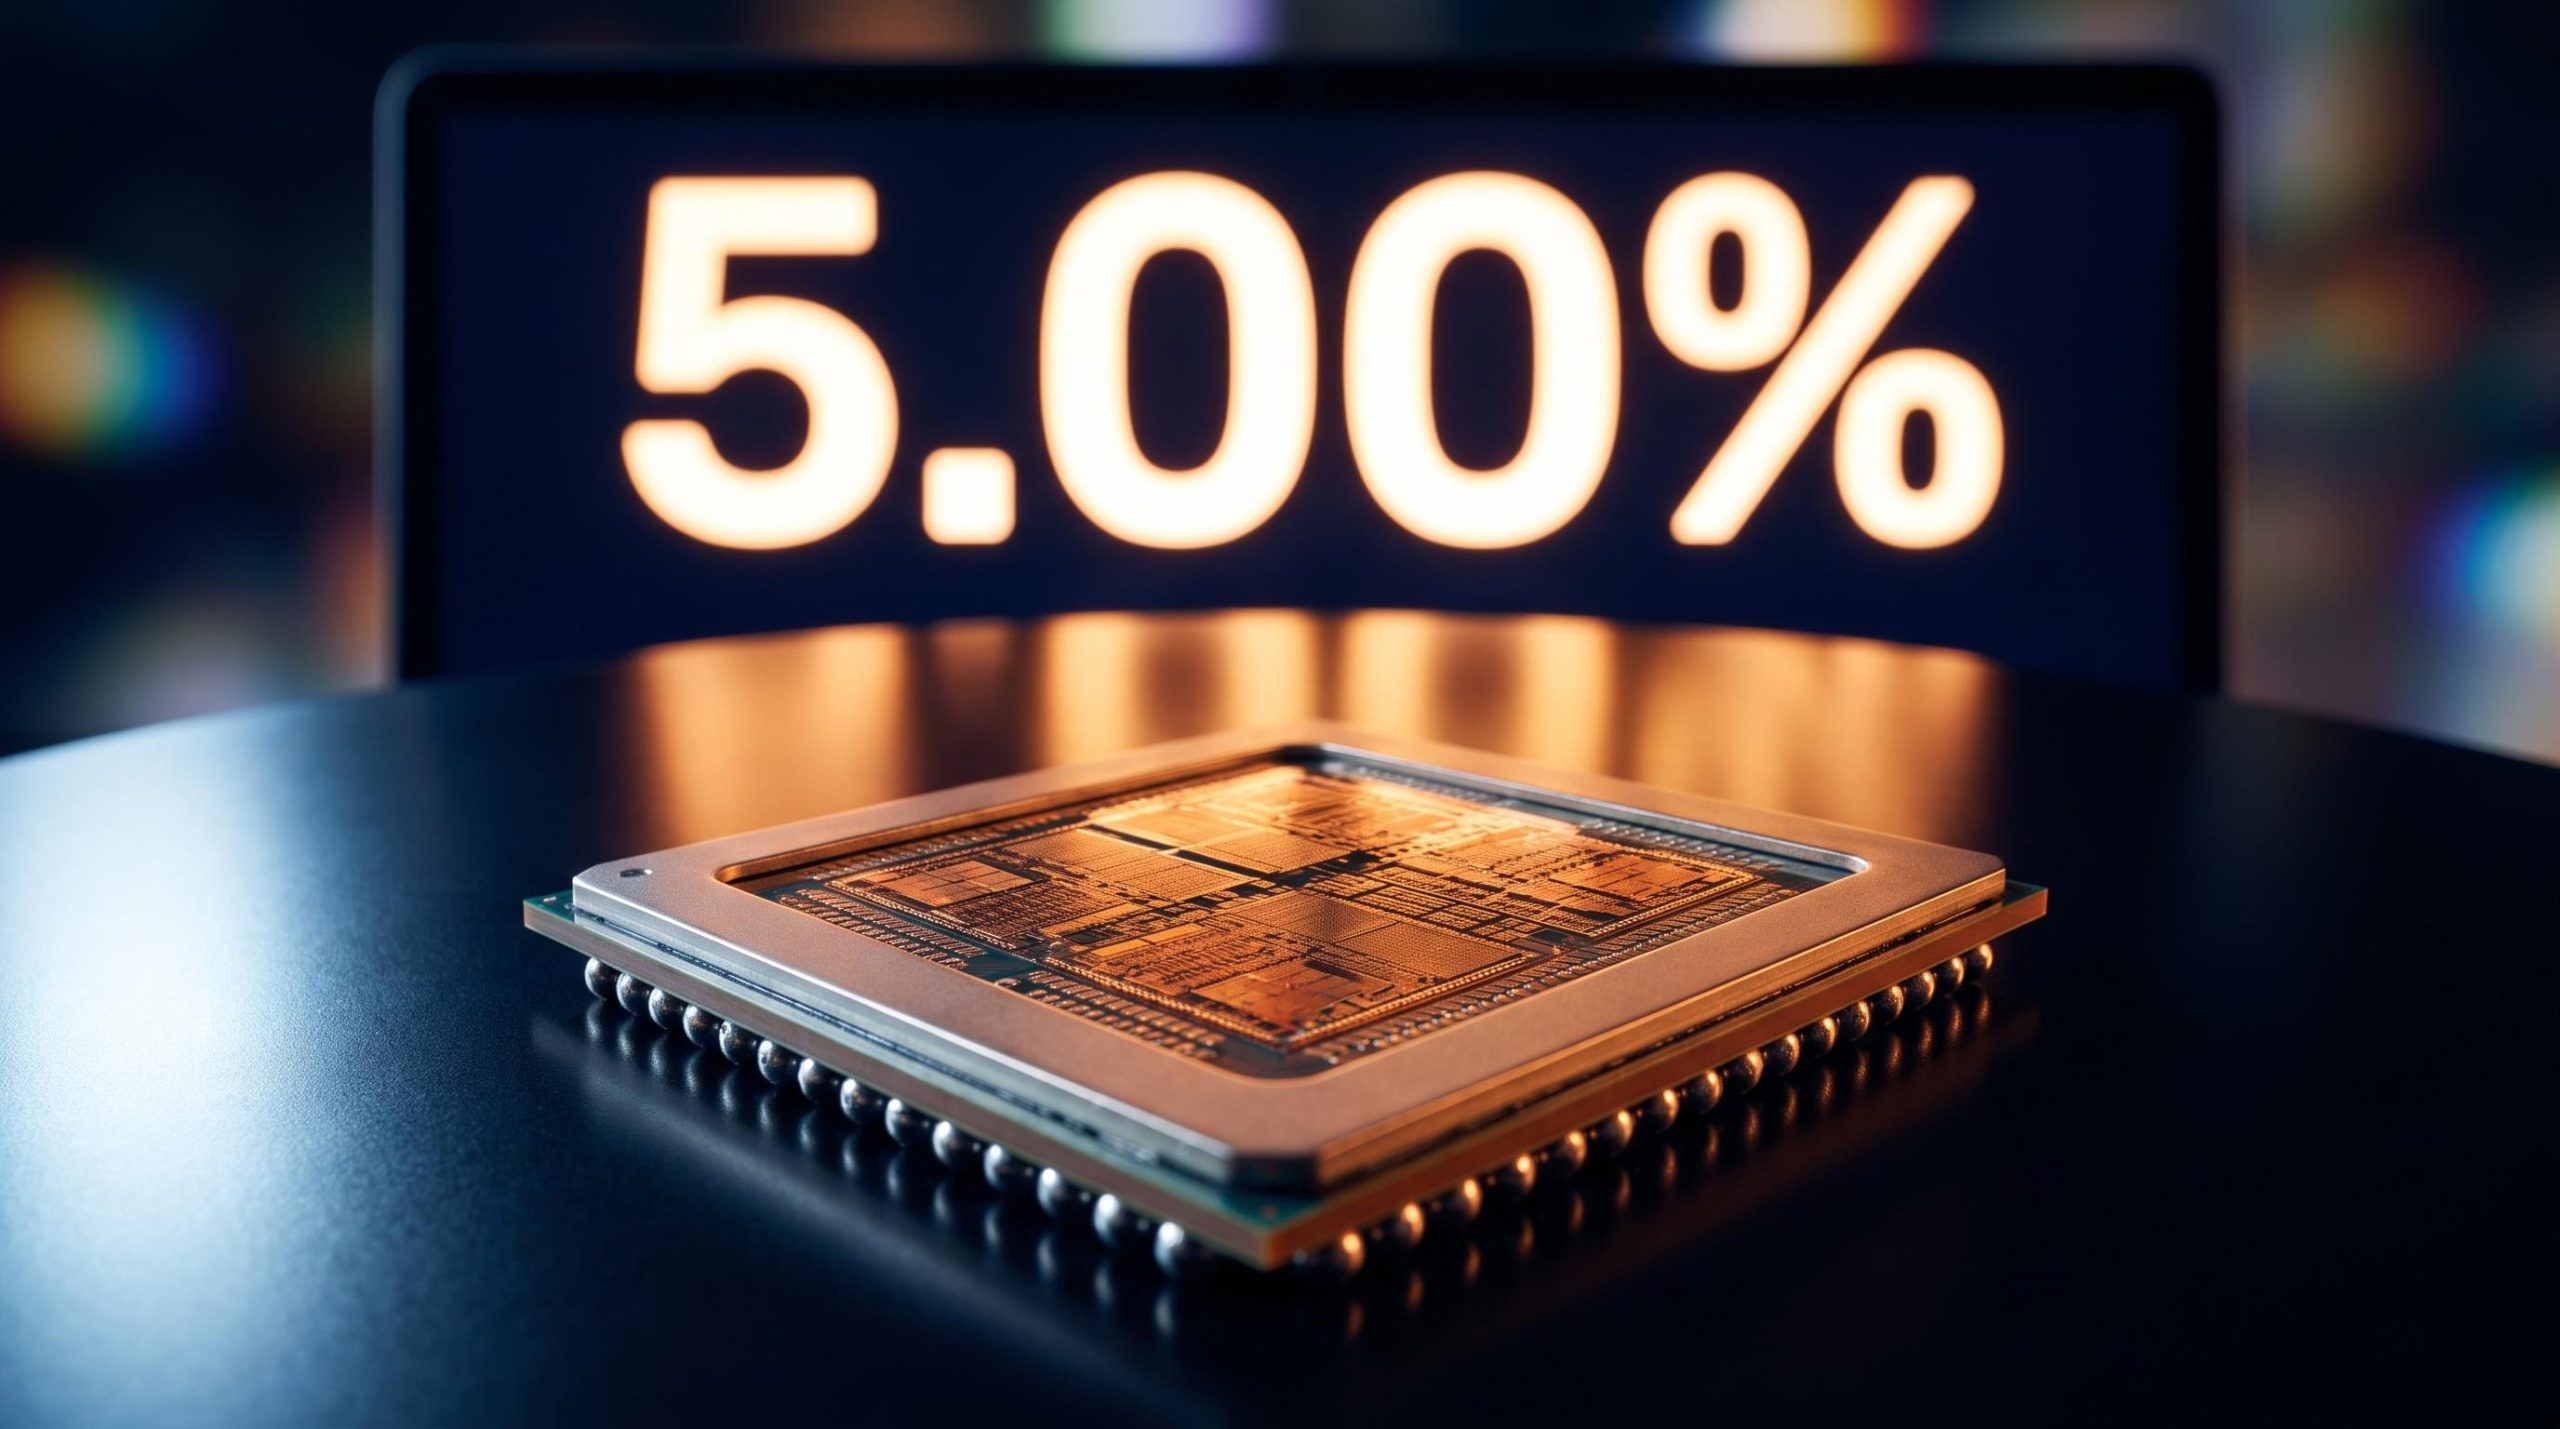
The 10-year Treasury yield touched 5.00% this month, its highest since 2023. That single number now sits at the centre of every serious question about artificial intelligence investing, because the companies building the most consequential technology of the decade are increasingly being valued the way the market values a 30-year bond.
Here is the shift most portfolios have not adjusted for. The AI infrastructure buildout has grown so capital-hungry, its assets so long-lived, and its payoff timelines so distant, that the cost of borrowing has quietly become the variable that matters most. Broadcom alone booked $16.7 billion in AI semiconductor revenue in a single quarter and is guiding toward roughly $58 billion for its fiscal year, a scale that makes the financing question impossible to wave away.
After reading this, you will have a working framework for the AI cost of capital: whether your AI holdings are priced for a world that no longer exists, one of near-zero rates, or the one you actually invest in today, where the risk-free rate sits at 5%. That distinction changes how you allocate.
Why AI infrastructure is now a long-duration asset problem
Start with the mechanics, because the conclusion follows from them naturally. Every stock is worth the sum of its future cash flows, converted back into today’s dollars using a discount rate. The higher that discount rate, the less those future dollars are worth right now. And the further out the cash flows sit, the harder the discounting bites.
AI infrastructure is built almost entirely from cash flows that arrive later, sometimes much later. Spend enormous sums now, wait years for the revenue, and repay the capital over an even longer horizon. That is the exact profile the discount rate punishes hardest.
Put a number on it and the pressure becomes concrete.
Institutional valuation models estimate that a 100-basis-point increase in the discount rate reduces the present value of distant cash flows by roughly 9%.
A 1% move in rates, in other words, quietly erases nearly a tenth of what those far-off earnings are worth today. The 10-year Treasury reaching 5.00% to 5.01% intraday in mid-September 2026, the highest since 2023, is not merely a headline. It tells you the risk-free rate now competes directly with the return you would demand from a long-duration AI investment, which means the valuation premium those assets carried in a near-zero-rate world has to be justified all over again.
The 10-year Treasury reaching 5.00% does not affect every asset class equally; rate-sensitive assets including long-duration bonds, utilities, and dividend equity funds each face a distinct transmission mechanism as the risk-free rate competes more aggressively with their yield profiles.
The Federal Open Market Committee has held its target range at 3.50% to 3.75% since the start of 2026, confirmed most recently in late July 2026. Long-term yields, driven partly by heavy corporate debt issuance to fund AI projects, have climbed well past that.
The Federal Reserve Board’s record of FOMC open market operations confirms the target federal funds rate history that underpins the rate-sensitivity argument here, showing how the committee’s successive decisions have kept short-term policy rates elevated well into 2026.
Three structural features make AI capex uniquely exposed to this dynamic:
- Extreme upfront cost. Custom accelerators and networking chips carry immense engineering and packaging commitments before a single dollar of revenue arrives.
- Long asset lives. Data centres, servers, cooling, and grid infrastructure are financed over multi-year horizons.
- Uncertain monetisation timing. The demand has to prove durable enough to justify the outlay, and that proof takes years.
The analytical shift is this: evaluate AI names not just on how fast revenue grows, but on whether the timeline is short enough to survive a 5% discount rate. That is the difference between an informed AI investor and one still running a 2021 mental model.
Physical bottlenecks compound the financing pressure
The cost-of-capital problem is not purely financial. Physical constraints stretch the gap between spending the money and recognising the revenue, which makes the discounting penalty worse.
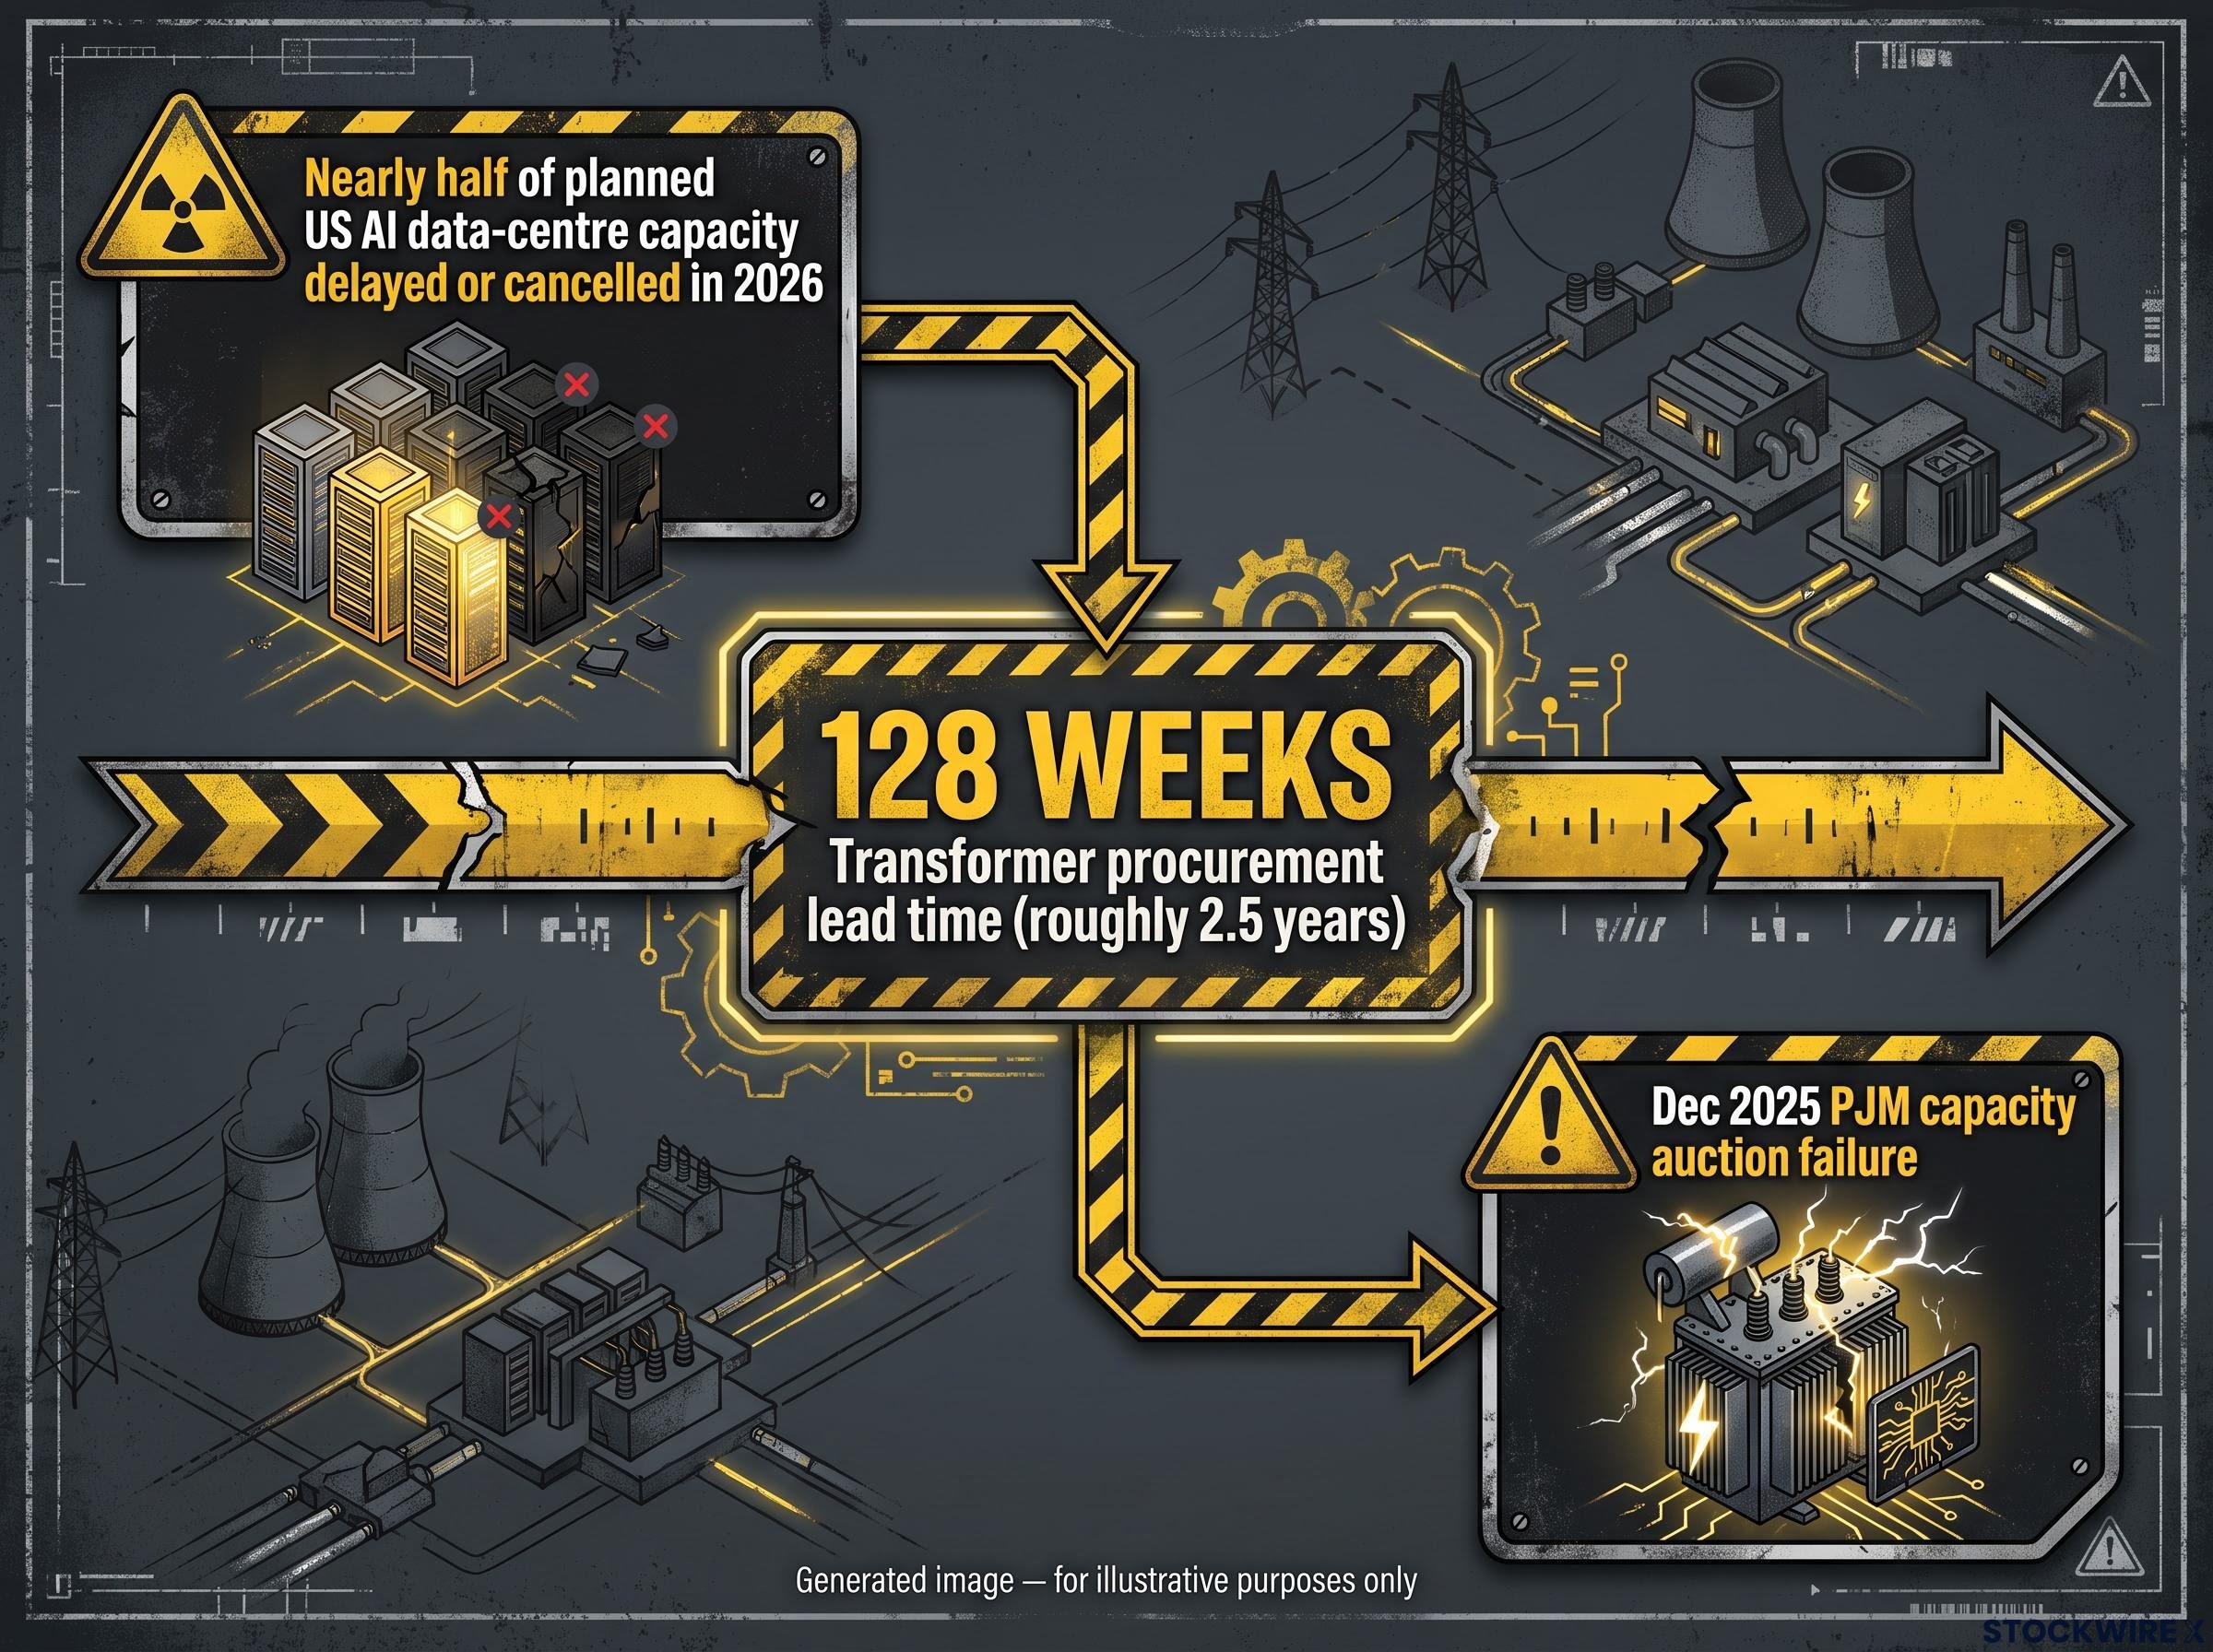
Consider transformer procurement, where lead times now run to 128 weeks, roughly two and a half years, before power equipment even arrives. Nearly half of planned US AI data-centre capacity has been delayed or cancelled in 2026 because of bottlenecks exactly like this.
The failure of the December 2025 PJM capacity auction is a named example of grid constraints turning from a future worry into a present obstacle. Every month of delay pushes the payoff further out, and every month further out costs more at today’s rates.
When big ASX news breaks, our subscribers know first
Broadcom’s numbers make the scale impossible to ignore
Numbers make the abstraction real, so watch Broadcom’s climb one figure at a time. In its fiscal third quarter of 2026, the company reported $16.7 billion in AI semiconductor revenue, up 221% year-over-year and 54% sequentially.
The fourth-quarter guidance lifts higher still: roughly $21.7 billion, implying around 236% annual growth. Stack the year together and management upgraded its full-year fiscal 2026 outlook to approximately $58 billion, about 186% above fiscal 2025.
Then the roadmap arrives. Management has outlined anticipated AI semiconductor revenue of roughly $115 billion for fiscal 2027 and around $230 billion for fiscal 2028.
| Period | AI Revenue | YoY Growth | Status |
|---|---|---|---|
| Q3 FY2026 | $16.7B | 221% | Actual |
| Q4 FY2026 | ~$21.7B | ~236% | Guidance |
| FY2026 full year | ~$58B | ~186% | Guidance |
| FY2027 | ~$115B | Roadmap | Projection |
| FY2028 | ~$230B | Roadmap | Projection |
That $230 billion figure for fiscal 2028 is the tension in a single line. It tells you a meaningful slice of Broadcom’s investment case rests on cash flows arriving two or more years out, precisely the horizon where a sustained 5% risk-free rate applies its heaviest penalty.
Broadcom’s valuation premium, a forward P/E of approximately 37x reflecting contract-backed revenue certainty from locked-in hyperscaler agreements through at least 2029, sits precisely in the zone where a sustained 5% discount rate applies its heaviest pressure on out-year cash flows.
Broadcom is the picks-and-shovels archetype: it profits from the buildout regardless of which AI application ultimately wins. Its business also runs far wider than accelerators, spanning smartphones, networking, data storage, enterprise software through VMware, cybersecurity, and industrial applications.
According to company management, more than 99% of all global internet traffic touches Broadcom technology in some form.
That diversification is what makes Broadcom a more accessible AI infrastructure holding than a pure-play chip name. It softens the ride, but it does not switch off the rate sensitivity, because the growth premium still lives in those distant fiscal 2027 and 2028 numbers.
There is a second-order effect worth noting. Companies chasing this scale are issuing debt to fund it, and that debt supply is itself part of what keeps yields elevated. The buildout, in a sense, helps sustain the very rate environment that discounts it.
What history says about capital cycles and rate cycles colliding
Two past buildouts frame the current one, and they point in opposite directions. Neither settles the argument, which is exactly why both are worth holding in mind.
The first is the late-1990s telecom build-out, the cautionary tale. Telecom firms spent more than $500 billion cumulatively between 1996 and 2000, with peak annual capex near $120 billion, roughly $213 billion in today’s dollars, equal to 1.0% to 1.2% of US GDP. Capital intensity ran to about 44 cents of capex per dollar of revenue around 2000, and the result was a glut of unused “dark fiber” that took close to a decade to absorb.
The second is the 2015-2018 cloud build-out, the counter-example. The Federal Reserve raised rates from 0.25% to 2.50% across that stretch, yet chip stocks and cloud-linked names still beat the S&P 500 by roughly 30 to 110 percentage points in some tightening phases. When a genuine secular buildout is underway, the capex cycle can override the rate cycle, provided demand is durable and the spending converts into real cash flow.
| Cycle | Peak Capex Scale | Rate Environment | Outcome |
|---|---|---|---|
| Telecom (1996-2000) | ~$120B/yr peak; $500B cumulative | Pre-dot-com | Dark fiber glut; decade to absorb |
| Cloud (2015-2018) | Rising through cycle | Fed 0.25% to 2.50% | Beat S&P by 30-110 pts |
| Current AI | Broadcom alone ~$58B FY26 | 10-yr near 5.00% | Unresolved |
So which is it? The honest answer is that the current AI cycle has not yet declared itself. The distinguishing variable between the two precedents comes down to two things:
- Near-term cash-flow conversion. Did the capex turn into durable revenue quickly, as in the cloud cycle, or did it produce assets that sat idle for years, as in telecom?
- Leverage levels. How much of the buildout was funded with debt that then demanded refinancing at higher rates?
That gives you a testable criterion rather than a slogan. “AI always wins through rate cycles” and “AI is the next dot-com” are both premature. What you actually want to watch is how fast today’s spending converts into cash, and how much of it is debt-financed.
Technology investment cycles from railways to fibre optics show that the infrastructure survivors frequently matter more than the original investors who funded the buildout, a pattern that reframes the telecom-versus-cloud comparison and raises the question of which AI names occupy the structurally durable position.
How to think about positioning when the cost of capital is the variable
Move from analysis to action. If the cost of capital is the swing variable, the dominant institutional response is a barbell: pair long-duration AI growth exposure on one end with near-term, cash-generating holdings on the other, typically high-quality dividend equities.
The Schwab U.S. Dividend Equity ETF (SCHD) is the commonly cited alternative sleeve. It has delivered strong recent performance, with a year-to-date total return placing it between 24.6% and 29.3% through late summer and early autumn 2026, depending on the tracker. Its yield currently sits around 3.0% to 3.1% (a 30-day SEC yield of 3.25% as of 17 September 2026, and a trailing 12-month distribution yield near 3.00% as of 31 August 2026).
The appeal is that a fund like this holds strong-balance-sheet companies with lower earnings volatility, offsetting some of the concentration risk in a long-duration AI position. But the diversification is not as clean as it looks, and two caveats matter:
- Dividend ETFs are not rate-immune. When Treasuries yield near 5%, institutional capital tends to rotate out of dividend equity funds that still carry full equity risk for a lower effective yield.
- Hidden tech exposure. Many dividend funds hold their own technology names, so they may not fully hedge a broad, AI-led equity sell-off.
Set the yields side by side and the trade-off is stark.
A dividend ETF yielding roughly 3.0% to 3.1% against a 10-year Treasury near 5.00% to 5.01% means you are accepting equity risk for a yield below the risk-free rate.
That gap does not justify itself unless you hold a view that rates will fall. Resolving that view is the core decision the barbell asks of you.
Before the next FOMC meeting, with the target range at 3.50% to 3.75%, put three questions to your own portfolio:
- What is the cash-flow duration of my AI holdings, and how much of their value sits beyond 2027?
- What yield gap am I accepting by holding dividend ETFs rather than Treasuries?
- Does my dividend fund carry tech exposure that correlates with my AI sleeve, quietly undoing the hedge?
For investors wanting to apply the cost-of-capital framework across different parts of the AI value chain, our dedicated guide to AI portfolio layers maps the six distinct segments from semiconductors to software, each carrying a different duration profile and sensitivity to the current rate environment.
This article is for informational purposes only and should not be considered financial advice. Investors should conduct their own research and consult with financial professionals before making investment decisions. Past performance does not guarantee future results, and financial projections are subject to market conditions and various risk factors.
The question every AI investor now has to answer
Two forces are pulling against each other in every AI position you hold. On one side, revenue is compounding at a pace few sectors have matched. On the other, a sustained 5% risk-free rate is quietly shrinking the present value of the cash flows that make those valuations work.
The historical frame sharpens the stakes without resolving them. Whether this cycle behaves like the cloud build-out, converting spending into cash quickly, or like the telecom bust, leaving assets to earn their keep over a decade, is still an open question. That very uncertainty is the risk.
Which leaves one variable above all others: the rate trajectory. If rates fall, long-duration AI assets re-rate sharply upward. If they stay elevated, the speed of cash-flow conversion becomes the stress test that decides which names survive.
You do not need a prophecy. You need a position on where rates go next, and a portfolio built to survive being wrong. The barbell is not a recommendation; it is a way to hold the uncertainty rather than bet the whole book on one answer.