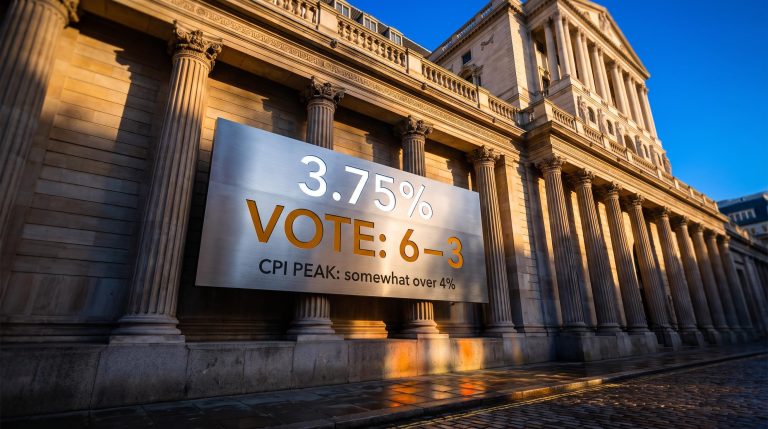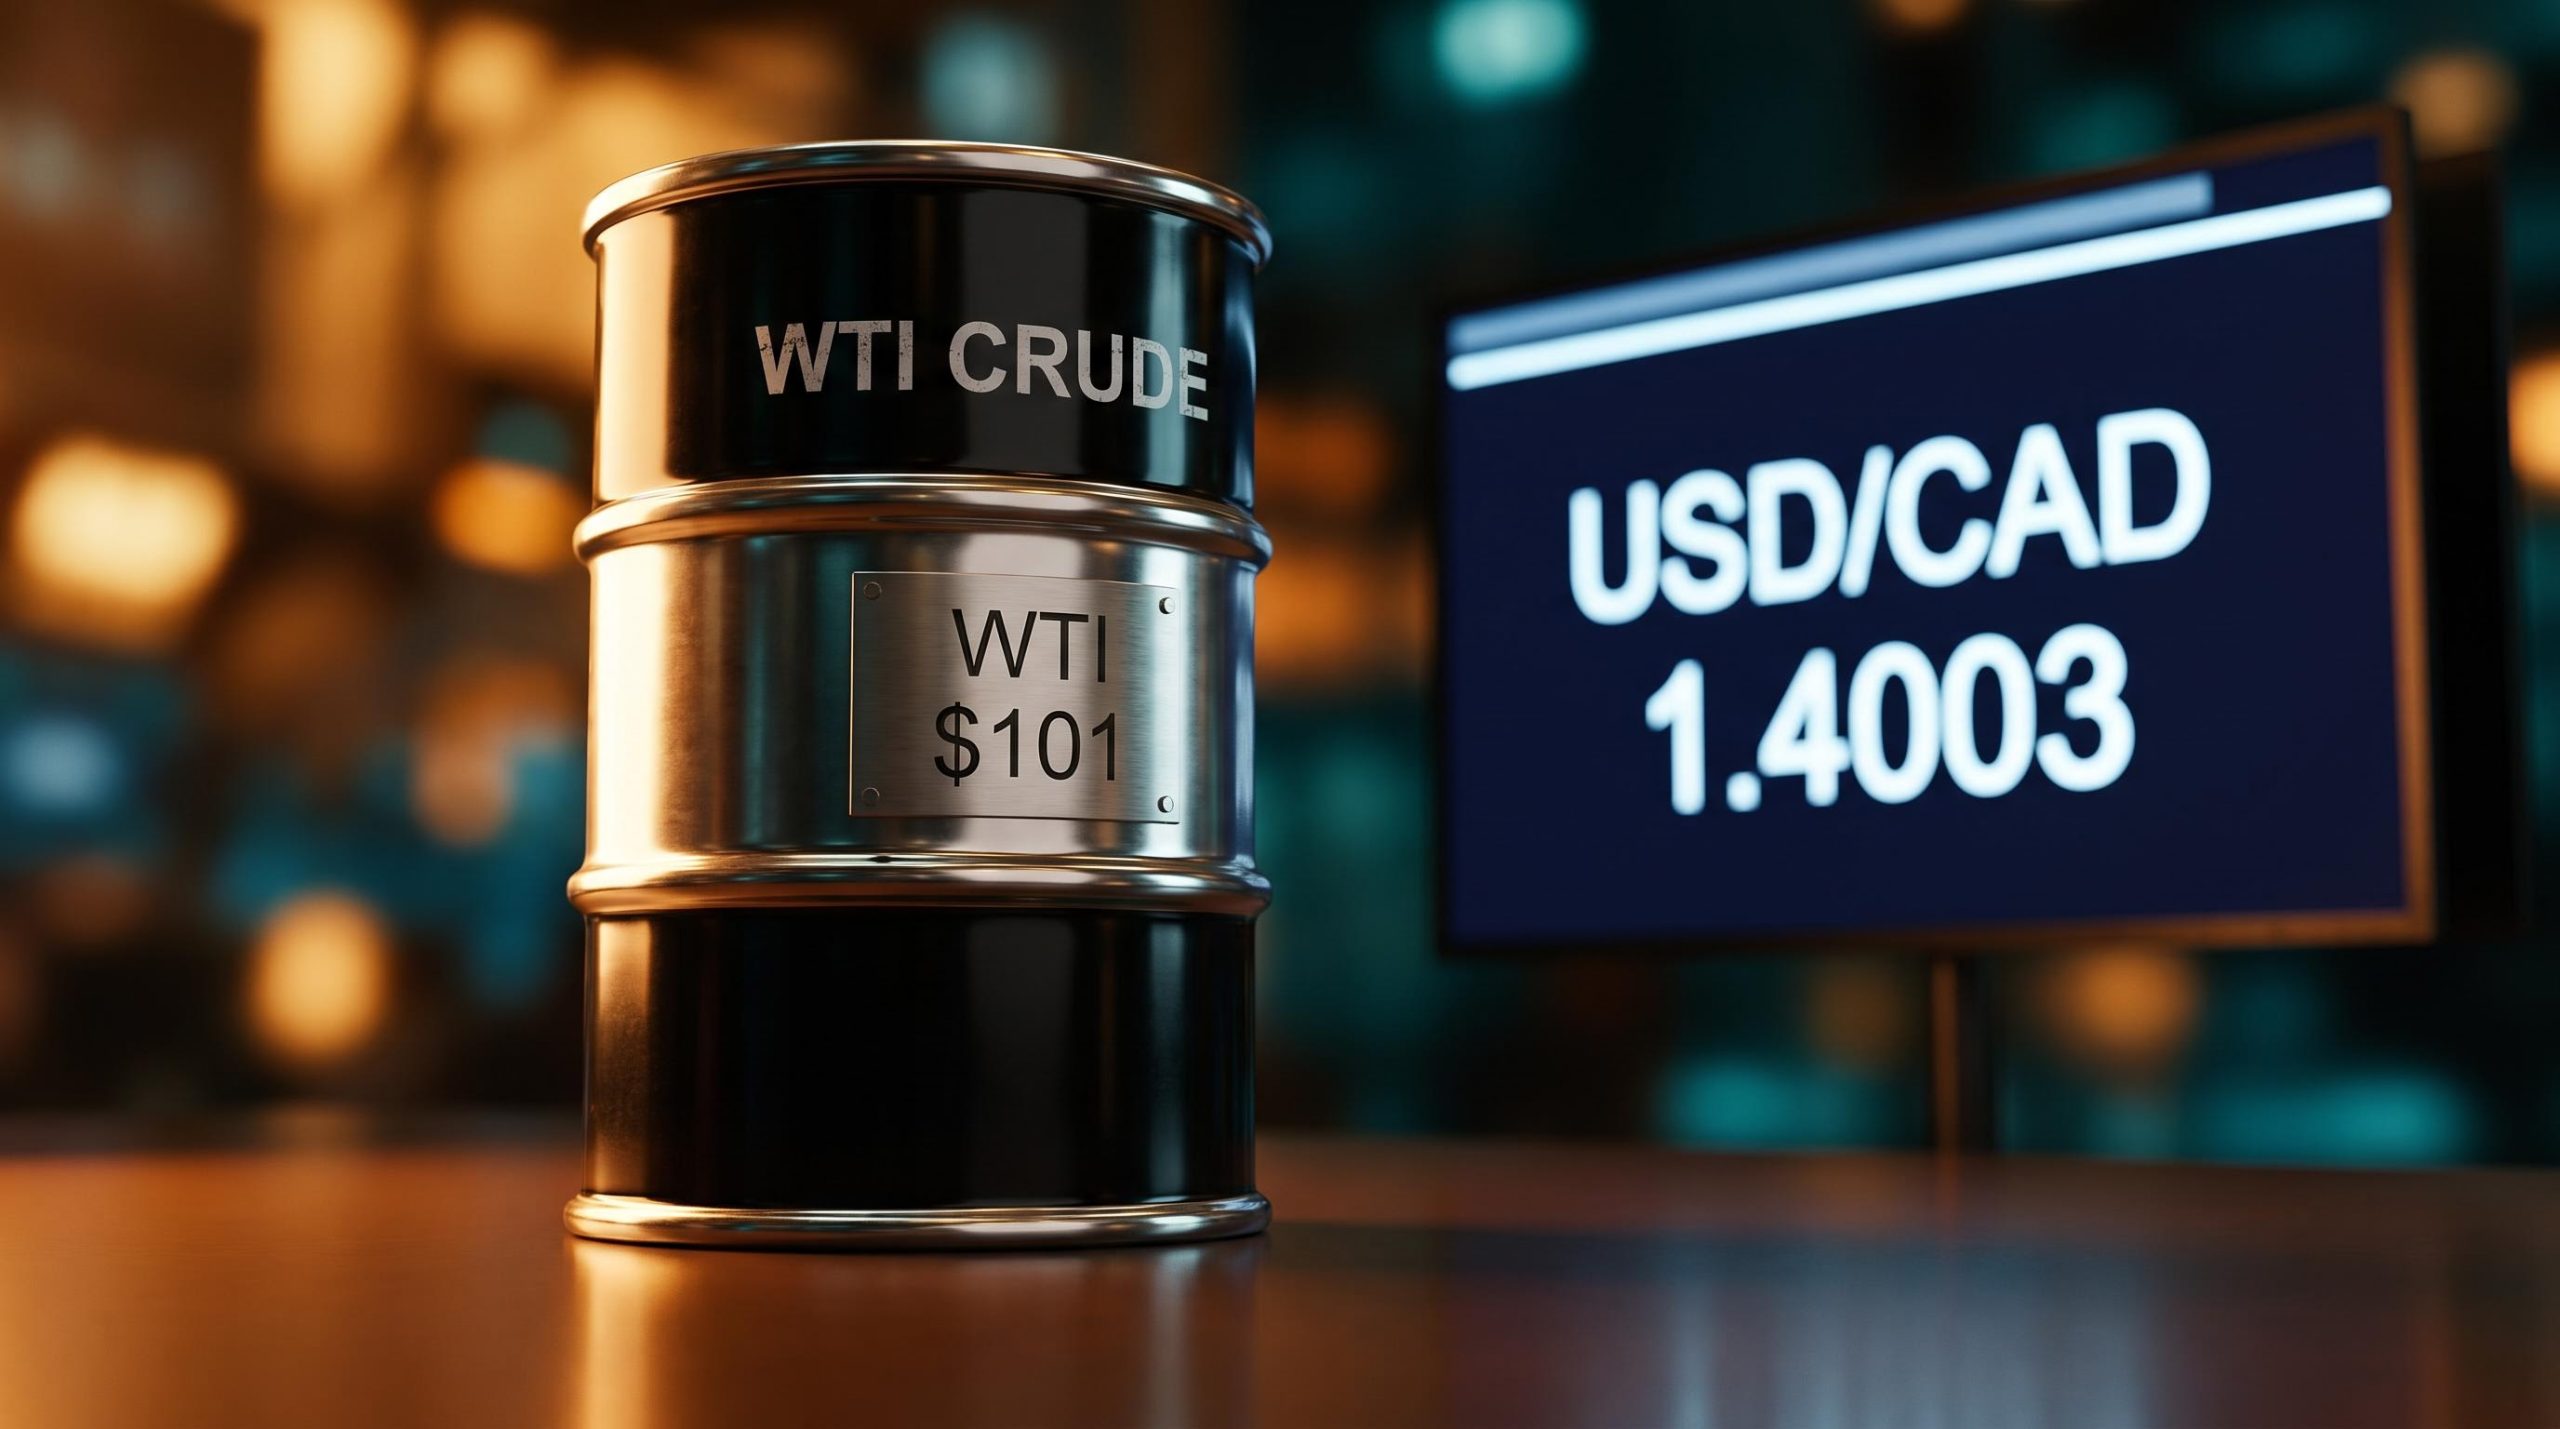
Oil is sitting above US$100 a barrel. Canada’s central bank has held interest rates steady for the third meeting in a row. And yet the Canadian Dollar is straining against 1.40, one of the most closely watched round numbers in all of currency trading.
That combination should not sit comfortably together. For decades, a strong oil price meant a strong loonie, and a central bank on hold meant a stable currency. Something structural has shifted in how this pair moves.
The USD CAD forecast matters right now because 1.40 is not a routine level. It carries real psychological and institutional weight, a threshold where retail traders and big institutional desks tend to converge, liquidity thins out, and the next directional move gets amplified.
What follows maps the forces pulling the pair in both directions, with the institutional forecasts that define the range to watch. You will finish with a clear picture of the scenarios that would push USD/CAD materially above or below 1.40, and which catalysts unlock each one.
Why USD/CAD is hovering near 1.40 right now
The most important thing to understand about the current move is that it is mostly happening to Canada, not because of Canada.
The dominant force pushing USD/CAD toward 1.40 is broad US Dollar strength, not a fresh collapse in the loonie. Subdued global risk sentiment provides the backdrop, with European equity markets trading lower and US equity futures showing only slight gains. When investors turn cautious, the USD tends to firm across the board, and CAD gets carried along for the ride.
Broad USD strength in mid-2026 was catalysed by the June FOMC meeting under new Fed Chair Kevin Warsh, which held rates at 3.50%-3.75% and delivered a hawkish dot plot that repriced cut timelines and pushed the DXY to a 13-month peak of 101.8, the same momentum that has been carrying USD/CAD toward 1.40.
Underneath that momentum sits the structural anchor: the interest rate gap between the two countries.
US front-end government bond yields remain materially above their Canadian equivalents. That gap creates a persistent carry incentive, meaning traders are paid more to hold US Dollars than Canadian Dollars, which keeps steady upward pressure on the pair. RBC Capital Markets and FXEmpire both point to this yield divergence as the single largest cyclical drag on the loonie.
The Federal Reserve’s FOMC press conference transcript from 16 September 2026 confirms the official rate path and economic projections underpinning the US yield advantage, the same yield gap that institutional desks cite as the dominant structural force keeping USD/CAD elevated near 1.40.
Three layers are stacking on top of each other here:
- Broad USD strength driven by cautious global risk sentiment
- The US-Canada rate differential, with US yields well above Canadian yields
- Domestic Canadian headwinds, including sub-trend growth and trade uncertainty
On that third layer, the picture is genuinely soft. RBC’s September 2026 Quarterly Canadian Outlook cites sub-trend real GDP growth of around 1% in 2026, alongside demographic and population pressures. Persistent uncertainty around US-Canada trade disputes and USMCA review risk adds another structural weight, according to StoneX and Rabobank.
US-Canada tariff escalation has introduced a structural drag on CAD that operates independently of oil and rate differentials; the 50% duties on roughly $20 billion of Canadian goods announced in August 2026 triggered the largest single-session CAD drop of any major currency, followed by an equally sharp reversal when a three-day negotiating pause was announced.
Here is the part worth pausing on. Scotiabank’s internal fair value model puts USD/CAD at roughly 1.3910, while spot is trading near 1.40.
Scotiabank fair value estimate Approximately 1.3910, modestly below the current spot rate near 1.40.
That gap tells you the pair is not cheap here. Anyone buying USD/CAD at current levels is paying a premium above what the fundamentals justify, which means a snap back toward fair value stays a credible outcome even before any policy shift.
The practical takeaway is about which catalyst to watch. If this is primarily a USD story, then a shift in US data or sentiment is what moves the needle, not something happening inside Canada.
When big ASX news breaks, our subscribers know first
What the 1.40 level actually means (and why it keeps mattering)
Round numbers in currency markets are not arbitrary. They behave like gravity.
The reason is behavioural. Big institutional desks place orders around clean levels, retail traders cluster their stop-loss orders (automatic exit points that trigger when price hits a set level) just beyond them, and liquidity thins out once price pushes through. That combination turns 1.40 into a genuine structural feature rather than a line someone drew on a chart. DailyForex noted in early September 2026 that institutional exit zones bunch heavily around this level, which is exactly why the market keeps stalling near it.
Scotiabank strategists Shaun Osborne and Eric Theoret have mapped the active technical parameters. Resistance sits at 1.3990, the 50% retracement of the June-to-August USD decline (a retracement level marks how much of a prior move has been reversed). A confirmed, sustained break above 1.40 would open the door to 1.4050, then 1.4125. On the downside, support has been revised up to the 1.3940-1.3950 zone.
Those are the live numbers. The history behind them is where the real lesson sits.
Three times the pair breached 1.40, and what happened next
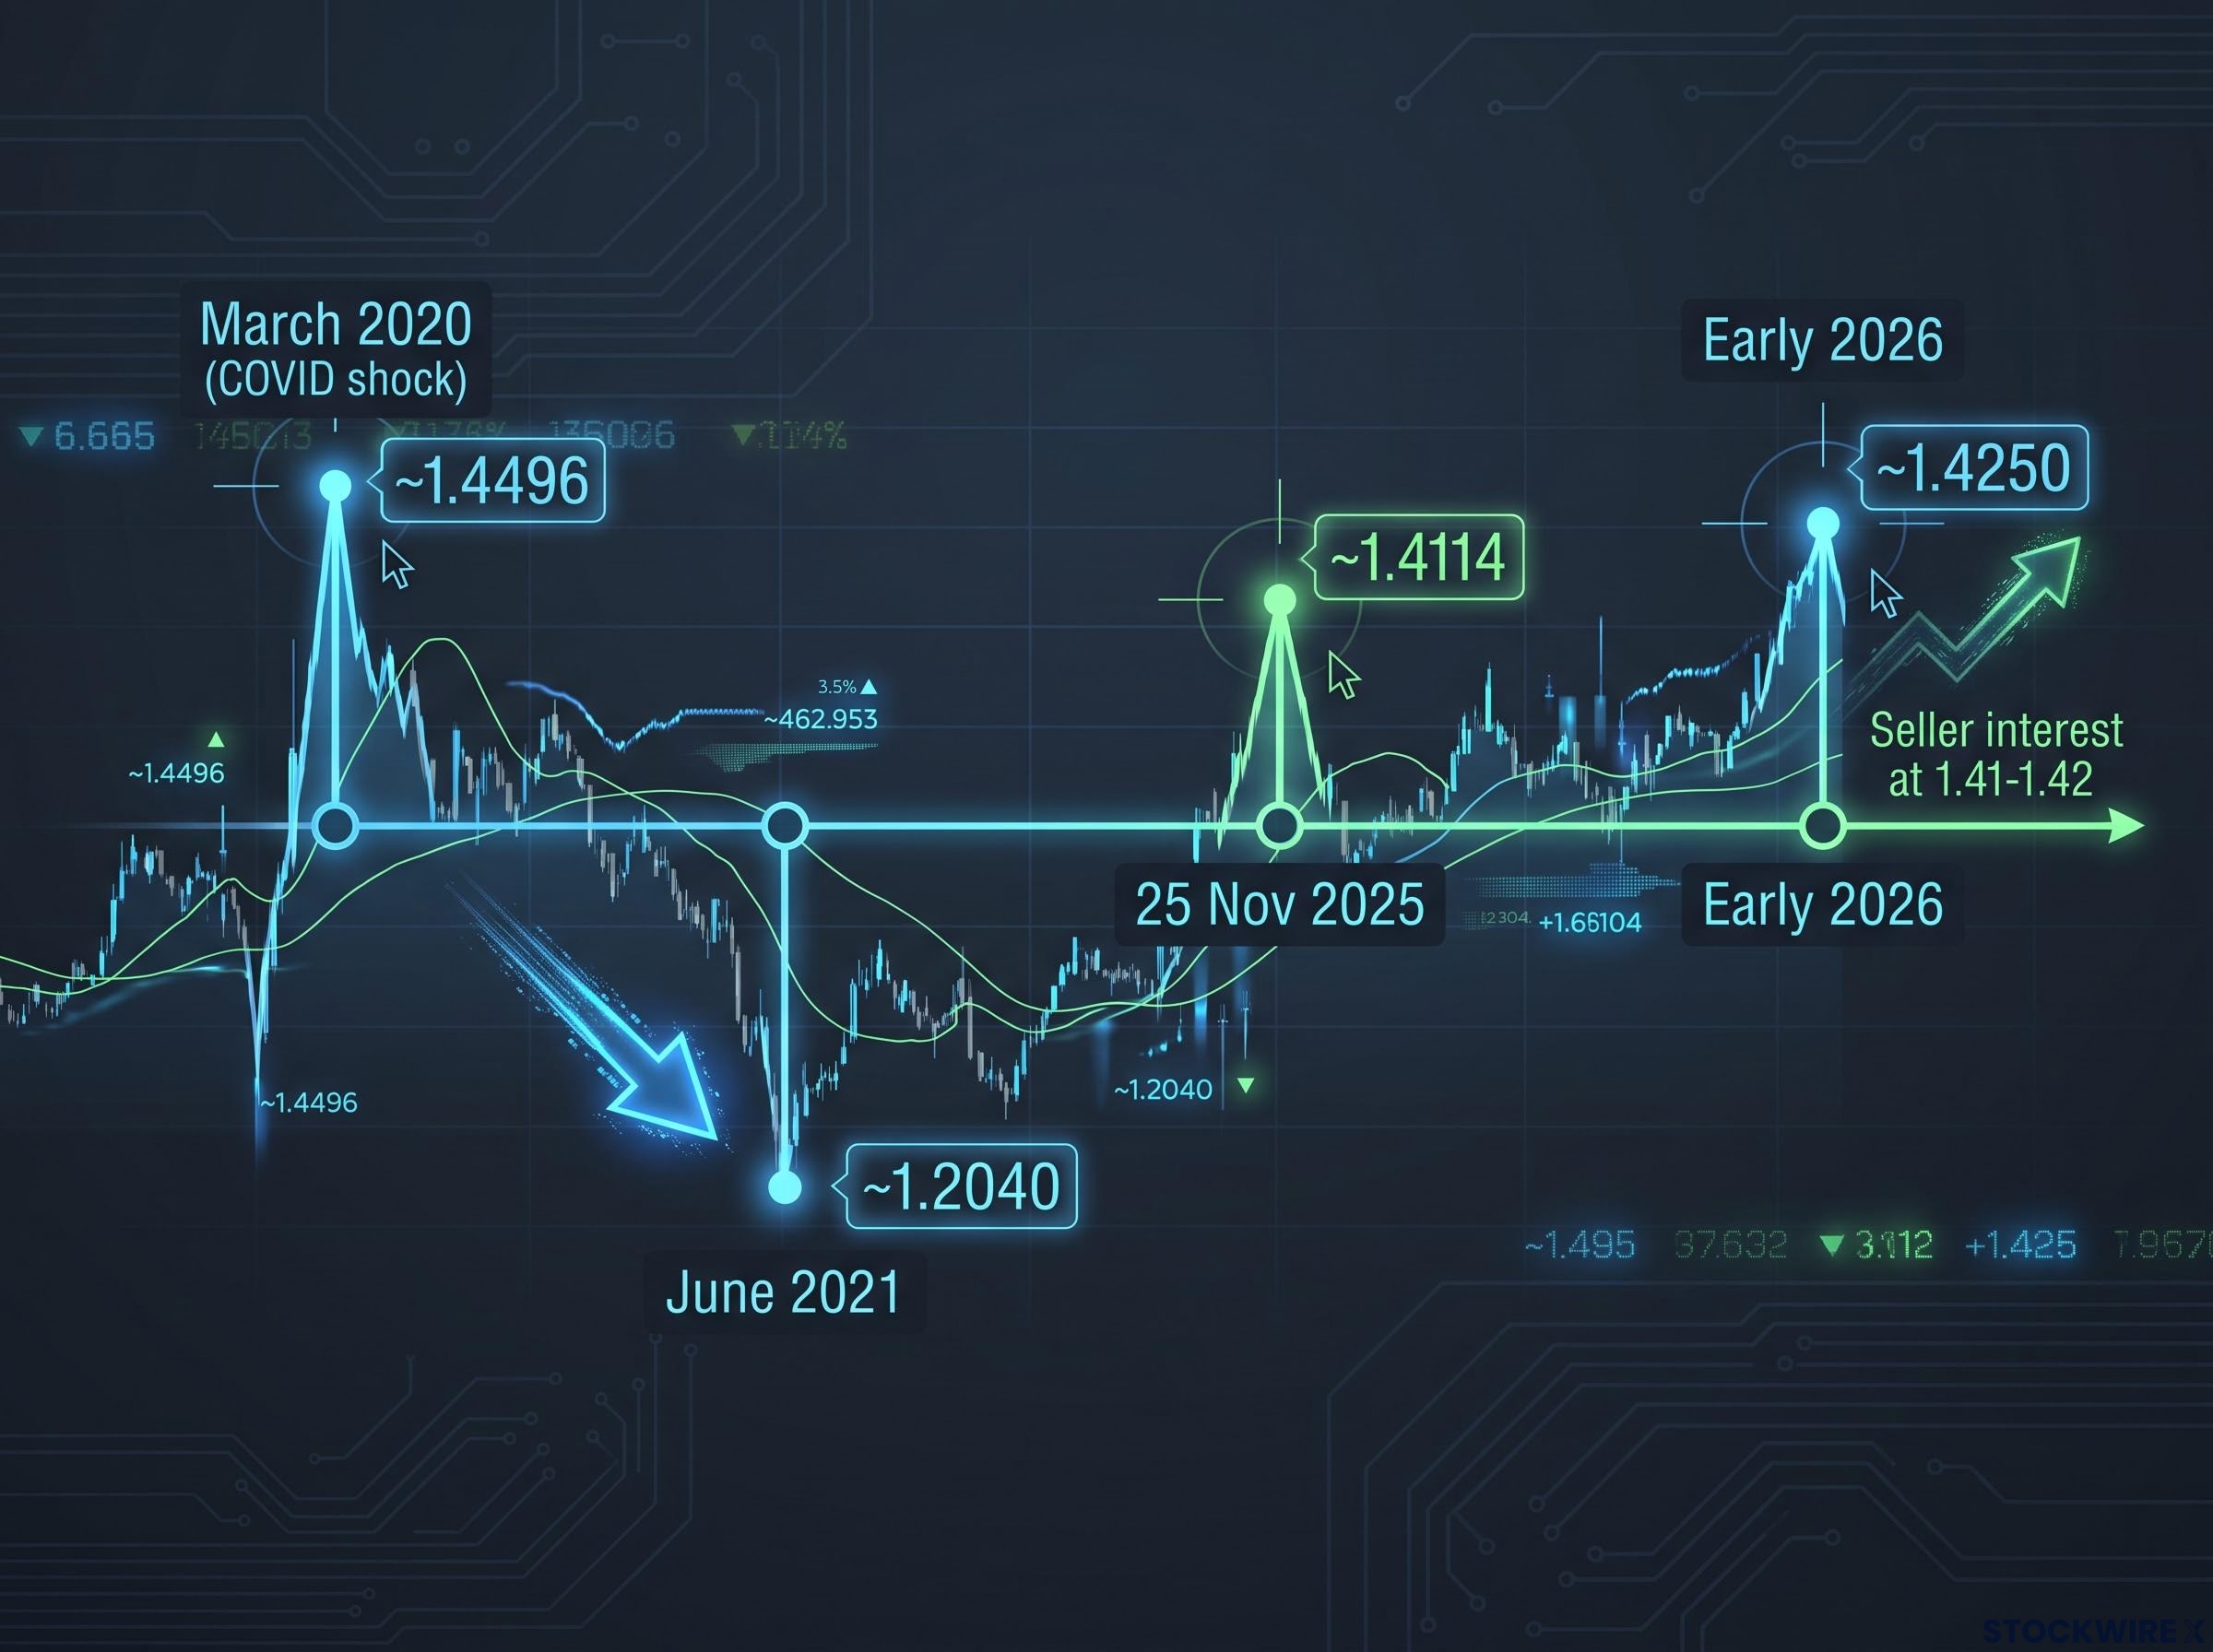
USD/CAD can absolutely push above 1.40. What history shows is that when it does, the move tends to be a sharp overshoot followed by a meaningful reversion lower.
| Episode | Peak level | Duration above 1.40 | Eventual reversion |
|---|---|---|---|
| COVID shock, March 2020 | ~1.4496 | ~15 trading days | ~1.2040 by June 2021 |
| Late 2025 peak | ~1.4114 (25 Nov 2025) | Brief | Pulled back below 1.40 |
| Early 2026 range high | ~1.4250 | Range-bound | Seller interest at 1.41-1.42 |
The COVID episode is the clearest example. The pair closed near 1.4496 on 18 March 2020, held above 1.40 for roughly 15 trading days, then reverted all the way to about 1.2040 by June 2021, according to 49th Parallel Wealth Management.
The pattern repeated in miniature more recently. Wise reported a late-2025 peak of 1.4114 on 25 November 2025, and WSJ FX data logged a 52-week range high of 1.4250 in early 2026. RBC’s August 2026 George Davis Report flagged notable institutional seller interest clustered between 1.41 and 1.42.
That seller zone gives you something concrete to watch. If the pair does break higher, the more useful question is not whether it reaches 1.41, but what eventually pulls it back, because so far, something always has.
The oil-CAD connection is weaker than most readers think
Here is the assumption almost everyone starts with: Canada is a petro-currency, so when oil goes up, the loonie goes up. For years, that was true and tradeable. Canada is one of the world’s major oil exporters, and the link between crude prices and CAD was strong enough to build strategies around.
That relationship has broken down, and the data on it is hard to argue with.
The CAD-oil decoupling is not a recent anomaly but a structural shift rooted in tariff-driven stagflation, with US duties of 50% on roughly $20 billion of Canadian goods eroding the trade-balance benefit that high crude prices would ordinarily deliver to the loonie.
WTI crude settled near US$101.32 per barrel on 18 September 2026, comfortably above US$100. Under the old model, that should be supporting the loonie. It is not.
The correlation numbers tell the story:
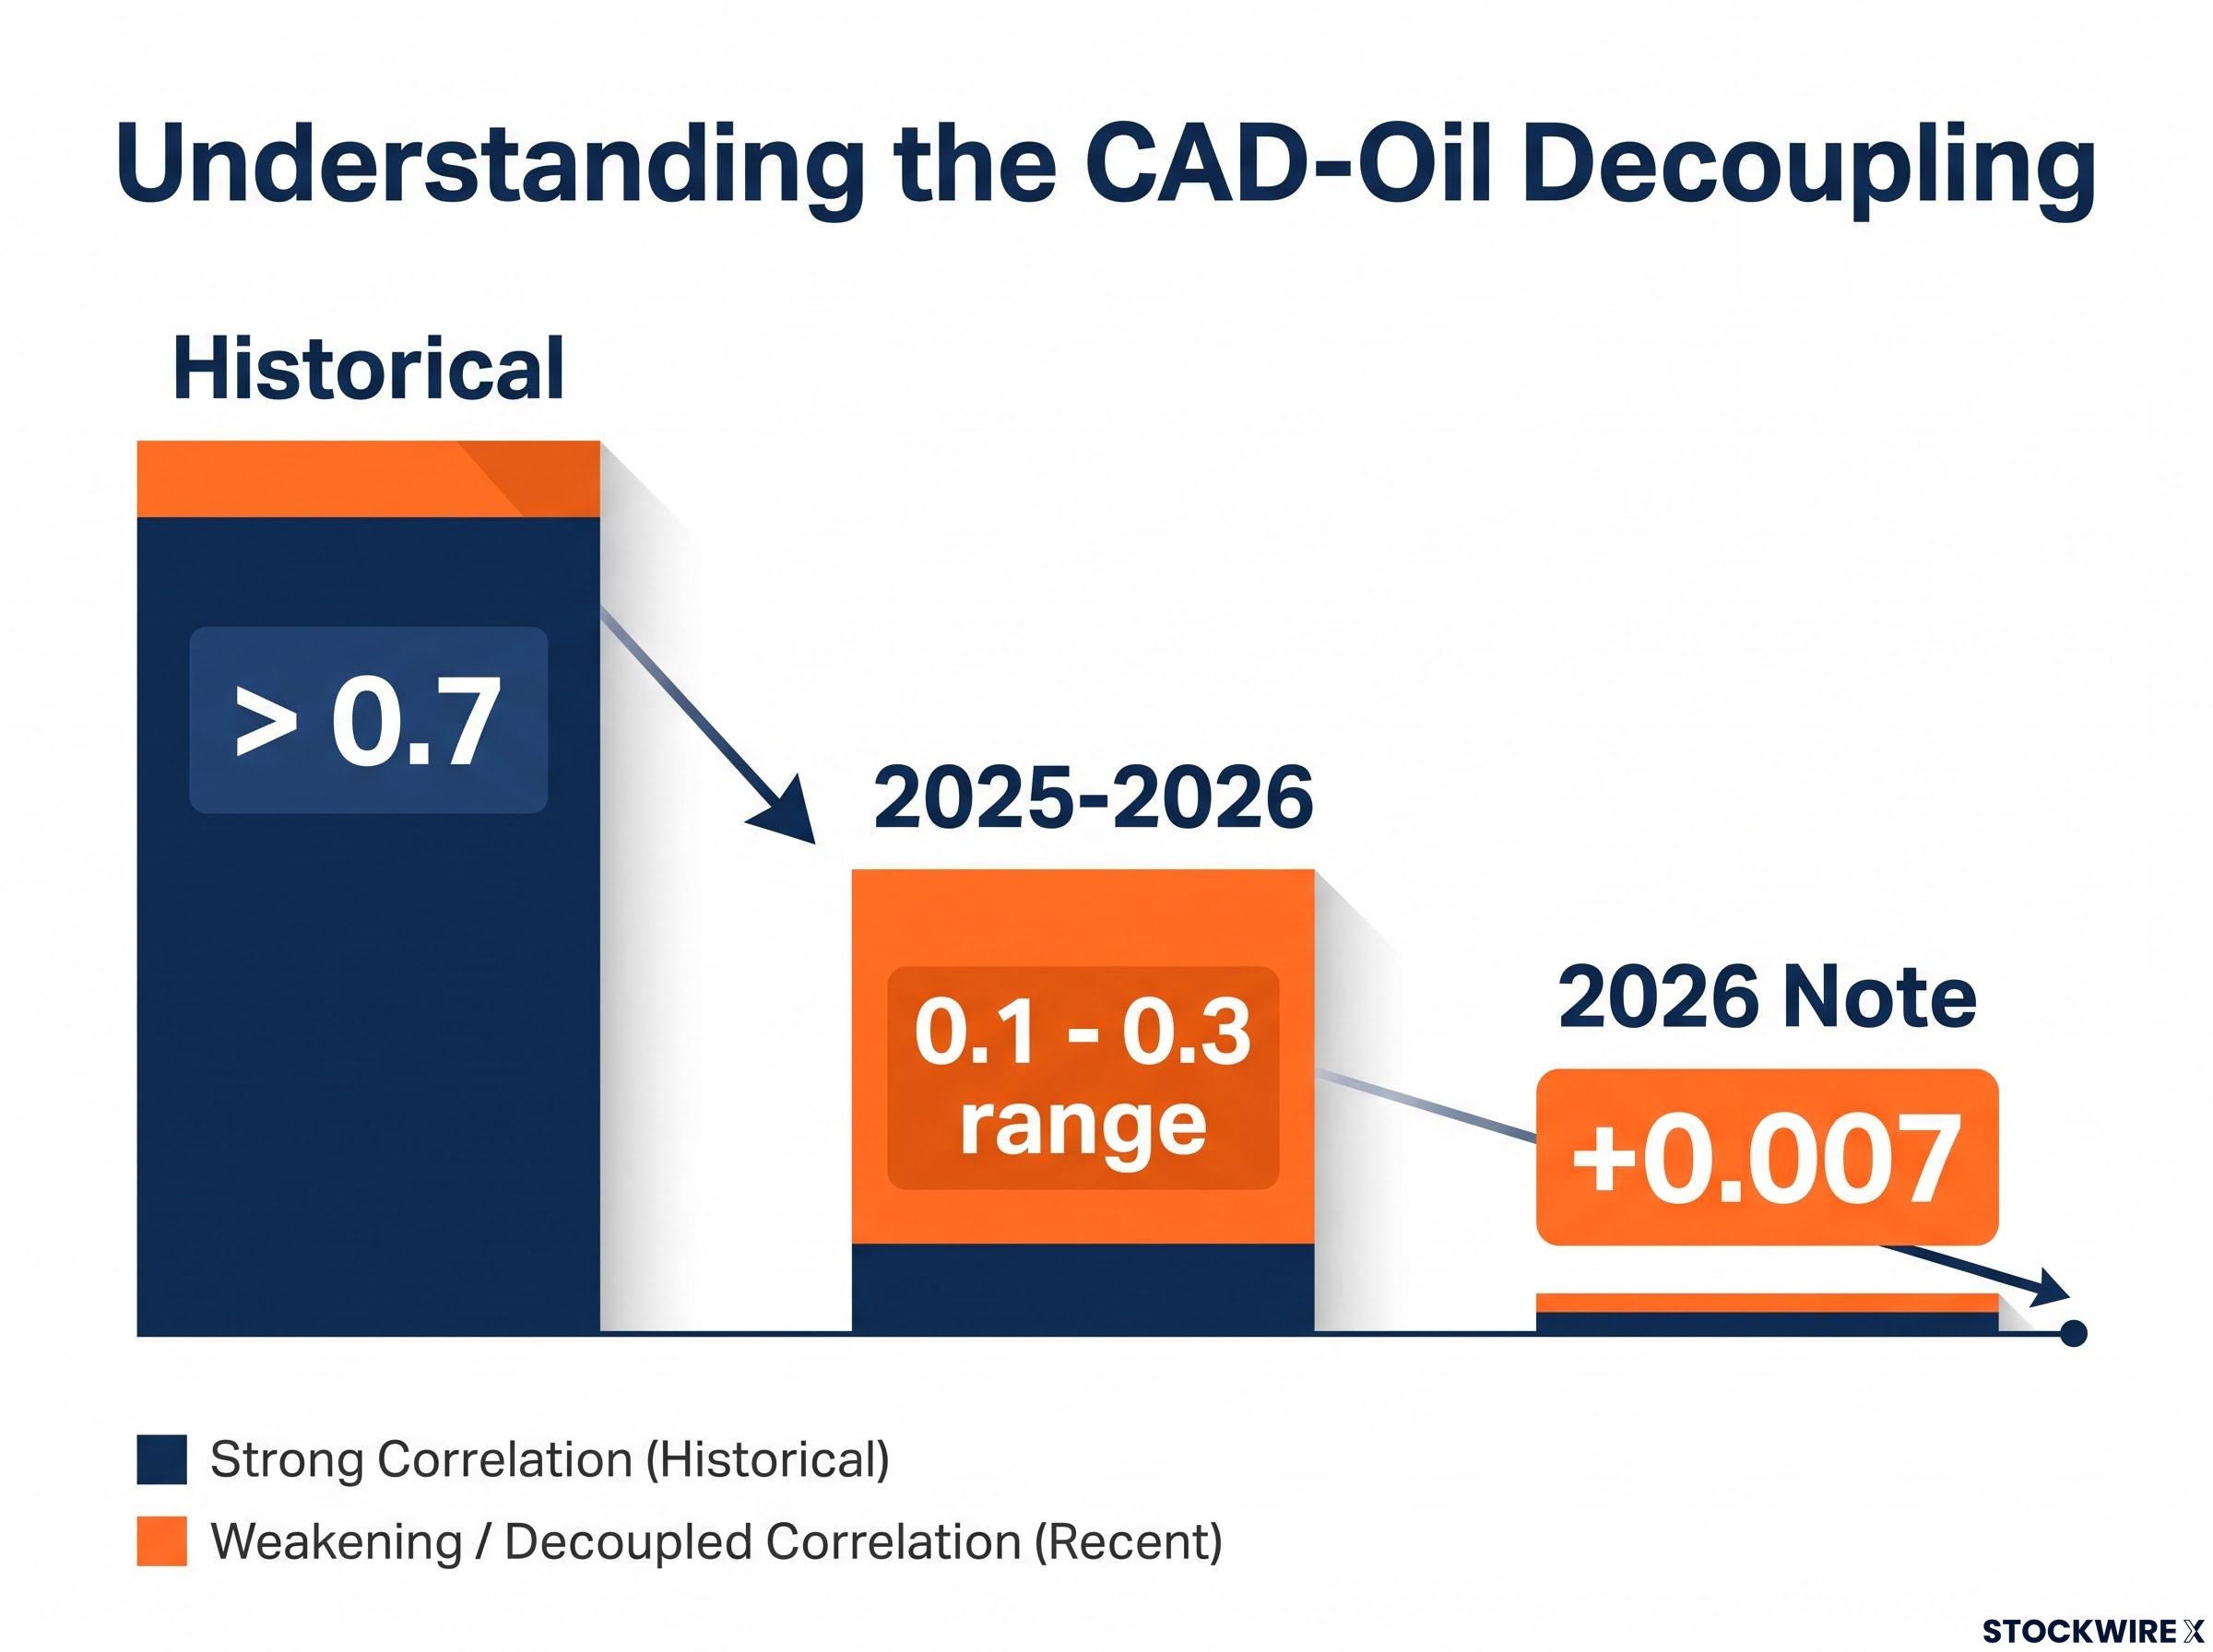
- Historical oil-CAD correlation once exceeded 0.7
- In 2025-2026, it collapsed into the 0.1-0.3 range, per MEXC News and USDCADcurrency.com
- One 2026 research note found a one-year correlation coefficient of just +0.007, effectively zero
A correlation of 0.7 means two things move closely together. A reading near zero means they have essentially stopped moving together at all.
The mechanism behind the breakdown is instructive. A Scotiabank Economics study from April 2026, titled “Understanding the CAD-Oil Decoupling”, found that CAD’s response to geopolitical oil spikes has been largely muted. Once you control for the source of the oil shock, whether it is driven by supply or by demand, interest rate differentials and broad USD strength fully account for CAD’s behaviour. Oil’s independent contribution becomes statistically insignificant.
The most striking single finding pushes even further.
Alberta Central, May 2026 The one-year correlation between weekly WTI changes and USD/CAD turned slightly positive, meaning higher oil actually coincided with a weaker Canadian Dollar. The traditional relationship has not just faded, it has inverted.
For anyone still using oil prices as a shorthand signal for CAD direction, that trade is no longer reliable. Positioning on the back of it now means betting on a relationship that has materially decoupled, and updating your framework here removes a whole category of forecasting error that still fills retail commentary.
What the Bank of Canada signals, and where institutions see USD/CAD heading
The Bank of Canada is caught in a genuine bind, and that tension is exactly what makes its next moves so important for the pair.
Holding the overnight rate at 2.25% across three consecutive Fixed Announcement Dates (28 January, 15 July, and 2 September 2026) reflects real concern about weak growth. But inflation has been sticky. The BoC’s July 2026 Monetary Policy Report projected inflation running near 3% in Q2 2026, easing to about 2.5% in the second half, before reaching the 2% target by early 2027. That upside pressure could pull a tightening signal forward.
Governor Tiff Macklem is scheduled to speak in Halifax next Monday, and the market is watching closely for exactly that kind of hawkish tone. A tightening signal would matter because it narrows the US-Canada rate gap, and closing that gap is the single most direct route to structural CAD support.
For now, RBC Economics expects the BoC to hold at 2.25% through 2026, then raise into a 2.25-3.25% neutral range in 2027.
The BoC rate path through 2026 and into 2027 is where the most consequential uncertainty sits, with TD Securities projecting no change through all four quarters of 2026 and the first move arriving as a hike in January 2027 rather than a cut.
Three scenarios to watch for USD/CAD into year-end
The institutional forecasts share a clear directional lean, even if they disagree on timing.
| Institution | Q4 2026 target | 12-month target | Key condition |
|---|---|---|---|
| Scotiabank Economics | 1.37 | 1.33 (Q4 2027) | Rate gap compresses |
| RBC Capital Markets | Low 1.30s | 1.30 | Cyclical underperformance fades |
| ING | 1.36 | Mildly bearish USD/CAD | Gradual USD slide |
| TD Economics | 1.39-1.40 | Broadly flat to lower | Range holds |
| MTFX 5-bank consensus | 1.37-1.41 | Directional lean lower | Near-term range |
Reading those numbers together points to three scenarios worth mapping:
- Base case (most likely): The rate differential compresses gradually and the pair drifts toward 1.37-1.39 over the coming quarters.
- Upside risk for USD/CAD (tail risk): US-Canada trade escalation or sticky US yields keep the pair near or above 1.40, testing the 1.43-1.44 area, a scenario flagged by retail aggregators LiteFinance and LongForecast.
- Downside risk for USD/CAD (tail risk): A BoC surprise hike responding to sticky core inflation, or broad USD weakness, pulls the pair below 1.37 toward 1.33.
The consensus pointing toward 1.30-1.37 over 12 months tells you the market’s dominant bet is on a CAD recovery. But TD’s near-term 1.39-1.40 and the retail 1.37-1.41 range reflect real uncertainty about timing. The message is that patience and catalyst-watching matter more than trying to guess direction right now.
Reading USD/CAD when the old rules no longer apply
The single most useful shift you can make is retiring oil prices as your primary CAD signal.
The evidence across this analysis points in one direction: three drivers now do the heavy lifting, and oil is no longer one of them. Your monitoring checklist should centre on:
- The US-Canada rate differential, the structural anchor keeping the pair elevated
- Broad USD sentiment, the dominant force in the current move
- US-Canada trade headlines, the structural drag most likely to swing the loonie
Keep the technical map close, too. Support sits at 1.3940-1.3950 on pullbacks. Resistance is at 1.3990, with extensions to 1.4050 and 1.4125 if 1.40 breaks convincingly. The 1.41-1.42 institutional seller zone is where momentum has historically stalled.
On timing, the near-term consensus sits in the 1.37-1.41 range per MTFX, with a 12-month directional lean toward 1.30-1.37 from RBC and Scotiabank. Macklem’s Halifax remarks, the upcoming BoC Fixed Announcement Dates, and any movement in trade negotiations are the events most likely to shift the pair.
Readers who update their habits now, watching rate differentials and trade policy rather than the oil chart, will read incoming data far more accurately than those still anchored to the petro-currency model.
This article is for informational purposes only and should not be considered financial advice. Investors should conduct their own research and consult with financial professionals before making investment decisions. Past performance does not guarantee future results, and financial projections are subject to market conditions and various risk factors. Forward-looking statements are speculative and subject to change based on market developments.