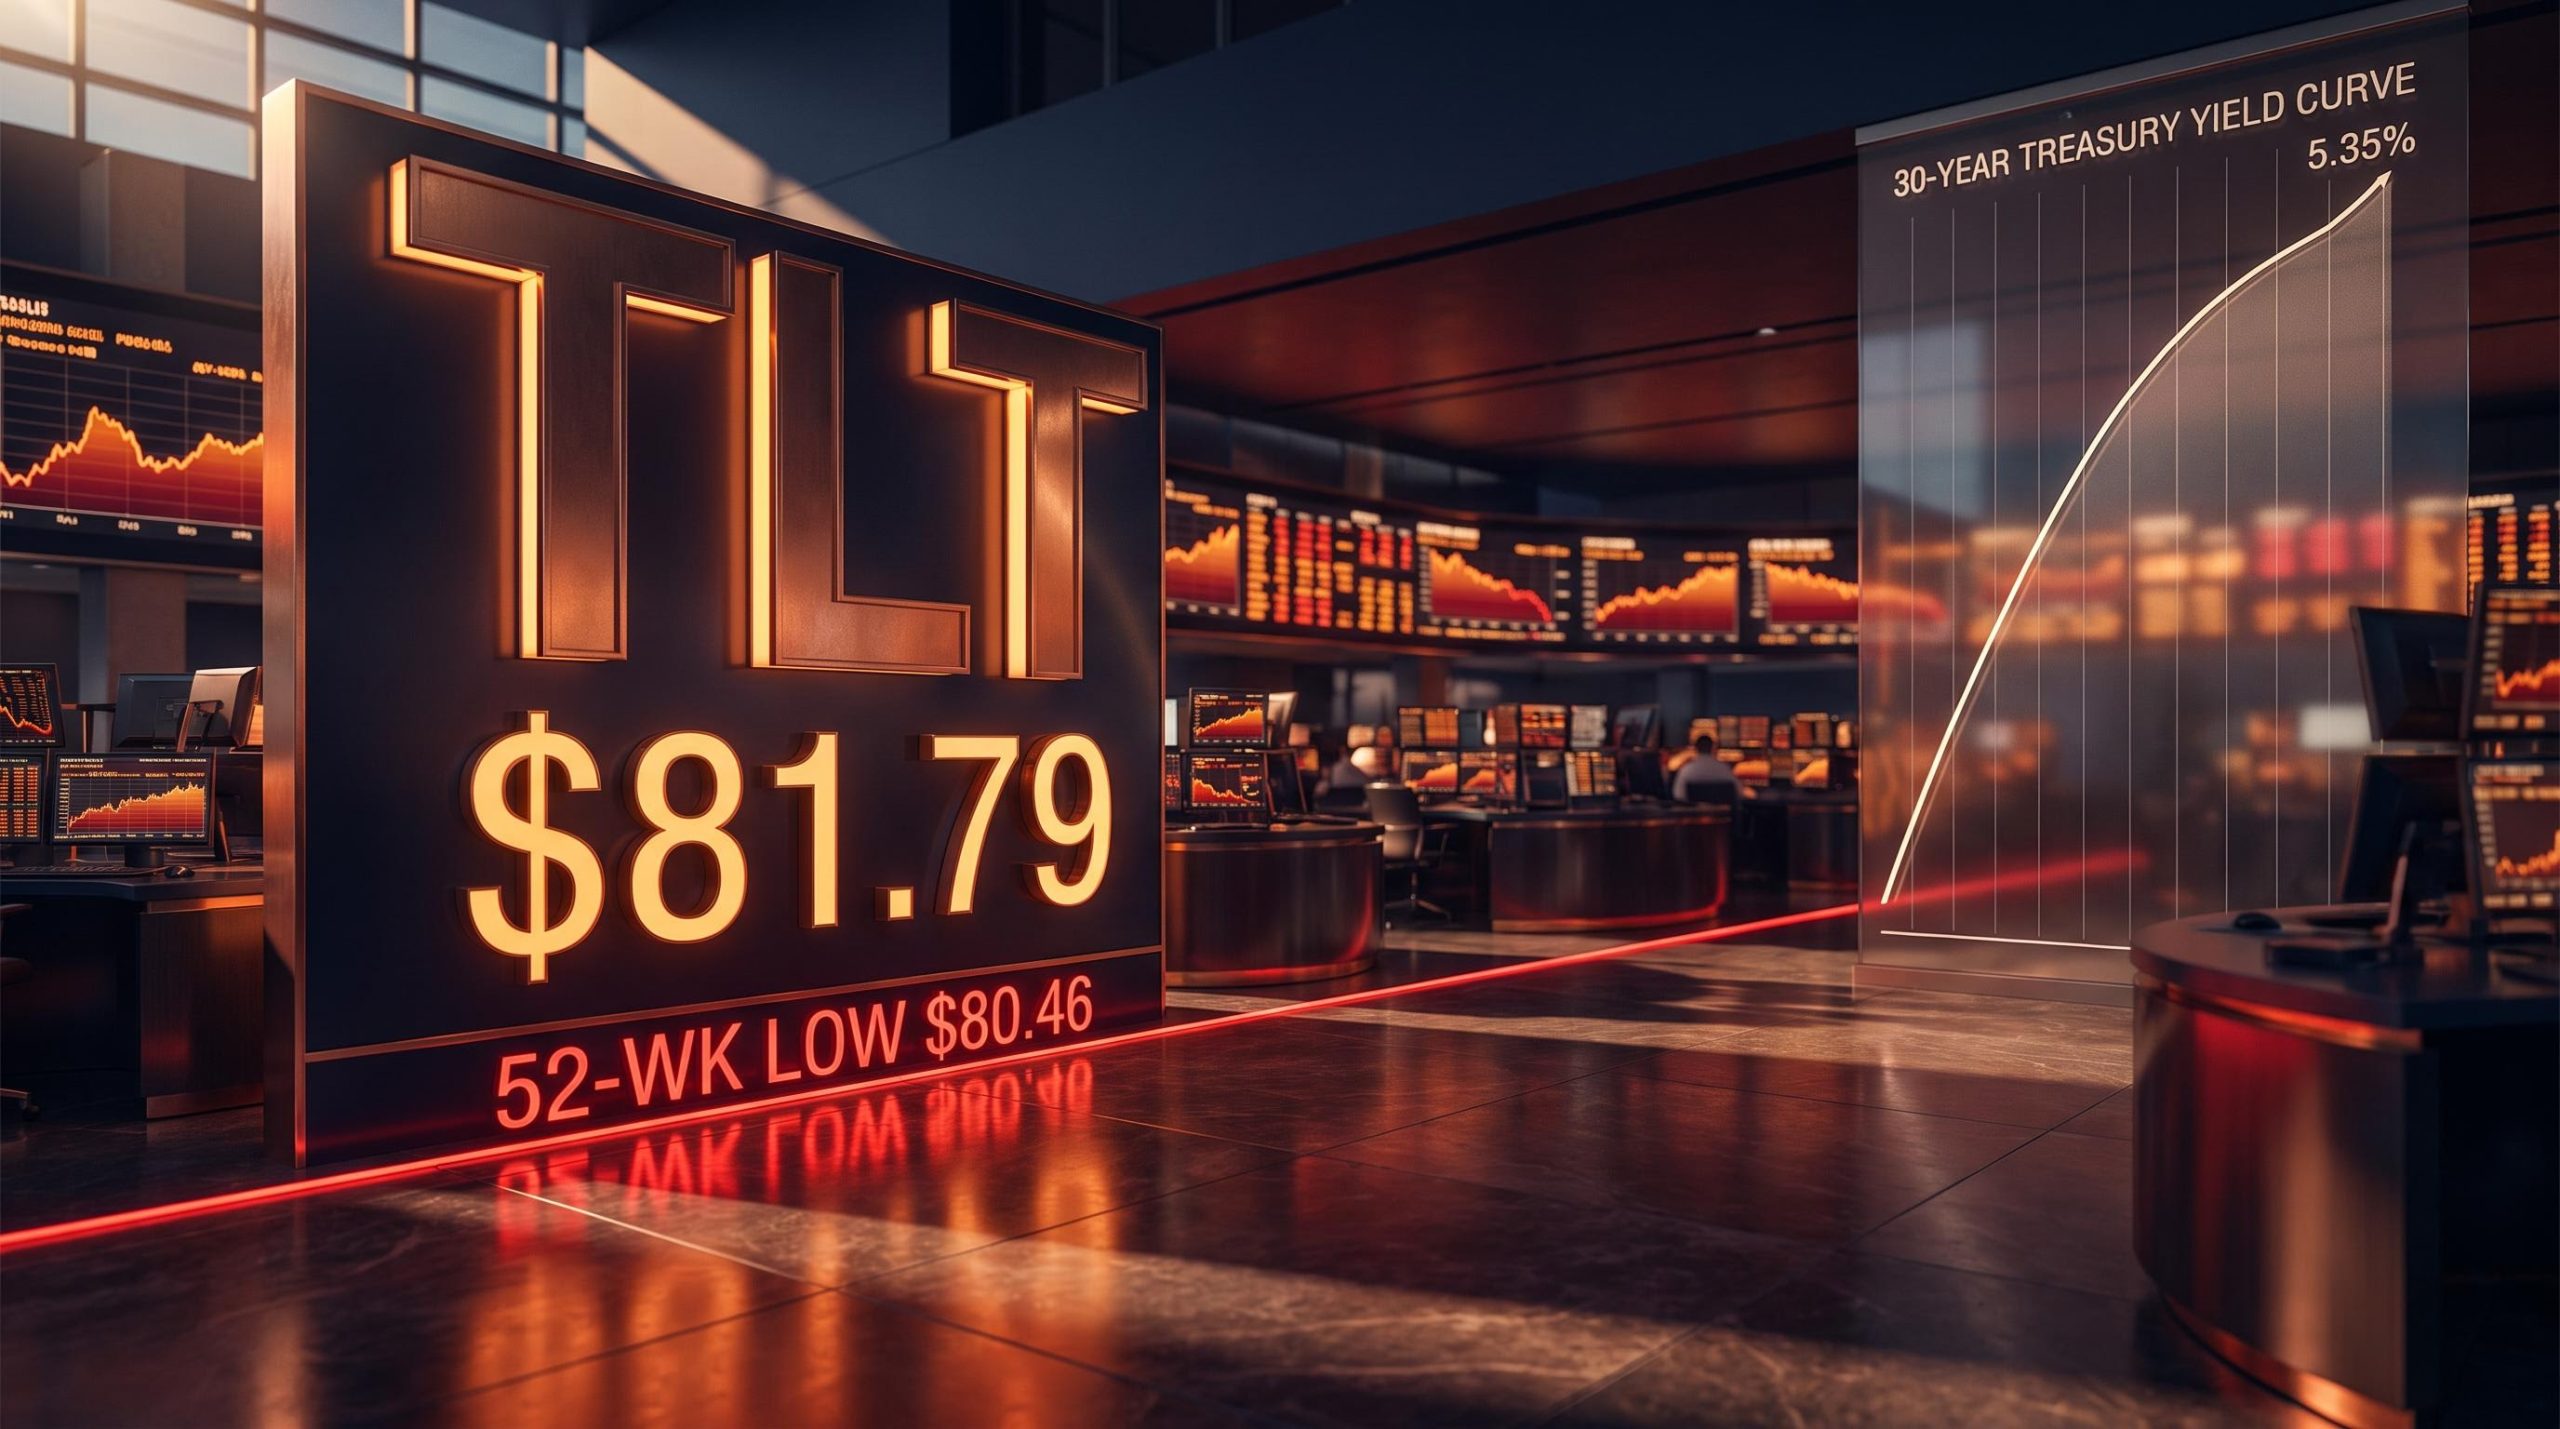
The iShares 20+ Year Treasury Bond ETF (TLT) peaked on the day of the Federal Reserve’s rate decision, then reversed sharply lower, closing the week near $81.79, barely above its 52-week low of $80.46. Meanwhile the 30-year Treasury yield sits at roughly 5.29%-5.35%, near multi-decade highs.
The proximate trigger was clear enough: on 16 September 2026 the Federal Open Market Committee (FOMC) raised the federal funds rate to 3.75%-4.00%, its first hike in about three years. But the deeper picture is what matters. Long bond futures have been grinding lower for decades, the federal deficit now exceeds 5% of GDP, and a bond-buying programme associated with Treasury Secretary Bessent is set to expire on election day. This is not a single-event story.
The question worth answering is not whether long bonds are weak. It is whether this is a cyclical dip or the early stage of something structurally larger. Here is a clear analytical read on why long bonds are breaking down, which sectors feel it first, and what your exposure to TLT or long Treasuries actually means in this rate environment.
What the FOMC reversal in TLT is actually telling you
Price action around a Fed decision often carries more information than the decision itself. TLT delivered a textbook example of that principle in reverse.
The ETF climbed into the FOMC announcement, then turned lower and pulled back through the rest of the week to close near $81.79, down roughly two-thirds of a percent on the day and just above its 52-week floor. The prior close was $80.88.
The inverse relationship at the core of bond yield mechanics means TLT’s price decline and the 30-year yield’s climb toward 5.35% are two descriptions of the same event, not two separate signals, a distinction that matters when calibrating how much yield relief a Fed pause would actually deliver.
Here is the range that frames the move:
- Current price: approximately $81.79 (18 September 2026)
- 52-week low: $80.46
- 52-week high: $92.19
That places TLT much closer to its lowest point of the year than its highest, and the technical read is not encouraging. The original chart analysis projects TLT declining into the 70s price range over coming months, extending a multi-decade downtrend visible in long bond futures.
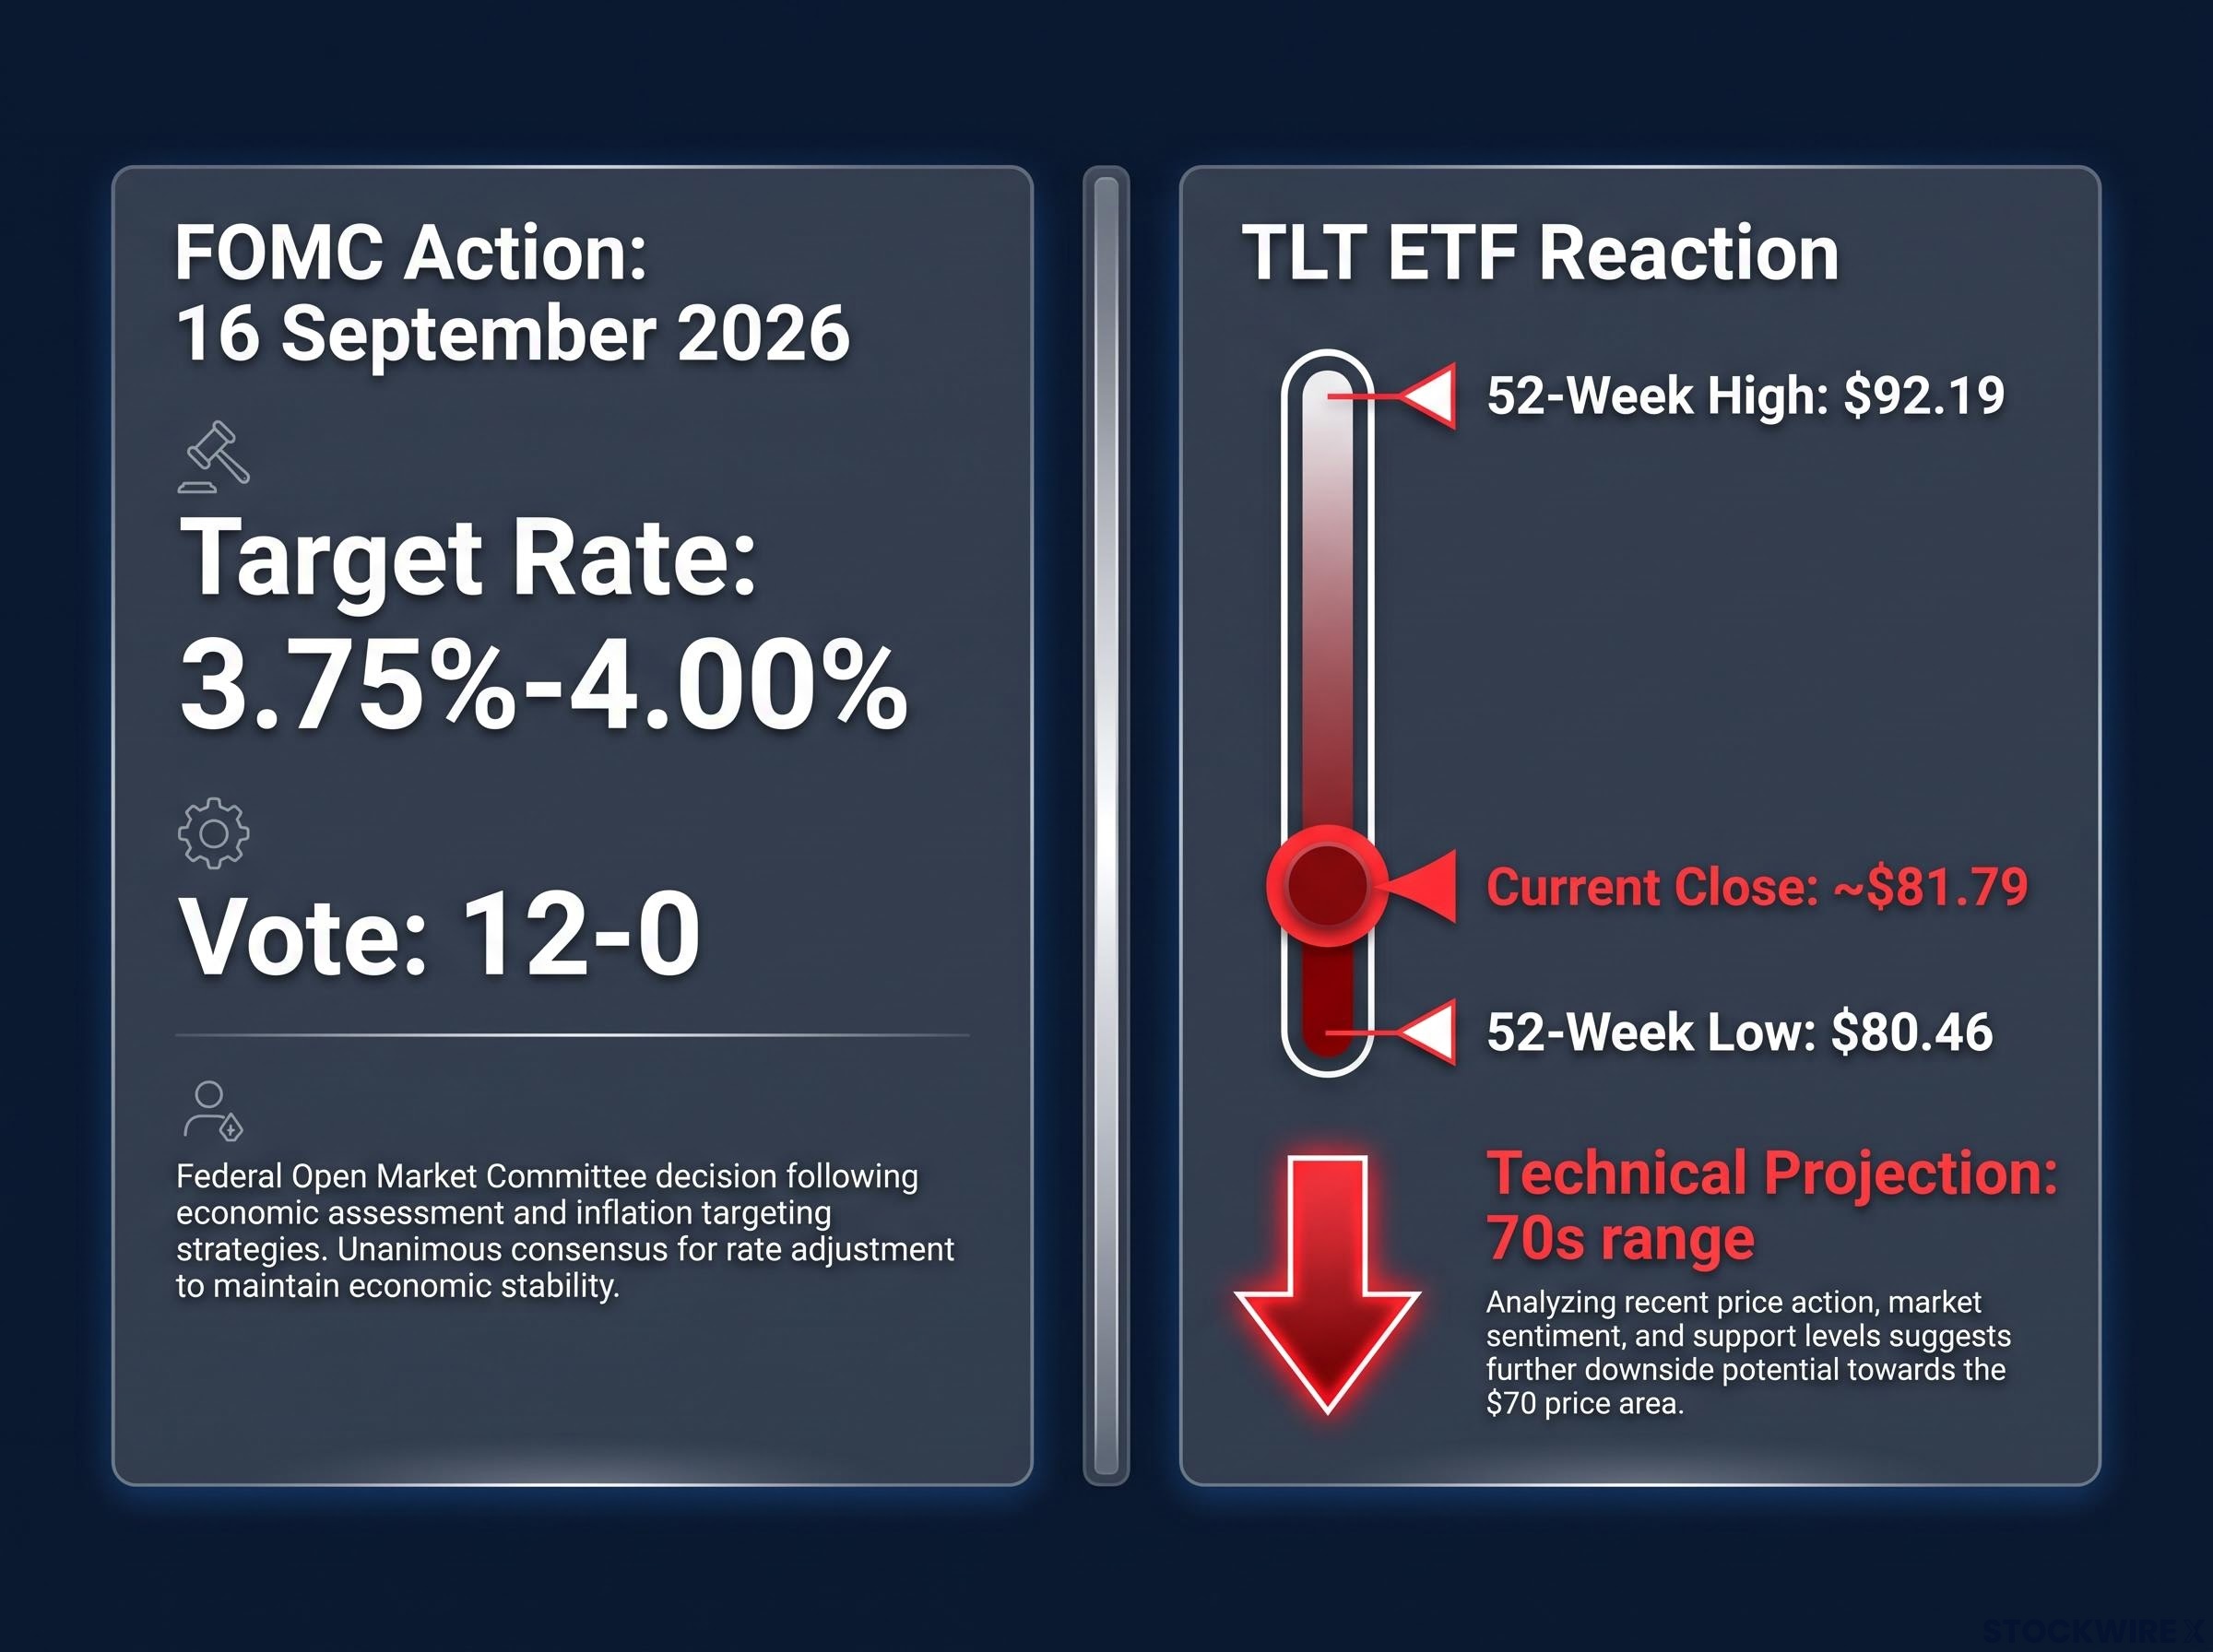
The Fed’s action was unanimous. The Committee voted 12-0 to lift rates by 25 basis points, its first increase after roughly three years on hold, and signalled at least one more hike could arrive before year-end.
“The Committee decided to raise the target range for the federal funds rate by 1/4 percentage point to 3-3/4 to 4 percent.”
The analytically significant part is the sequence. Bonds rallied into the meeting, which suggests the market had priced in some hope of a dovish tone. The statement did not deliver it, and the repricing was immediate.
That reversal tells you the bond market found no reassurance in what the Fed did or said. For a reader holding TLT as a portfolio hedge, that matters directly. If the technical projection into the 70s plays out, the position is not cushioning risk. It is adding to it.
When big ASX news breaks, our subscribers know first
Why long-bond yields are staying high: competing explanations and what the evidence favours
The 30-year yield sat at roughly 5.29%-5.35% in mid-September 2026, up about 0.63 percentage points from 4.66% a year earlier. That is a large move for the long end, and strategists do not fully agree on why it happened. Four explanations are on the table, and each has evidence behind it.
The first is deficit-centric. The federal deficit exceeds 5% of GDP, total debt sits near $40 trillion, and annual borrowing runs above $2 trillion. Nordea’s Macro & Markets note argues that financing these deficits will grow harder, pushing long yields higher even if the Fed cuts policy rates.
The second is inflation-centric. CME Group links elevated yields to four supply shocks since 2020: COVID-19, the Ukraine war, tariffs, and the Iran war. Each raised inflation risk and the premium investors demand for holding long-dated debt.
The third is policy-centric. TD Economics and Schwab both conclude that most of the rise in long yields reflects expectations the Fed will stay higher for longer, combined with a rebuilding term premium (the extra compensation investors want for locking money into long maturities), rather than a collapse in Fed credibility.
The fourth is demand-centric. Overseas appetite for Treasuries is declining as trade realignment and dollar diversification weaken the traditional safe-haven bid, while heavy corporate issuance, especially for AI data centres, competes for the same capital.
The structural withdrawal of foreign demand is a compounding factor here: Japan cut its Treasury holdings by nearly 4% in early 2026, and the Fed’s share of outstanding public debt has shrunk from roughly 26% in 2021 to approximately 14%, leaving the bond market increasingly dependent on price-sensitive private buyers with no mandate to absorb supply at any yield.
| Framework | Primary driver | Key evidence | Implication for yields | Risk to the view |
|---|---|---|---|---|
| Deficit-centric | Fiscal expansion | Deficit above 5% of GDP, ~$40T debt | Structurally higher | Fiscal consolidation could ease pressure |
| Inflation-centric | Supply shocks | Four shocks since 2020 (CME Group) | Higher inflation premium | Inflation subsiding reverses it |
| Policy-centric | Higher-for-longer Fed | Term premium rebuild (TD, Schwab) | Elevated on rate path | A dovish pivot compresses yields |
| Demand-centric | Weakening buyers | Falling foreign demand, AI issuance | Higher on absorption strain | Renewed safe-haven flows |
Which explanation fits the data best
No single framework carries the full weight. The more persuasive reading is that fiscal pressure, term-premium rebuilding, and weakening foreign demand are converging at once.
That convergence is what separates a regime shift from a cyclical anomaly. A cyclical move reverses with the cycle. A structural move requires structural change.
The political dimension sharpens the point. The Bessent bond-buying programme is set to conclude on election day, removing a specific source of structural support at a known date.
If the yield elevation is primarily structural, then a reader waiting for a Fed pivot to rescue a long-bond position may be waiting for the wrong catalyst entirely.
Small caps and financials: where rising yields land hardest
Rising yields do not treat every sector equally. Small caps feel the pain first, and the reason is mechanical rather than sentimental.
Roughly 40%-45% of Russell 2000 constituent debt is floating-rate, so higher yields flow straight into higher interest costs.
“Approximately 40%-45% of Russell 2000 constituent debt is floating-rate, meaning each basis-point increase in yields flows directly into higher interest expense.”
That single fact drives three compounding channels of pressure on small-cap valuations:
- Direct interest expense: floating-rate debt means yield increases hit earnings immediately, not eventually.
- Maturity wall refinancing risk: loans issued at low rates must roll at much higher coupons, eroding free cash flow.
- Discount-rate compression: higher long yields raise the rate applied to future earnings, hitting low-profitability, high-duration names hardest.
The chart confirms the strain. The iShares Russell 2000 ETF (IWM) set its recent lifetime high on 14 August 2026 and has trended down since, falling roughly two-thirds of a percent on the day of analysis despite a brief intraday rally.
For a reader holding IWM, that 40%-45% floating-rate exposure is not an abstract macro risk. It is a direct earnings drag that will surface in quarterly results before it surfaces in headlines.
The relationship is not one-directional, though. Nasdaq Dorsey Wright data shows the 10-year yield index (TNX) and IWM both rose about 18% from late November through end-August, proof that small caps can rally alongside rising yields when markets read the move as strong nominal growth rather than stress.
Financials: net interest margin benefit or credit risk trap?
Financials sit on the other side of the trade, and the picture is genuinely two-sided.
Higher rates can widen net interest margins, the gap between what banks pay for deposits and what they earn on loans, which lifts bank and insurer profitability when the curve steepens and funding costs stay contained. IVolatility’s “Fractured Market” report noted that elevated Treasury yields kept a lid on IWM and real estate while Consumer Staples and Financials outperformed.
The other side is credit risk. If high rates persist and growth cools, loan quality deteriorates and defaults among leveraged borrowers rise.
The Financial Select Sector SPDR Fund (XLF) has a technical marker the market is watching: resistance just under $57. A break above it would signal the margin story is winning over the credit-risk fear, at least for now.
Defensive sector rotation is not uniform across rate cycles: Danske Bank documented a two-phase pattern in which financials and banks initially outperform rate-sensitive real estate by roughly 7 percentage points before capital shifts into staples and healthcare at the expense of technology and industrials, a sequence that provides a more granular lens on where the current cycle stands.
What history says about extended bond bear markets and the lessons that still apply
The current environment is not unprecedented. It is a recognisable pattern, and the closest analogue is the secular bond bear market that ran from the 1940s into the early 1980s.
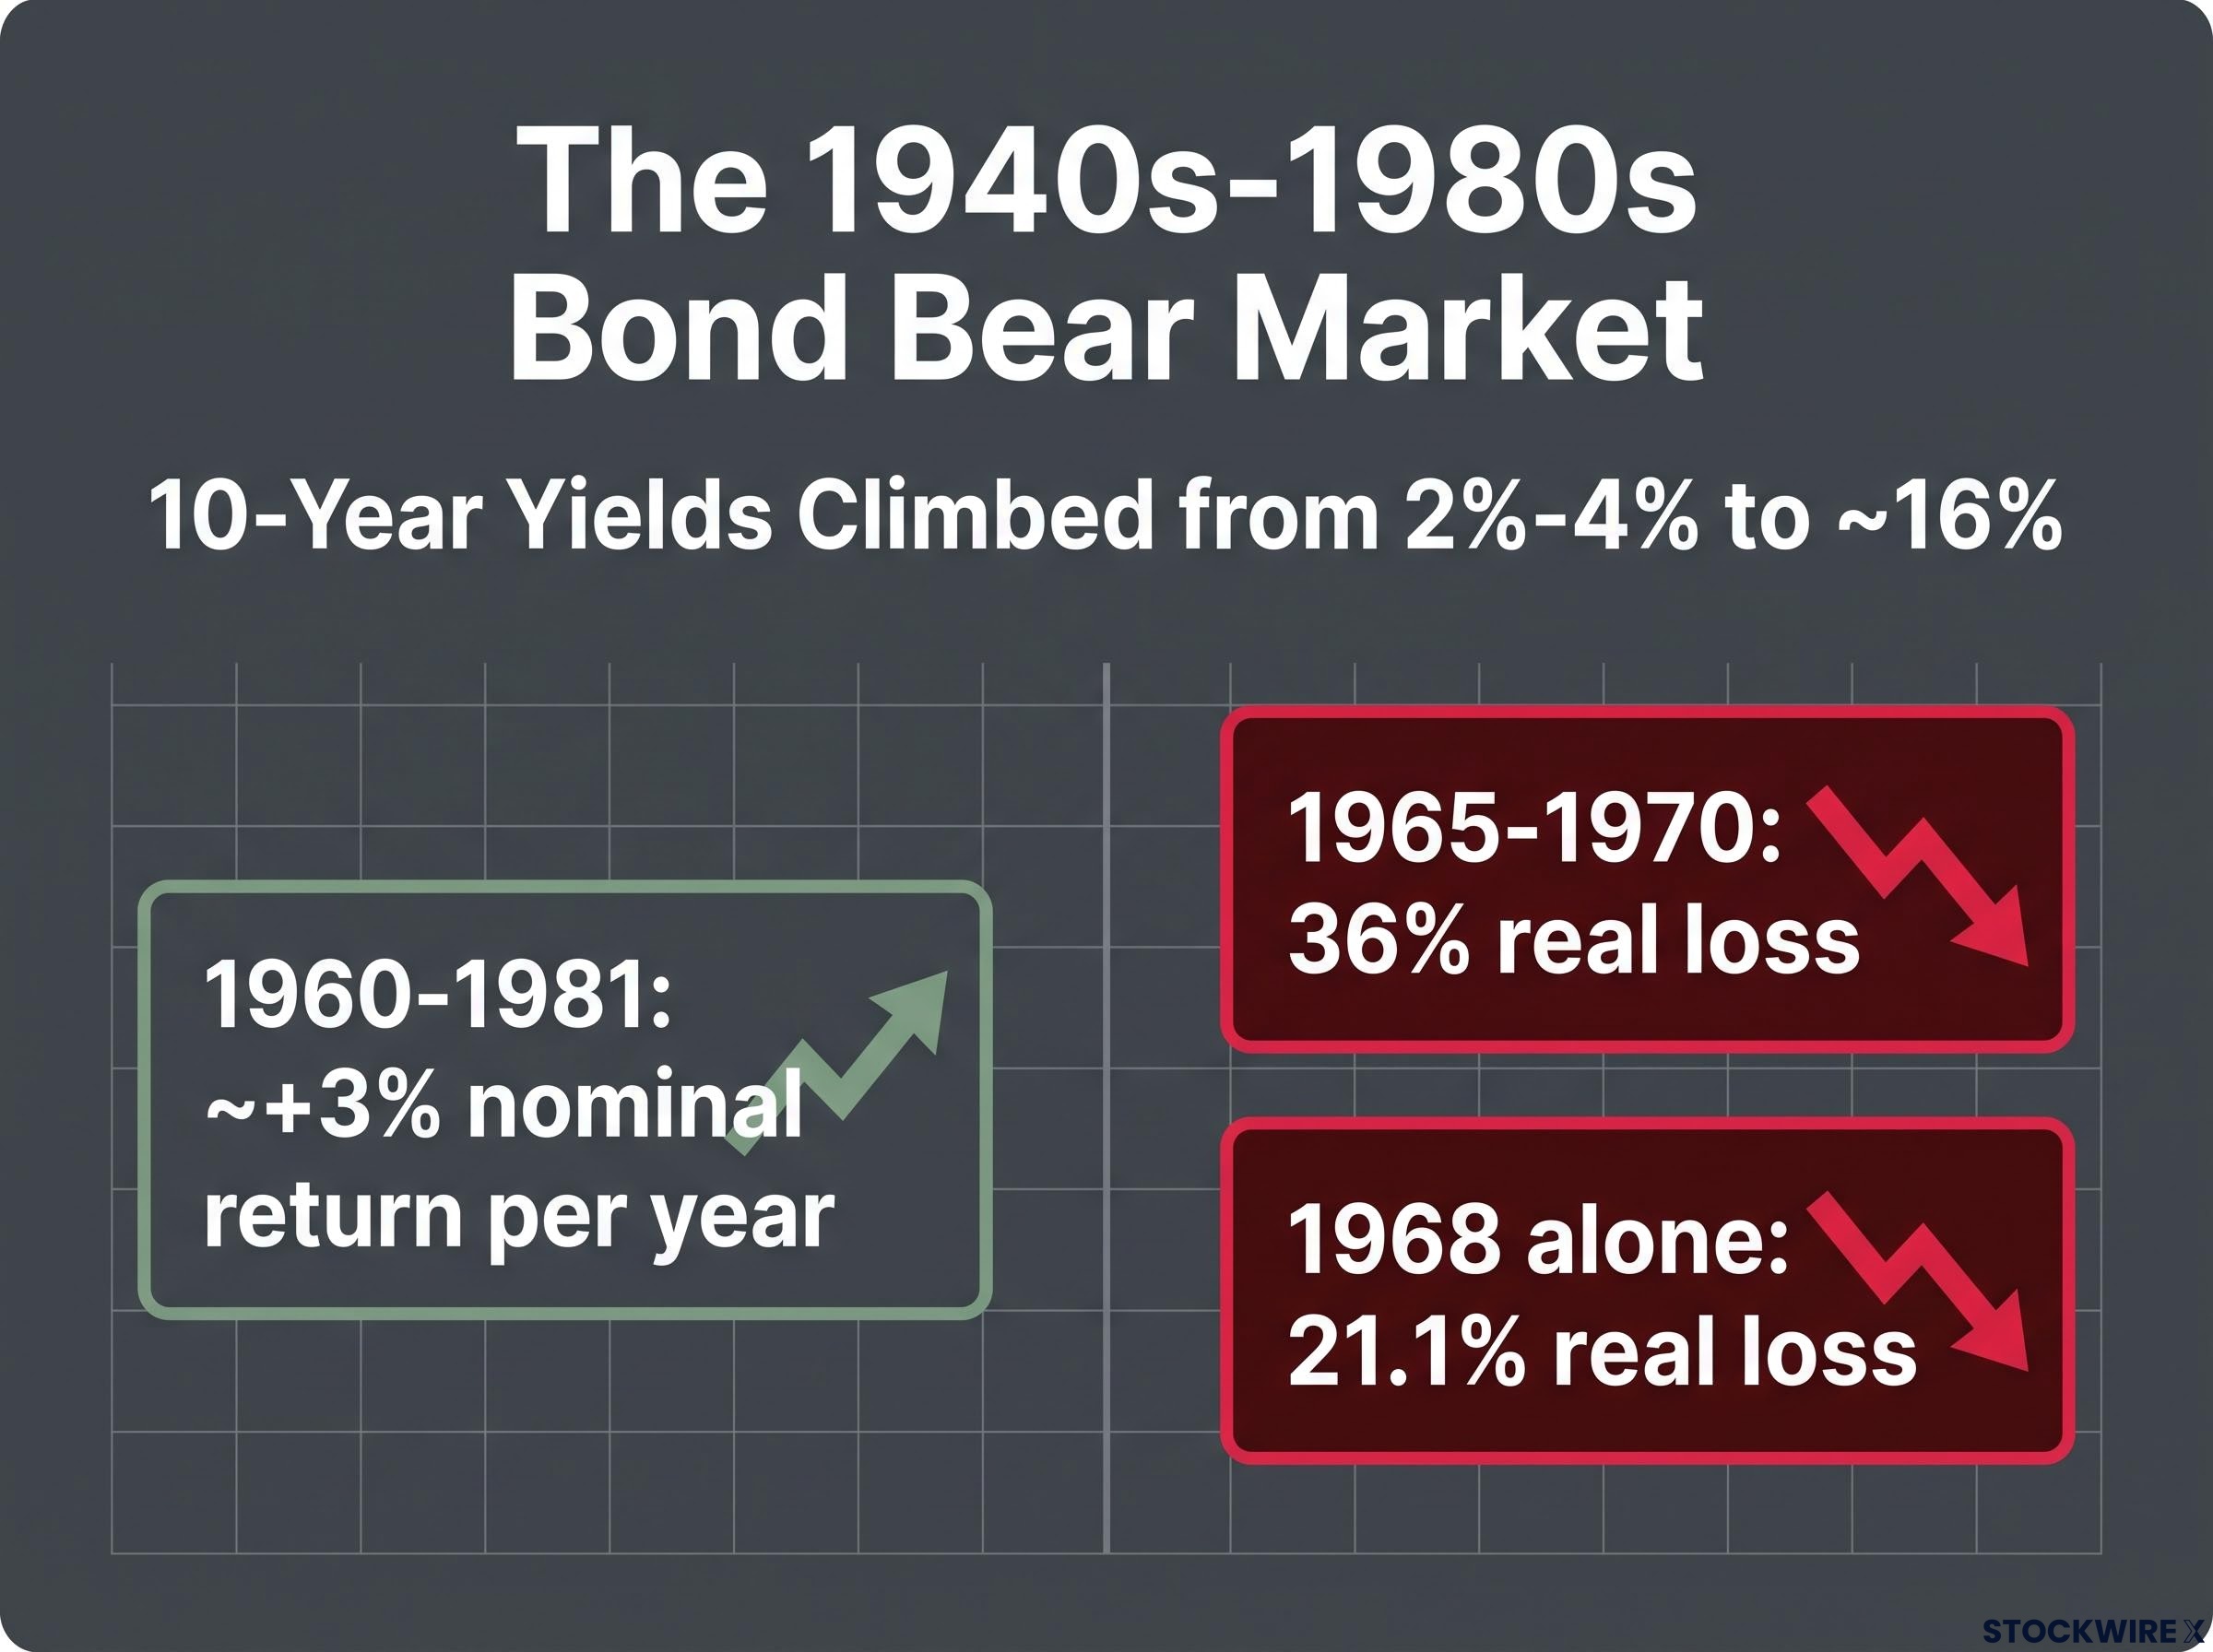
Over that stretch, 10-year yields climbed from roughly 2%-4% to about 16%, driven by inflation, fiscal expansion, supply shocks, and heavy issuance. Those drivers rhyme uncomfortably with today’s fiscal deficits, structural inflation pressure, and record borrowing.
The losses were severe in real terms, which is the number that matters:
- 1940s baseline: 10-year yields sat at roughly 2%-4%.
- 1965-1970: long bonds delivered a 36% real loss.
- 1968 alone: a 21.1% real loss in a single year.
- 1960-1981: long government bonds returned roughly +3% nominally per year, alongside significant negative real returns.
That last figure is the lesson in one line. Investors kept receiving their coupons while inflation quietly destroyed their purchasing power.
For a reader holding TLT as a “safe” anchor, the takeaway is uncomfortable but useful. The safety narrative depends entirely on the inflation assumption baked into the thesis. Strip that assumption out, and the anchor can become a liability.
Strategists today translate that history into four practical responses.
| Strategy | What it does | Risk it addresses | Historical evidence | Example instrument |
|---|---|---|---|---|
| Duration reduction | Shortens maturity exposure | Prolonged price drawdowns | 1965-1981 long-bond losses | Short-dated or floating-rate bonds |
| Diversified fixed income | Spreads risk across sub-classes | Single-sector concentration | Laddered strategies through cycles | Corporates, mortgages, EM, high yield |
| Inflation hedging | Protects real returns | Purchasing-power erosion | Real losses despite nominal gains | TIPS, real assets, infrastructure |
| Tactical overlays | Adds crisis alpha | Correlated bond-equity drops | Man Group trend-following data | Trend-following strategies |
What the breakdown changes, and what it does not
The bearish case is coherent. TLT sits near its 52-week low with a technical projection into the 70s, the structural yield drivers point higher, the sector transmission is already visible in small caps, and the historical precedent for extended duration pain is documented.
The bearish signals stack up:
- TLT trading near its 52-week low of $80.46
- 30-year yield at multi-decade highs around 5.29%-5.35%
- Fed resuming hikes to 3.75%-4.00% after a three-year pause
- Federal deficit exceeding 5% of GDP
- The Bessent bond-buying programme expiring on election day
- Declining overseas demand for Treasuries
But a disciplined analyst names what would break the thesis, not just what supports it:
- A material growth slowdown pulling yields lower
- Inflation subsiding faster than expected
- A risk-off flight to safe havens temporarily compressing yields
- Term-premium normalisation reversing part of the move
Even secular bond bears produce powerful temporary rallies, and a renewed safe-haven bid could look like vindication before it reverses. Semiconductor strength offers a live signal here: the VanEck Semiconductor ETF (SMH) rose about 1% on the day of analysis, with resistance near $580-$587, suggesting speculative risk appetite has not collapsed.
The actionable question is not whether the bearish thesis is correct. It is whether your portfolio can handle both the base case of continued TLT weakness and the tail case of a temporary yield compression. Audit whether your long-duration exposure is still doing the job you assumed it would, and whether that assumption still holds in this rate regime.
For readers wanting to translate the bearish TLT thesis into a concrete portfolio response, our full explainer on bond investing strategy covers duration management, the case for bond ladders across 1-10 year maturities, and why selling after yields have already risen locks in permanent losses while forfeiting the higher forward income now available.
This article is for informational purposes only and should not be considered financial advice. Investors should conduct their own research and consult with financial professionals before making investment decisions. Past performance does not guarantee future results, and financial projections are subject to market conditions and various risk factors. Forward-looking statements are speculative and subject to change based on market developments.