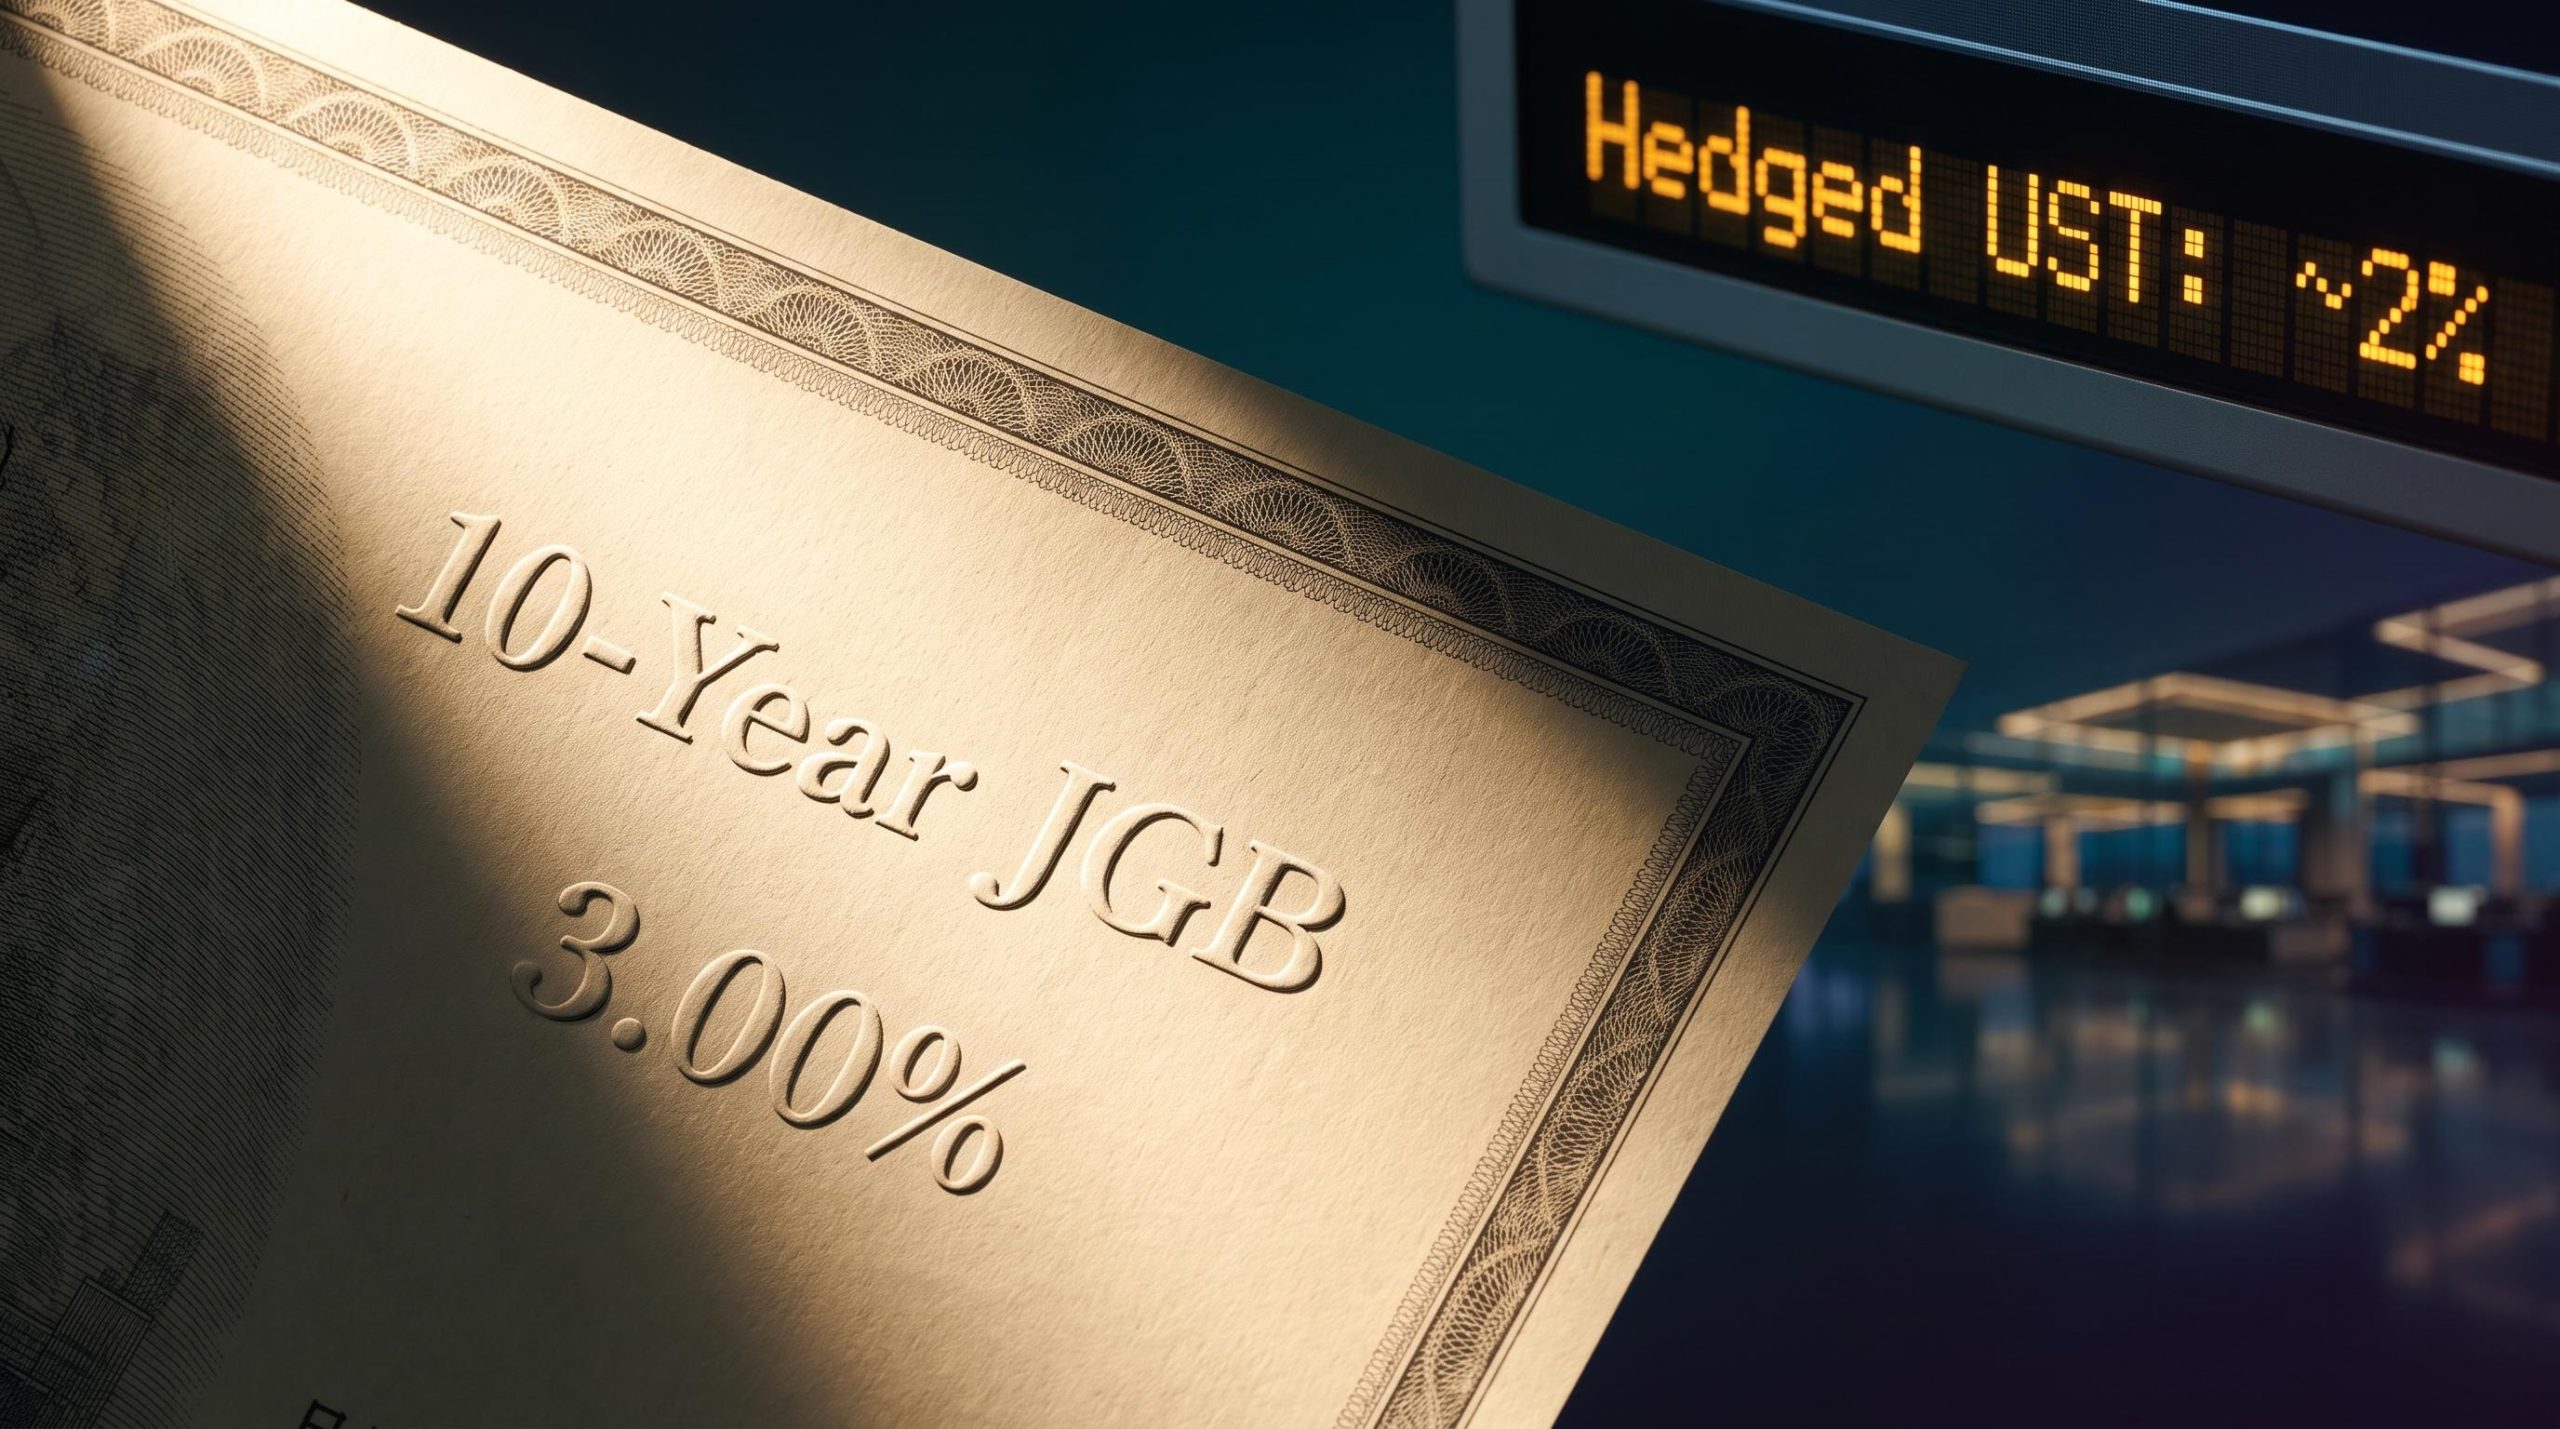
Start with the arithmetic. A Japanese insurer buying a US Treasury earns roughly 2% in yen terms once the cost of hedging the dollar back into yen is stripped out. At home, the 10-year Japanese government bond (JGB) now pays 3% with no currency risk at all. For the first time in a working career, the domestic option pays more.
For roughly three decades, near-zero yields at home pushed Japanese insurers, pension funds, and banks into foreign fixed income, accumulating approximately $1.12 trillion in US Treasuries and an estimated $5 trillion in total US dollar-denominated assets. The 10-year JGB reaching 3% in mid-September 2026, its highest since September 1996, does not force an automatic sell-off. What it does is remove the founding premise of that entire trade. The Bank of Japan (BOJ) policy rate now sits at 1.0%, and market consensus points toward further normalisation.
The BOJ monetary policy statement from June 2025 established the framework for reducing outright JGB purchases through early 2027, a quantitative adjustment that has directly shaped the supply dynamics underpinning the JGB yield rise to 3%.
This piece gives you the framework to tell a structural capital flow shift apart from an ordinary cyclical repricing. It also tells you which specific signals confirm which scenario is unfolding, so you are not waiting on consensus to name a move that may already be underway.
What the 3% threshold actually means for Japanese institutional investors
To understand why a domestic yield number matters for global bond markets, you have to follow the hedging arithmetic that Japanese institutions actually run.
These investors nearly always hedge their foreign bond positions back into yen. That means their real return is not the headline US Treasury yield but the hedged yield, the number left after paying to convert the currency exposure away. And that hedging cost is driven by the short-term rate gap between the dollar and the yen, so every BOJ hike quietly lifts JGB yields and the cost of hedging Treasuries at the same time.
The June 2026 BOJ rate hike to 1.0%, delivered in a 7-1 board vote alongside a structured JGB tapering schedule that reduces monthly purchases by approximately 200 billion yen per quarter, is the policy event that moved the arithmetic from theoretical to operational for institutions running hedged foreign bond books.
Here is the current picture. With dollar-hedging costs near 2.3% on 3-year cross-currency swaps, a hedged 10-year Treasury yields roughly 2% in yen terms. That is about one full percentage point below a comparable JGB, which now pays 3% with zero currency risk attached.
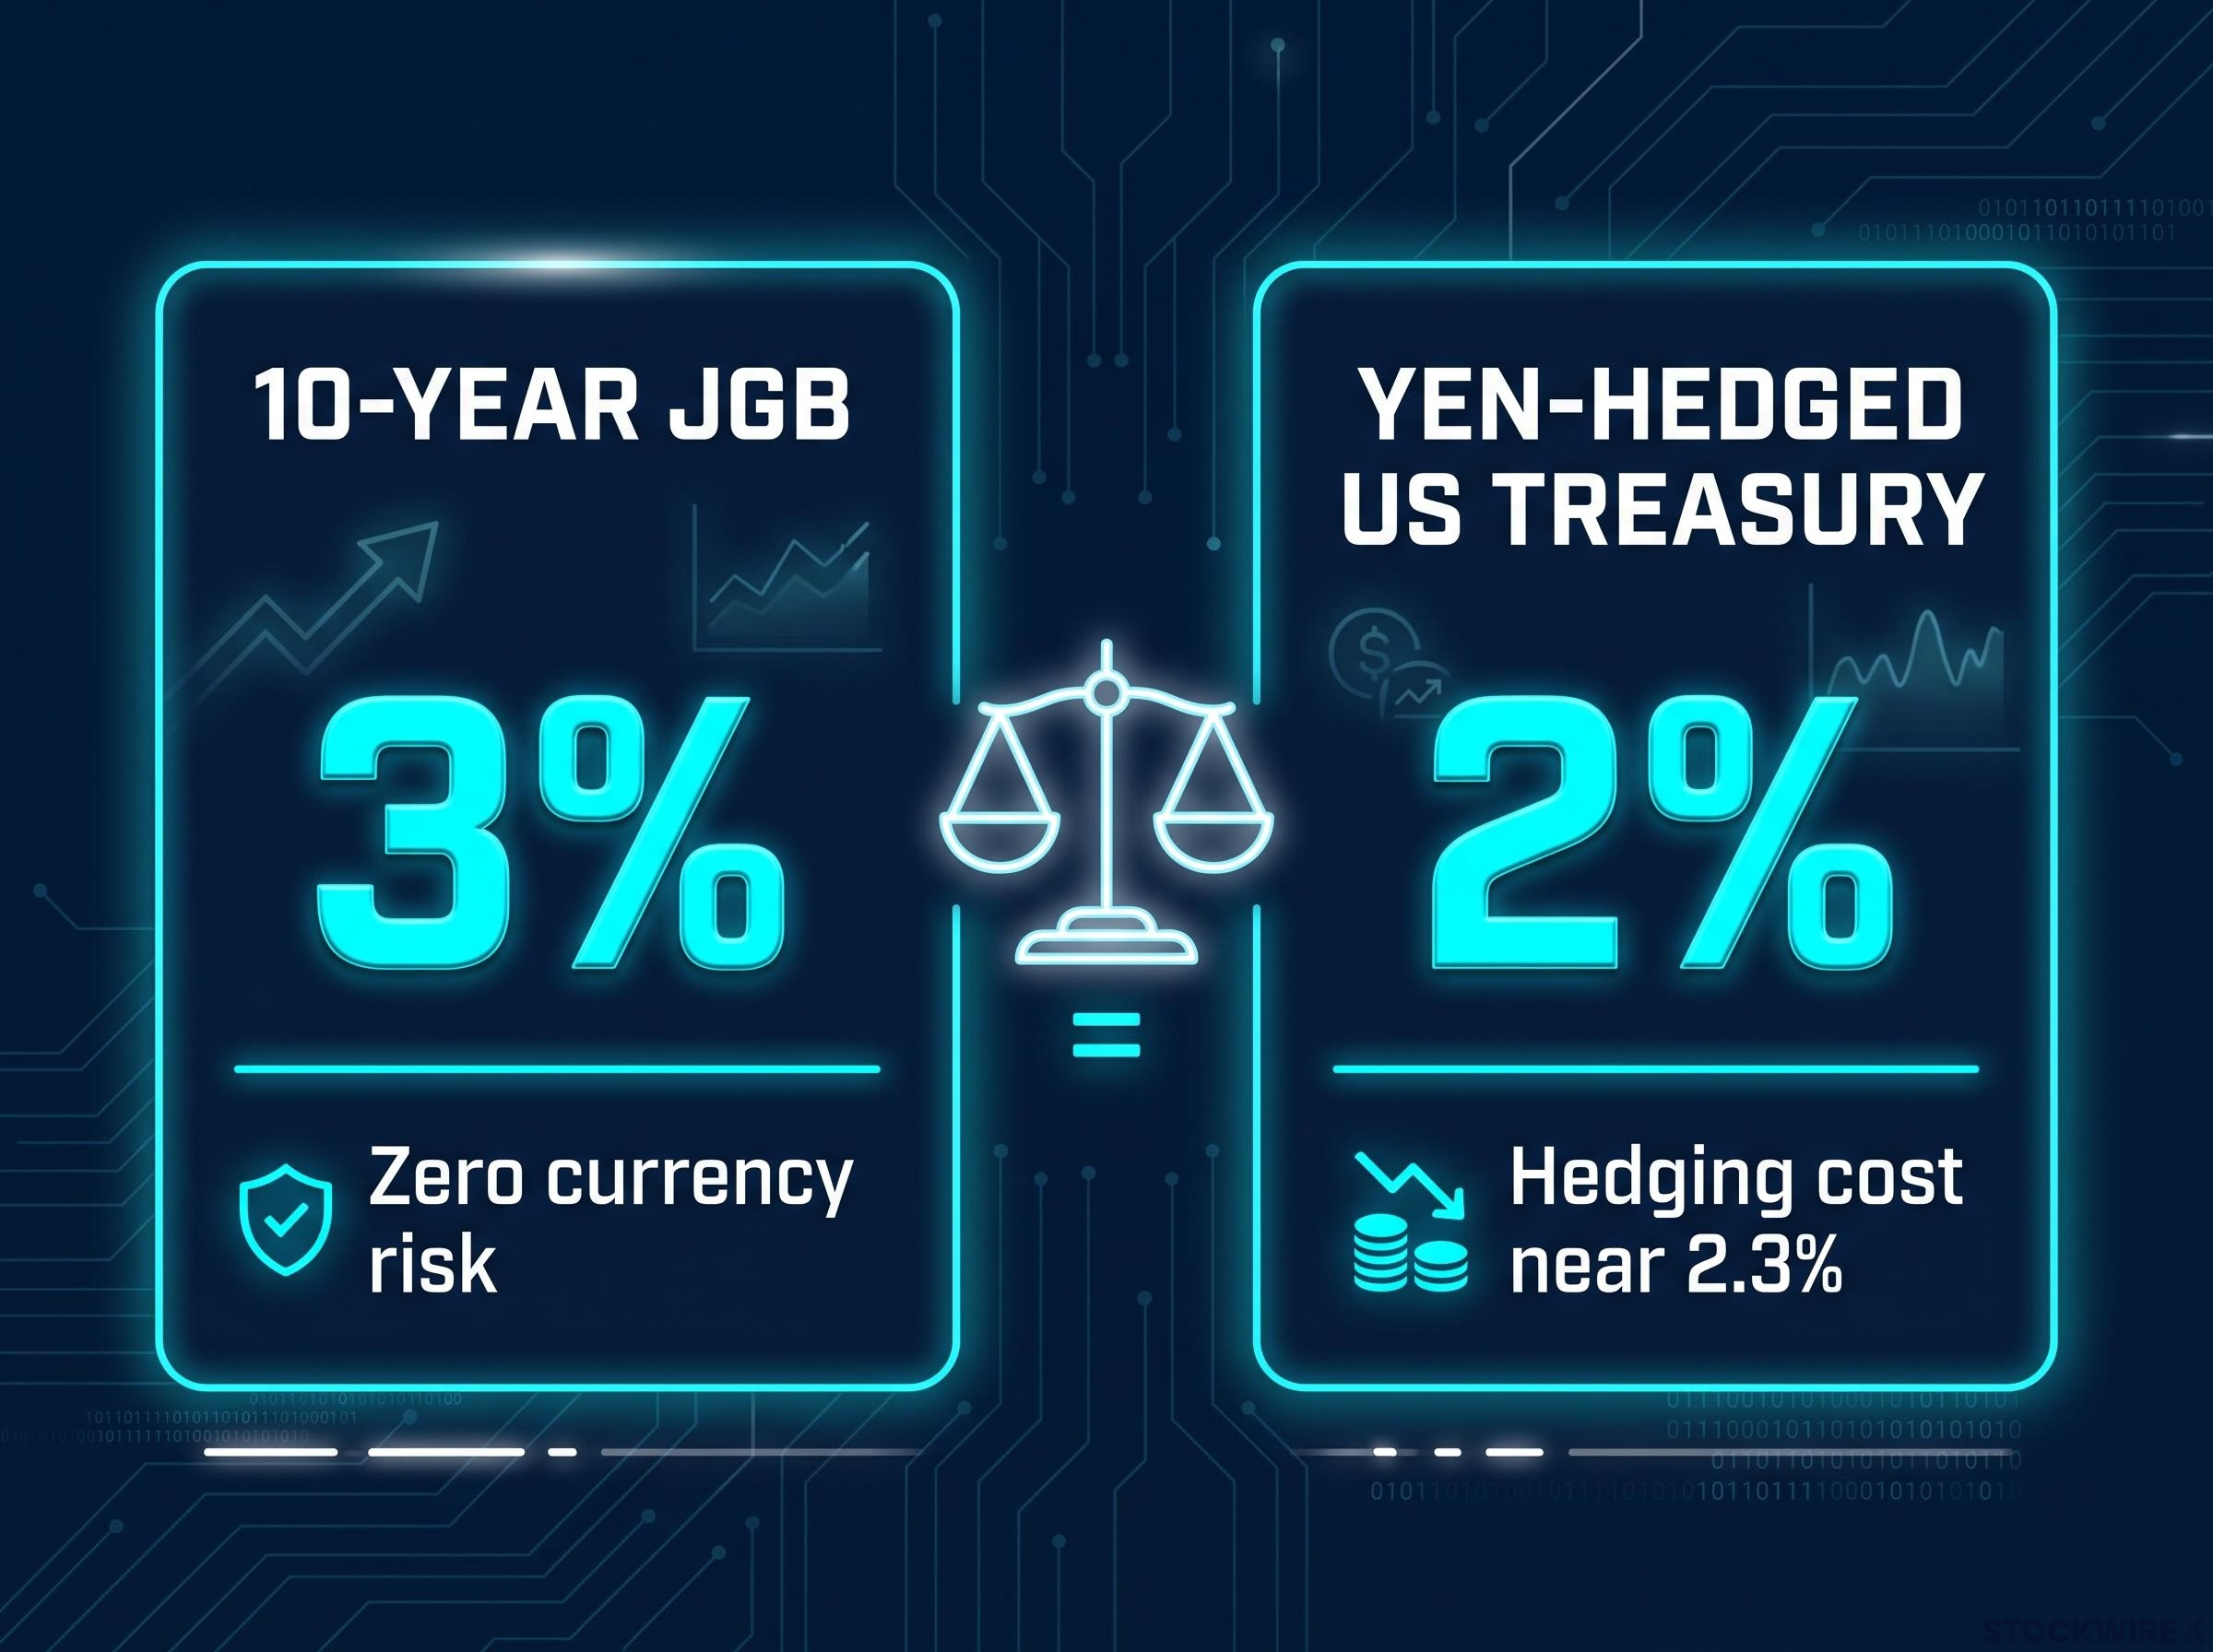
That gap is the point where a 30-year trade stops working mechanically. One analysis placed the threshold at which domestic bonds regained their appeal for major institutions at roughly 1.75-1.77% on the 10-year JGB. At 3%, the current yield sits well beyond it.
The following table shows how the return differential shifts as hedging costs move, holding a 3% 10-year Treasury and a 3% JGB constant.
| Hedging cost scenario | Yen-hedged US Treasury yield | 10-year JGB yield | Differential |
|---|---|---|---|
| 2.3% (2026 level) | ~0.7% | 3.0% | JGB favoured by ~2.3pp |
| 3.0% | ~0.0% | 3.0% | JGB favoured by ~3.0pp |
| 3.5% (2025 level) | ~-0.5% | 3.0% | JGB favoured by ~3.5pp |
Mizuho Bank view Strategist Masayuki Nakajima has noted that as JGB yields climb, domestic bonds become more attractive relative to overseas debt once hedging costs are factored in, making repatriation more rational for institutions that must hedge their currency exposure.
Here is the caveat you need to hold onto. Hedging costs have actually fallen, from around 3.5% in 2025 to roughly 2.3% in 2026. So hedged Treasury returns have not deteriorated as badly as the raw JGB rise from 0.7% in early fiscal 2024 to 1.49% by March 2025 to 2.49% in April 2026 might suggest on its own.
What that tells you is that the repatriation case is real but less mechanically urgent than it was a year ago. If the rotation gathers pace, it will be pulled by the yield on offer at home rather than pushed by acute hedging pain. That distinction sets the timeline over which global yields might feel the effect.
When big ASX news breaks, our subscribers know first
What the flow data actually shows so far
The mechanics say the incentive has flipped. The flow data says the money is starting to move, but at a pace that reads more like repositioning than retreat.
The scale is visible and building. Ranked by size, the documented net selling looks like this:
- ¥4.67 trillion in net sales of US government, agency, and municipal bonds in Q1 2026, the largest quarterly sell-off since Q2 2022.
- ¥3.42 trillion in net overseas bond sales in February 2026, the biggest single month since October 2024.
- ¥3 trillion (approximately $18.7 billion) in net overseas bond sales year-to-date through 22 August 2026, the largest such outflow since the 2022 bond sell-off.
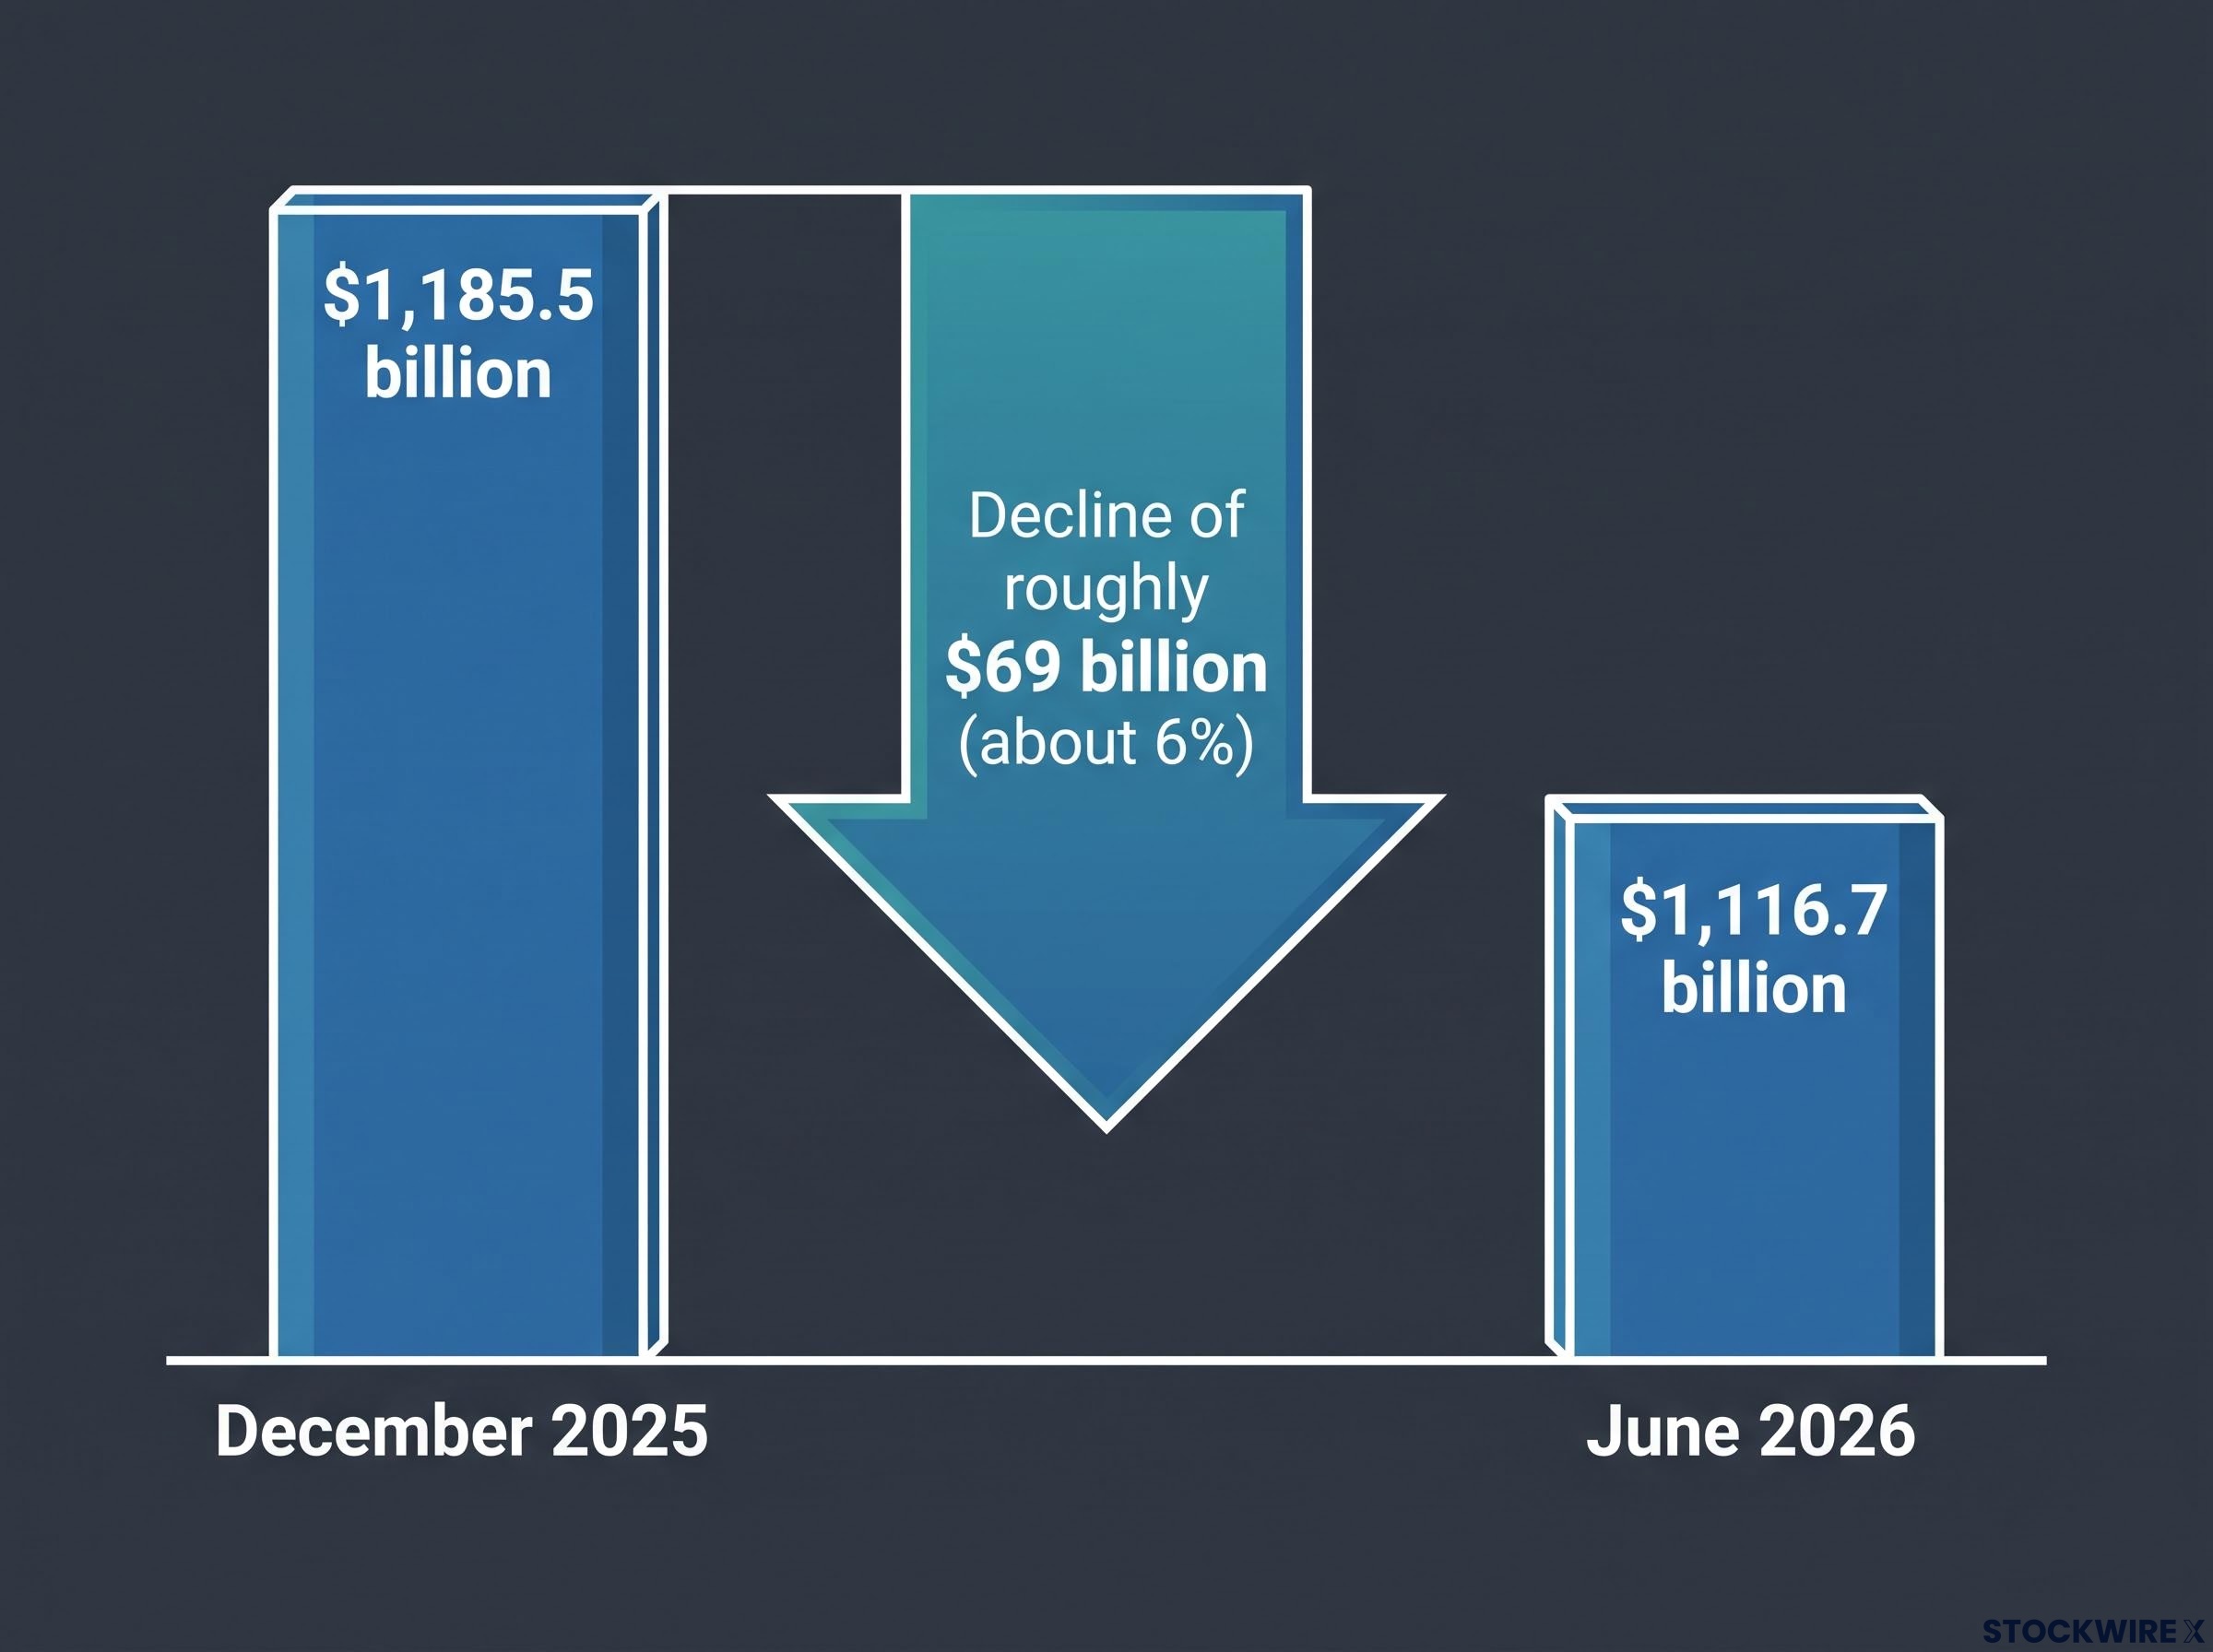
The holdings data confirms the direction. Japan’s US Treasury position fell from $1,185.5 billion in December 2025 to $1,116.7 billion in June 2026, per official TIC Table 5 figures.
That is a decline of roughly $69 billion over six months, which is a large number in isolation. Set against Japan’s total position, though, it works out to about 6%. That tells you this is a measured trim, not a flight.
Why Goldman Sachs and Morgan Stanley see it differently
Two of the largest institutions covering this flow reach a more cautious conclusion, and the gap between their read and the selling data is itself the story.
Goldman Sachs has found no concrete evidence of a large-scale rotation out of Treasuries and into domestic Japanese bonds. Morgan Stanley has noted that Japanese investors remain net buyers of US assets overall, once equities and other allocations are counted alongside bonds.
The institutional inertia argument sits underneath that view. Japan’s Government Pension Investment Fund (GPIF) operates within strict allocation bands, and Goldman Sachs estimates that even a full tilt toward its JGB ceiling represents roughly $80 billion. Meaningful, but not a figure that breaks global fixed income.
GPIF domestic reallocation operates within strict governance constraints: even a full tilt toward its JGB ceiling implies roughly $80 billion in flows over multiple years, a figure that confirms the scale argument without supporting a rapid-exit scenario, and the Honebuto Basic Policy framework released in July 2026 is the first binding test of whether Finance Ministry signalling converts into mandated portfolio shifts.
There is also a liability-driven constraint. Japanese insurers and pension funds match long-duration liabilities against long-duration assets, which makes them structurally reluctant to exit US Treasuries regardless of the relative yield on any given day.
And the selling itself is selective. Japanese investors have cut Eurozone sovereign bonds at the fastest pace in a decade, trimming Europe before touching Treasuries, and reductions in foreign bonds do not convert one-for-one into JGB purchases. Some capital is rotating into equities, credit, and alternatives instead.
The read for you is that a rotation is underway, but at a pace global markets have so far absorbed without visible strain.
How to read the signals that distinguish rotation from repricing
Waiting for a research desk to declare the rotation confirmed means acting after the repricing has happened. A better approach is to watch the underlying data yourself, and to know what each series actually measures.
Here are the six signals worth tracking, grouped by what they tell you:
- TIC data (monthly): Measures realised change in Japan’s Treasury holdings. A persistent, accelerating decline is the primary structural signal.
- Japan MOF flow data (weekly and monthly): Captures net purchases and sales of overseas bonds in near real time. Sustained quarterly outflows focused on US government debt confirm rotation.
- Hedged-return spreads: The gap between yen-hedged Treasury yields (around 2%) and JGB yields (around 3%) is the mechanical driver. Watch the cross-currency swap cost, currently near 2.3%.
- Treasury auction foreign participation: Measures current appetite. Strong foreign take-up means the yield rise is global; weakening take-up points at US fiscal dynamics as the cause.
- Insurer and pension fund disclosures: GPIF reports and life insurer investment plans signal forward intent before it shows in the flow data.
- Cross-currency basis spreads and the yen level: Market-price signals that complement the flow data on shifting hedging demand.
Treasury auction participation is the cleanest of these, because it separates a global yield story from a US-specific one in a single data point.
The most recent evidence points to strength. At the September 2026 30-year auction, the bid-to-cover ratio came in at 2.612, foreign and international investors took 79.5% of the $22 billion on offer, and primary dealers were left with just 2.21%, the lowest dealer take on record. The July 2026 30-year auction showed a similar shape, with a 2.44 bid-to-cover and 77.74% going to indirect buyers. Back in September 2025, a 10-year auction drew a 2.650 bid-to-cover with indirect bidders at 83.1%, the second-highest share ever recorded.
What that record-low dealer take tells you is direct. As of that auction, foreign demand for US Treasuries was strong enough to crowd dealers out of the deal almost entirely. That is not the signature of a structural exodus.
Goldman Sachs cross-market estimate Every 10 basis point idiosyncratic JGB shock is estimated to raise US, German, and UK yields by roughly 2-3 basis points, via global portfolio arbitrage and relative-value trades.
That transmission figure gives you a calibration tool. It tells you roughly how much of any JGB move should be expected to surface in Treasury yields, which helps you separate genuine spillover from noise.
The scale argument and why it cuts both ways
The reason this story is not over sits in one number. Japan’s total external asset position is approximately ¥533 trillion, with an estimated $5 trillion in US dollar-denominated assets alone. Even a 1-2% reallocation from that base represents tens of billions of dollars flowing through global bond markets.
Size, though, is not the same as disruption, and the recent past shows why.
What a second wave of repatriation would require
In 2022, a spike in FX hedging costs, triggered by BOJ yield-curve-control adjustments, prompted partial repatriation. Japanese investors swung from net buyers of roughly $100 billion in foreign bonds per year to net sellers of roughly $200 billion over about 12 months. That is a $300 billion annual swing, and global markets absorbed it. Other buyers stepped in, term premia adjusted, and the system kept functioning.
That precedent is the most useful piece of calibration you have. If a swing of that size did not break global fixed income, the relevant question is not whether Japan can sell, but what would need to be different this time for the outcome to diverge.
Banque de France framing The rise in Japanese yields is characterised as “more scary than dangerous,” with higher hedging costs encouraging some repatriation but global markets absorbing the shift without major disruption.
A genuinely different, more disruptive episode would need one of a few specific conditions: a sustained BOJ path toward 2% or higher, a renewed spike in hedging costs that reverses the recent decline, or a deterioration in US fiscal credibility that finally shows up in weakening Treasury auction participation.
Two things sit outside the standard monitoring list but deserve attention. Japan’s finance minister has publicly referenced the country’s Treasury stockpile as a potential policy tool, which signals official awareness even if actual deployment stays unlikely outside a crisis. And the BOJ’s own forward guidance language, alongside any coordinated commentary from large life insurers about foreign allocation plans, would flag intent before the flow data catches up. Japanese producer inflation running near 7.6% keeps the normalisation pressure live, with consensus pointing toward a 1.25% policy rate at the next scheduled meeting.
Where this leaves the risk calculus for global fixed income
Pull the three findings together and the picture sharpens. The mechanical incentive to repatriate is real but partly offset by lower hedging costs. The flow evidence shows measured selling that markets have absorbed. And the forward signals, above all Treasury auction participation, have not yet deteriorated.
The core tension is simple to state: a hedged Treasury yields roughly 2% in yen terms against 3% at home. That gap is the pull. The question is not whether it exerts force, but whether the pace accelerates.
This is where the asymmetry matters for you. The downside scenario, accelerating repatriation combined with genuine fiscal demand concerns showing up at Treasury auctions, would create compounding pressure on US long rates. The base case, gradual rotation absorbed by other buyers, is already partly priced in. That skew is worth holding in mind.
Treasury buyer composition has already shifted structurally: foreign holders have plateaued near 33% of outstanding debt, US commercial banks have stepped in as the primary marginal buyer at a record $4.8 trillion in holdings, and the ACM model places the 10-year term premium at 0.99-1.35%, confirming that duration risk compensation is drifting higher independent of any single country’s repatriation decision.
The practical implication is that Japanese repatriation is a tail risk that is slowly fattening rather than an immediate threat. It warrants monitoring at the cadence of the data releases, not daily attention.
Ranked by signal clarity and how often the data updates, three priorities stand out:
- MOF weekly bond flow data, the fastest read on whether net selling is accelerating.
- Treasury auction foreign participation at the next 10- and 30-year auctions, the cleanest global-versus-US signal.
- Cross-currency swap-implied hedging costs measured against the JGB yield, the core mechanical driver.
A reader tracking these has a real information edge over those waiting for consensus, because by the time the rotation is declared, the repricing will largely have happened. The Goldman Sachs 2-3 basis point transmission estimate is your yardstick for how much any JGB move should register in Treasuries.
This article is for informational purposes only and should not be considered financial advice. Investors should conduct their own research and consult with financial professionals before making investment decisions.
Past performance does not guarantee future results. Financial projections are subject to market conditions and various risk factors.
Repatriation is underway; the question is whether it stays manageable
The JGB yield crossing 3% has created a genuine incentive shift for Japanese institutional investors, and the flow data confirms that selling is running at a pace comparable to 2022. That much is settled. What is not settled is the pace from here, and the pace is what determines whether this stays a managed rotation.
Two variables decide it. Whether BOJ normalisation continues toward 1.25% and beyond, and whether US fiscal dynamics cause Treasury auction foreign participation to soften, are the levers that would turn an absorbed adjustment into a disruptive one. The six signals in this piece give you a clear way to track which scenario is materialising, and the next MOF release and upcoming BOJ meeting are the nearest inflection points. For now, the Banque de France read holds: more scary than dangerous.
For readers wanting to trace where repatriated capital and a structurally higher yen might redirect global fixed income flows, our full explainer on dollar weakness and EM fixed income covers the 19% return on EM local-currency bonds in 2025 and the $11.4 billion in Q1 2026 inflows that suggest emerging market debt is the cleaner expression of a weakening dollar cycle.