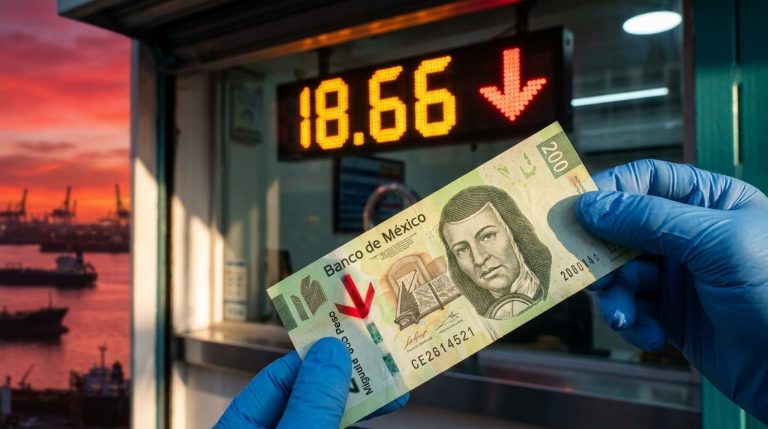
A weaker dollar is not a rising tide for emerging markets. The investors treating it as one are expressing a trade that the flow data does not support, and the gap between what they expect and what is actually working has been widening since the start of 2025.
The USD has fallen roughly 9% in 2025, and that move has produced strong returns in one corner of the emerging market universe: local-currency debt. It has not produced a broad EM equity rally. This is not a paradox. It is a precision problem. The right instruments are responding exactly as the mechanics predict. The wrong instruments are being assumed to work by investors reaching for a simpler macro thesis than the data warrants.
Here is a framework for separating the trades that are actually functioning from those that sound logical but are not yet firing, and for calibrating position size to the right signals rather than the magnitude of the dollar move.
Dollar weakness as normalisation, not debasement: why the distinction changes everything
Before any flow data or return numbers, one conceptual fork in the road determines how every subsequent piece of evidence should be read.
Geoff Yu at BNY characterises the current USD move not as a collapse in American exceptionalism but as something more specific and more limited:
The current dollar decline represents a normalisation of previously extreme dollar and US-asset overweights, not a structural debasement of the currency.
That distinction changes the entire trade. A normalisation drives selective rebalancing flows. International investors are trimming dollar exposure as real-yield support erodes, but the process is orderly and instrument-specific. A genuine debasement would be different: it would drive broad commodity repricing, a weaker dollar feedback loop through inflation expectations, and macro tailwinds across emerging markets as an asset class.
The current environment fits the first description, not the second. International holdings of US equities have grown to a level where the scope for further meaningful reallocation into EM is now quite narrow, with any additional flows likely to be modest and highly targeted. Only a portion of US de-risking flows are reaching emerging markets, and those flows are concentrating in instruments with clear yield, quality, or thematic advantages rather than spreading across the broad EM equity index.
The fiscal arithmetic underpinning structural dollar weakness runs deeper than a single rate cycle: Scotiabank’s modelling links a 6.8% deficit-to-GDP ratio to roughly 4% dollar depreciation by end-2026, and declining Japanese surplus recycling has simultaneously removed one of the currency’s largest demand flows.
The size of the dollar move is the wrong variable to watch when sizing EM exposure. The nature of the move, normalisation versus debasement, is what determines which instruments respond and which ones do not.
When big ASX news breaks, our subscribers know first
What the flow data actually shows about EM winners and losers
The performance divergence between EM debt and EM equities in 2025 was not subtle.
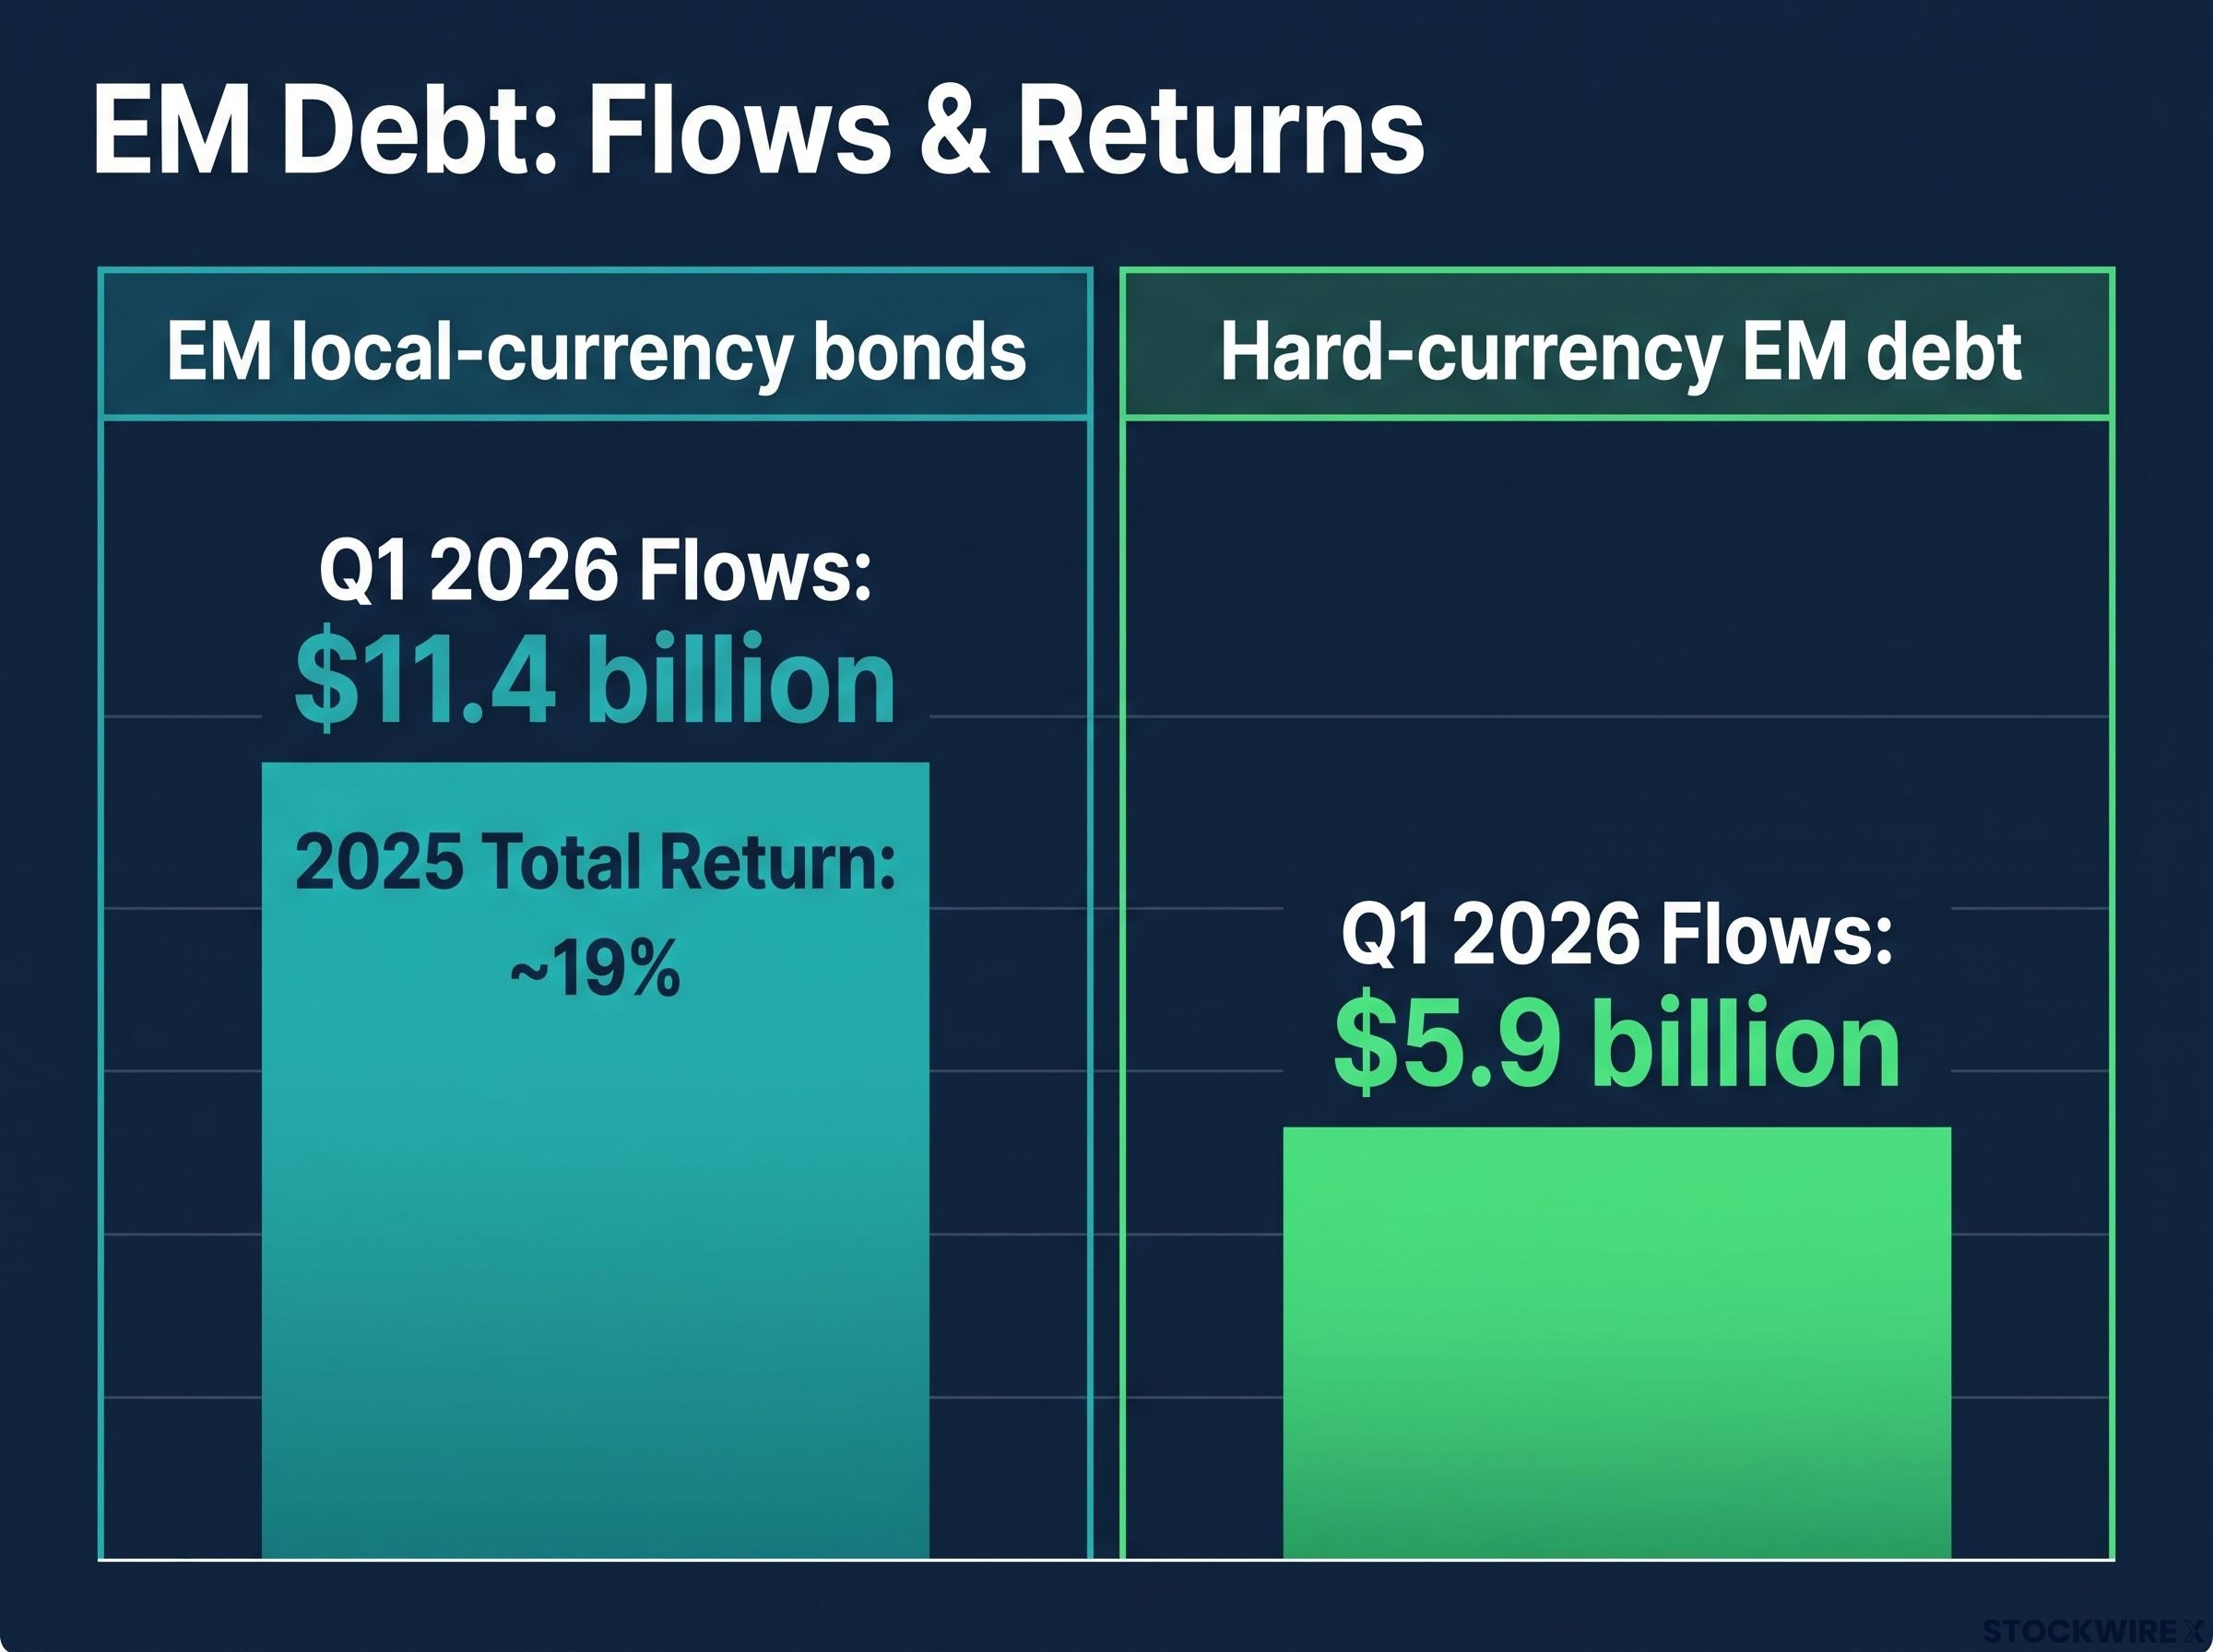
EM local-currency bonds delivered approximately 19% total returns in full-year 2025, according to the J.P. Morgan GBI-EM Global Diversified Index, corroborated by VanEck, State Street Global Advisors, and Ashmore.
That figure outpaced most major fixed-income categories globally. It beat US aggregate bonds in every quarter. And the flows into Q1 2026 confirmed that professional allocators were leaning further into the trade: roughly $11.4 billion flowed into EM local-currency bond funds versus approximately $5.9 billion into hard-currency EM debt, according to EPFR and J.P. Morgan flow data.
Invesco’s EM debt flow analysis, drawing on J.P. Morgan and Bloomberg data, records the JPM GBI-EM Index returning 19.26% in 2025, confirming that the local-currency bond outperformance was not a marginal effect but a category-defining result that professional allocators have been pricing into 2026 positioning.
EM equities told a different story. Where equity buying appeared, it was idiosyncratic and country-specific, not an index-level response to dollar weakness. Poland, South Africa, and Turkey attracted strong targeted buying in EM EMEA, but these were local-story bids driven by policy shifts, structural reforms, and valuation, not dollar mechanics.
| Asset class | Q1 2026 net flows | 2025 total return | Primary driver |
|---|---|---|---|
| EM local-currency bonds | +$11.4bn | ~19% | FX appreciation + carry + duration gains |
| Hard-currency EM debt | +$5.9bn | Positive (below local-currency) | Yield pickup over US Treasuries |
| EM equities | Selective, country-specific | Mixed across regions | Idiosyncratic country catalysts |
The $11.4 billion versus $5.9 billion flow split tells you that professional allocators are expressing dollar-weakness views through local-currency duration and FX, not through equity index exposure. That is the positioning signal worth following.
Three reasons local-currency EM debt is the cleanest dollar hedge
The outperformance rests on three reinforcing mechanisms, each of which compounds the others.
Currency appreciation. When the dollar weakens, local-currency appreciation directly boosts USD-denominated returns. This is the most immediate and mechanical transmission channel, and it requires no earnings growth, no governance improvements, and no political catalysts, just the FX move itself.
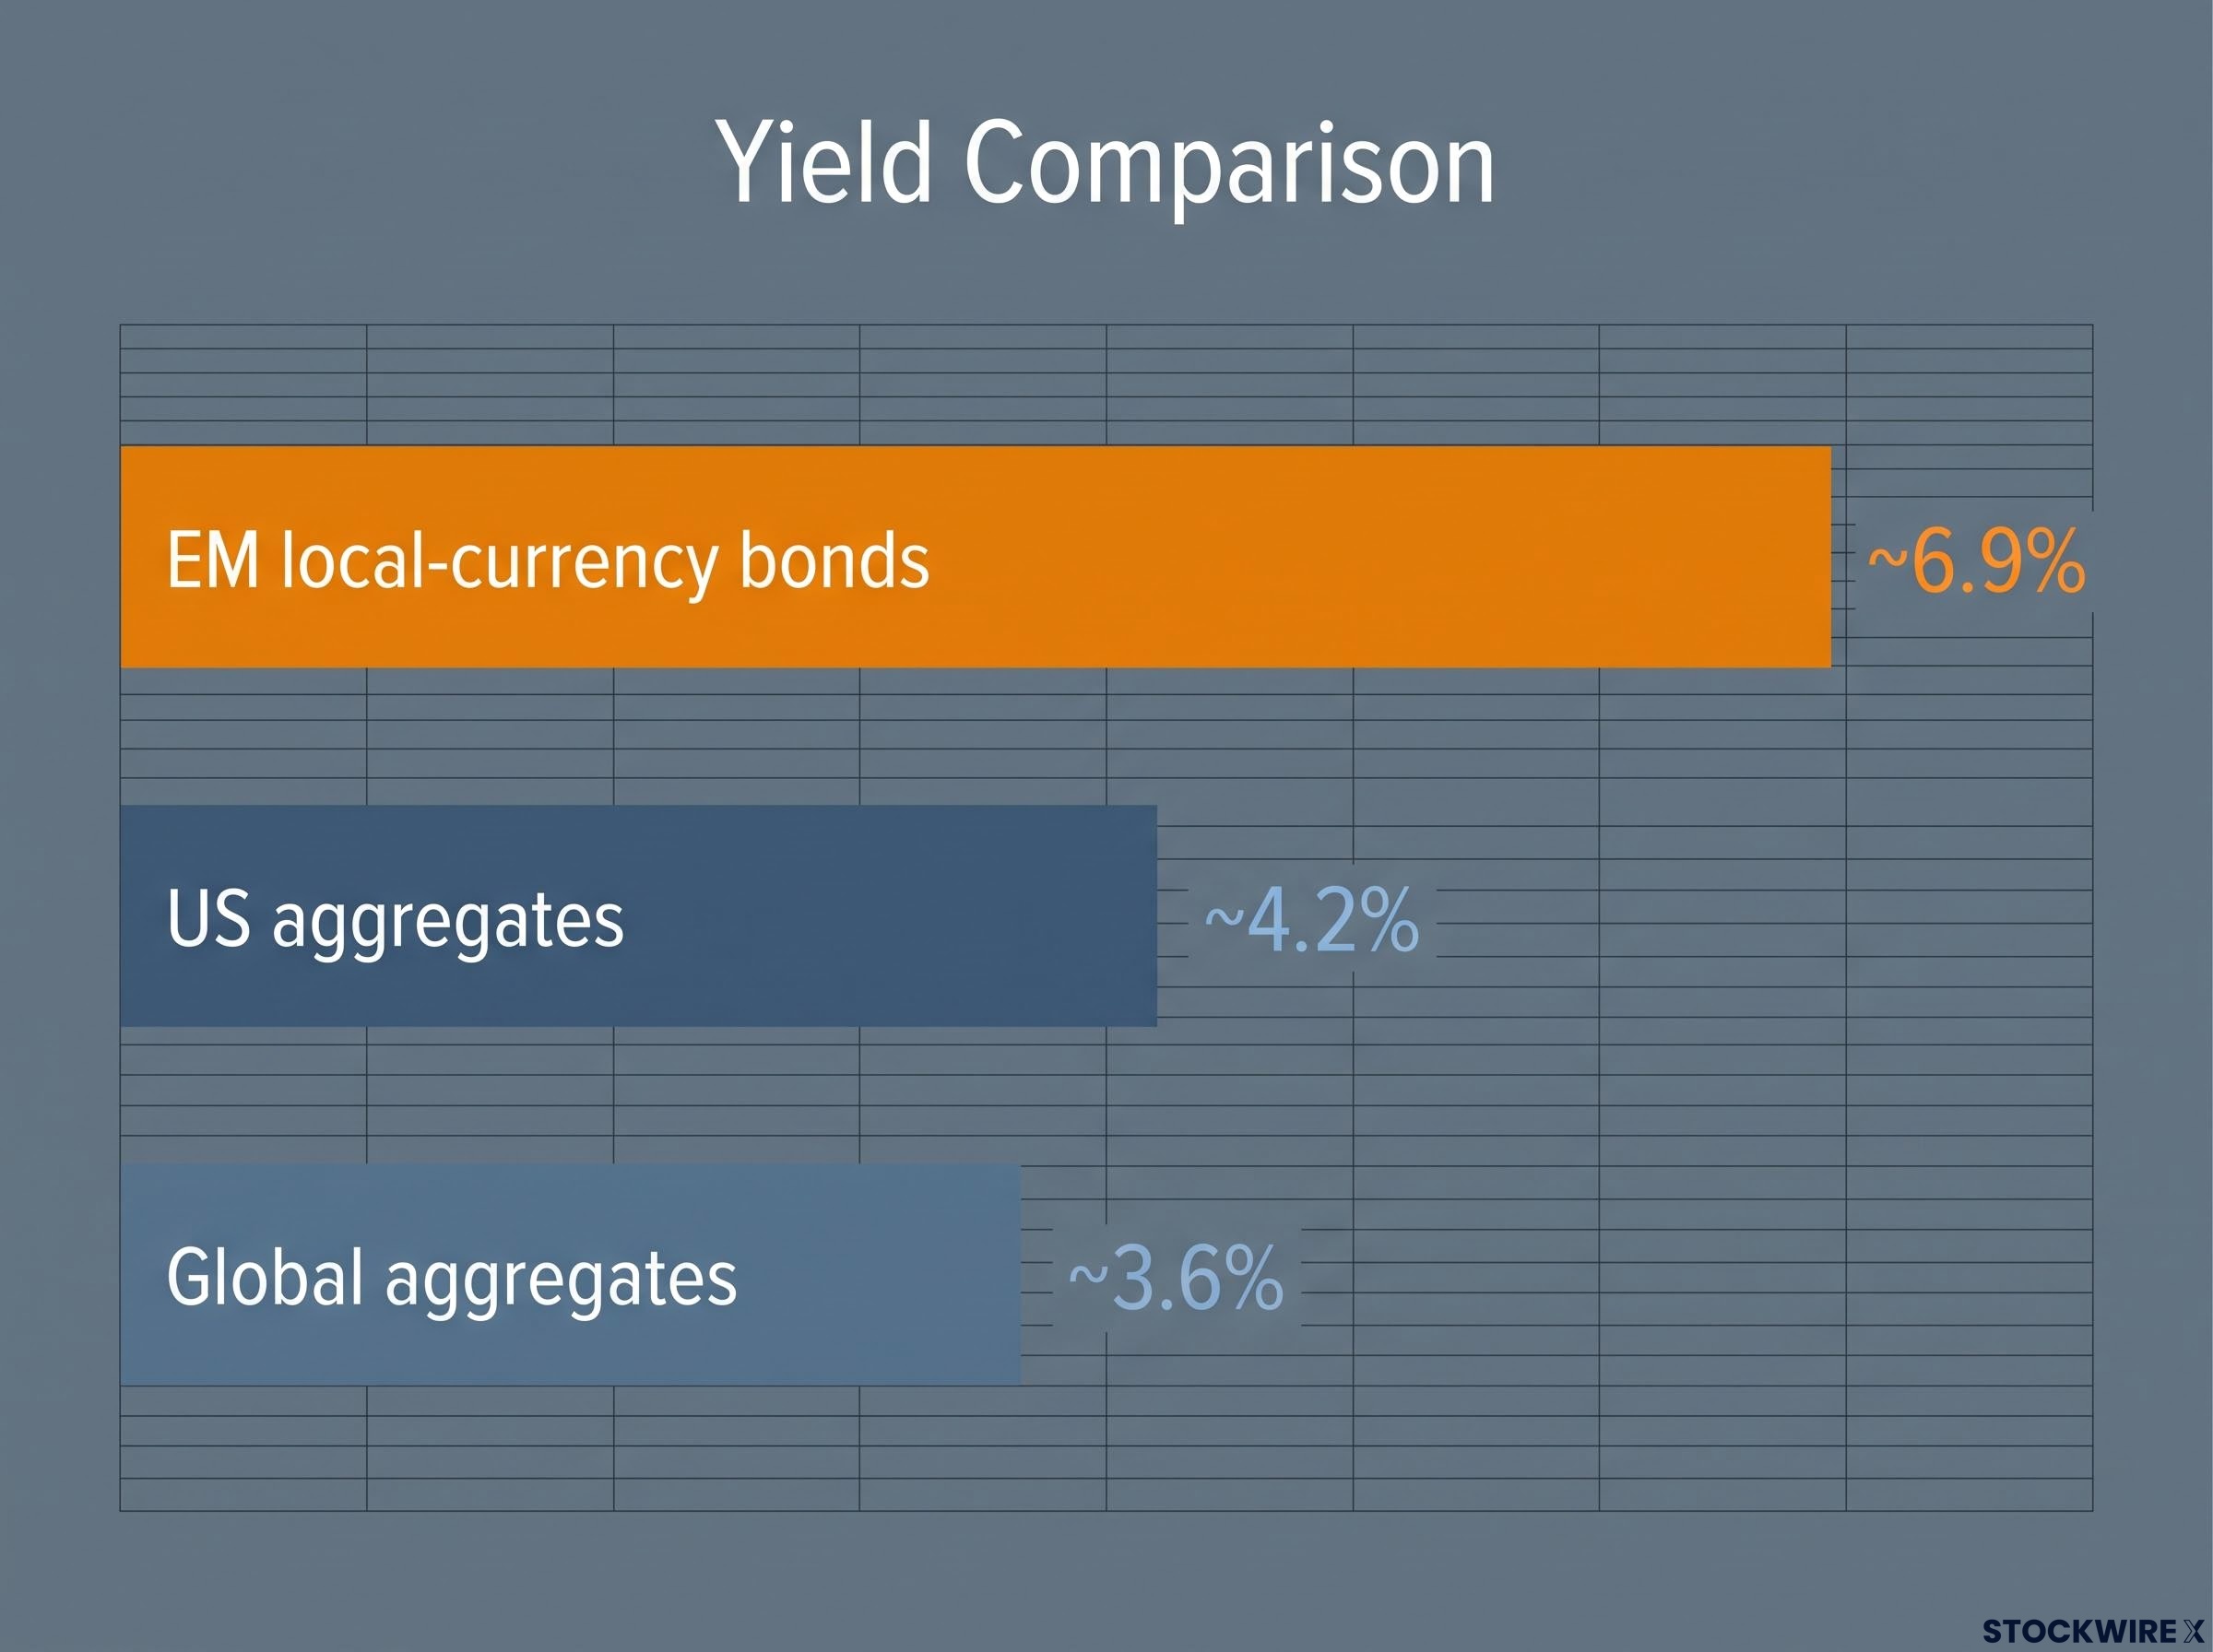
Carry. EM local-currency bonds yield approximately 6.9% versus roughly 3.6% for global aggregates and approximately 4.2% for US aggregates (these yield comparisons are drawn from research estimates and have not been independently confirmed at the time of writing). That carry cushion compounds the currency effect when the dollar is soft and provides a return floor even when FX moves are modest.
Diversification. Local yield curves and inflation dynamics are increasingly driven by domestic factors rather than US rate dynamics alone. This means EM local-currency bonds are offering improving portfolio diversification benefits at exactly the moment when US-correlated assets are crowded.
Compared with EM equities, this route requires far less reliance on idiosyncratic earnings, governance, and political catalysts. It is the lower-friction expression of the same macro view.
The LatAm commodity trade: conditionally valid, not automatically triggered
Latin American markets, specifically Brazil and Peru, have the highest structural sensitivity to a genuine debasement scenario. Their equity indices carry large weightings in metals, energy, and agriculture. Their current accounts strengthen rapidly when commodity prices rise. Under a true dollar debasement, where commodity prices rip higher alongside broad USD weakness, EM Americas would be the primary beneficiary.
That logic remains structurally sound. It is also currently unconfirmed.
Commodity currency transmission from dollar softness is not mechanical: BNY iFlow data confirmed that the Australian dollar, Brazilian real, and Chilean peso all flipped to net selling within one week of the Fed’s dovish pivot, because the dollar’s decline was a mean-reversion from overcrowded positioning rather than a fundamental repricing of global growth.
The missing ingredient is China-driven demand growth. Without it, easier financial conditions and a weaker dollar have proven insufficient to sustain a commodity bull market. Yu is explicit on this point:
A weaker-dollar view does not automatically translate into stronger commodity prices while US investors remain comfortable with domestic yields and growth prospects.
Silver’s sharp advance through Q1 2026 provided a meaningful tailwind for Peru, while Brazil drew commodity-themed capital over the same period. But the broader pattern has been less supportive. Commodity-linked EM sovereign bonds faced accelerated selling after recent Fed decisions, even as the dollar softened, because Treasury curve steepening offset the benefit. That is the clearest signal that the transmission from dollar softness to LatAm outperformance is not automatic.
Before scaling LatAm commodity exposure, investors should require confirmation from multiple signals:
- Commodity price strength across specific metals and energy, sustained rather than episodic
- China demand indicators firming, particularly industrial metals consumption and import volumes
- Current account trajectory improving for Brazil and Peru, confirming that commodity revenues are translating into macro strength
The commodity-levered LatAm position is a high-beta, conditional expression of a stronger debasement view. It deserves a place in the framework as a satellite, sized to commodity price signals rather than to the USD move alone.
A practical framework for positioning around dollar risk without the blunt-instrument mistake
The argument across the preceding sections points to a four-tier positioning structure. Each tier carries a different level of signal confirmation, and that confirmation level determines the appropriate size.
- Core: EM local-currency bonds as the primary dollar-hedge expression
- Selective: EM equity exposure tied to local catalysts and bottom-up rationale
- Tactical satellite: LatAm commodity trades as conditional, high-beta expressions
- Calibration assumption: US de-risking flows reaching EM will be limited and targeted
“Selective” means something specific for EM equities. It means the position requires a bottom-up rationale, including policy environment, structural reforms, earnings trajectory, and valuation, rather than the currency cycle doing the work. Poland, South Africa, and Turkey illustrate what this looks like in practice: each attracted strong targeted buying in 2025 and into 2026 because of local stories, not because investors ran a “buy EM on a weak dollar” screen.
US equity diversification flows will concentrate in instruments with clear yield, quality, or thematic advantages. The broad EM equity index is not the default destination.
For investors wanting to understand why selective EM equity positions have worked in 2026 despite the index-level divergence, our full explainer on EM equity outperformance examines the four structural forces Morningstar identifies as driving the MSCI EM Index’s 38% twelve-month return.
| Positioning tier | Instrument / market focus | Primary condition required | Risk characterisation |
|---|---|---|---|
| Core | EM local-currency bonds (high real yield, credible central banks) | Continued USD softness or stabilisation | Core position |
| Selective equity | EM EMEA names with local catalysts (Poland, South Africa, Turkey) | Bottom-up earnings, reform, or valuation rationale | Selective, active position |
| Tactical satellite | LatAm commodity plays (Brazil, Peru, Chile) | Commodity price strength + China demand confirmation | High-beta, conditional satellite |
| Calibration | US de-risking flows into EM broadly | Yield, quality, or thematic advantage in target instruments | Limited, targeted allocation assumption |
Dollar weakness creates favourable conditions for specific EM assets. It does not guarantee uniform EM outperformance. The four-tier structure tells you exactly where to place each expression of the dollar-weakness view on your risk spectrum, so you can size each position relative to how confirmed the underlying signal actually is.
What changes the calculus, and what you should be watching now
Three forward-looking variables would shift this analysis materially:
- A genuine debasement dynamic emerging beyond normalisation, visible through sustained commodity repricing and rising inflation expectations
- China demand signals firming enough to validate the commodity bull market that LatAm exposure depends on
- The Fed trajectory softening enough to relieve Treasury curve steepening pressure on commodity-linked EM sovereigns
For investors monitoring China demand indicators as a confirmation signal for the LatAm commodity trade, our dedicated guide to PBoC policy signals examines what the simultaneous fall in Chinese government bond yields below 1.70% and yuan strength to multi-year highs reveals about the domestic stimulus trajectory.
The Fed’s June 2026 hawkish turn illustrated how quickly rate dynamics can offset a dollar-weakness tailwind. Commodity-linked EM sovereign bonds sold off despite a softer dollar, because the curve move overwhelmed the FX benefit. That episode confirms that the carry position in local-currency debt is more resilient to policy surprises than the commodity-linked equity satellite, which is the reason to anchor to the former and size the latter cautiously.
The Fed’s June 2026 FOMC statement confirmed the policy stance that drove the curve steepening episode, with the Committee maintaining its rate range while signalling continued attention to inflation, the combination that pressured commodity-linked EM sovereigns even as the dollar softened through the same period.
The current environment favours EM local-currency debt as a core position precisely because it does not require all three variables to fire simultaneously. Even in a scenario where the dollar stabilises, the carry alone provides a return cushion that EM equity index exposure does not.
The investor’s task from here is monitoring those confirmation signals rather than waiting for a clear macro narrative to form before acting. A framework designed to be updated by data, rather than abandoned when the first contradictory signal appears, is worth more than a single directional call.
This article is for informational purposes only and should not be considered financial advice. Investors should conduct their own research and consult with financial professionals before making investment decisions. Past performance does not guarantee future results. Financial projections are subject to market conditions and various risk factors.