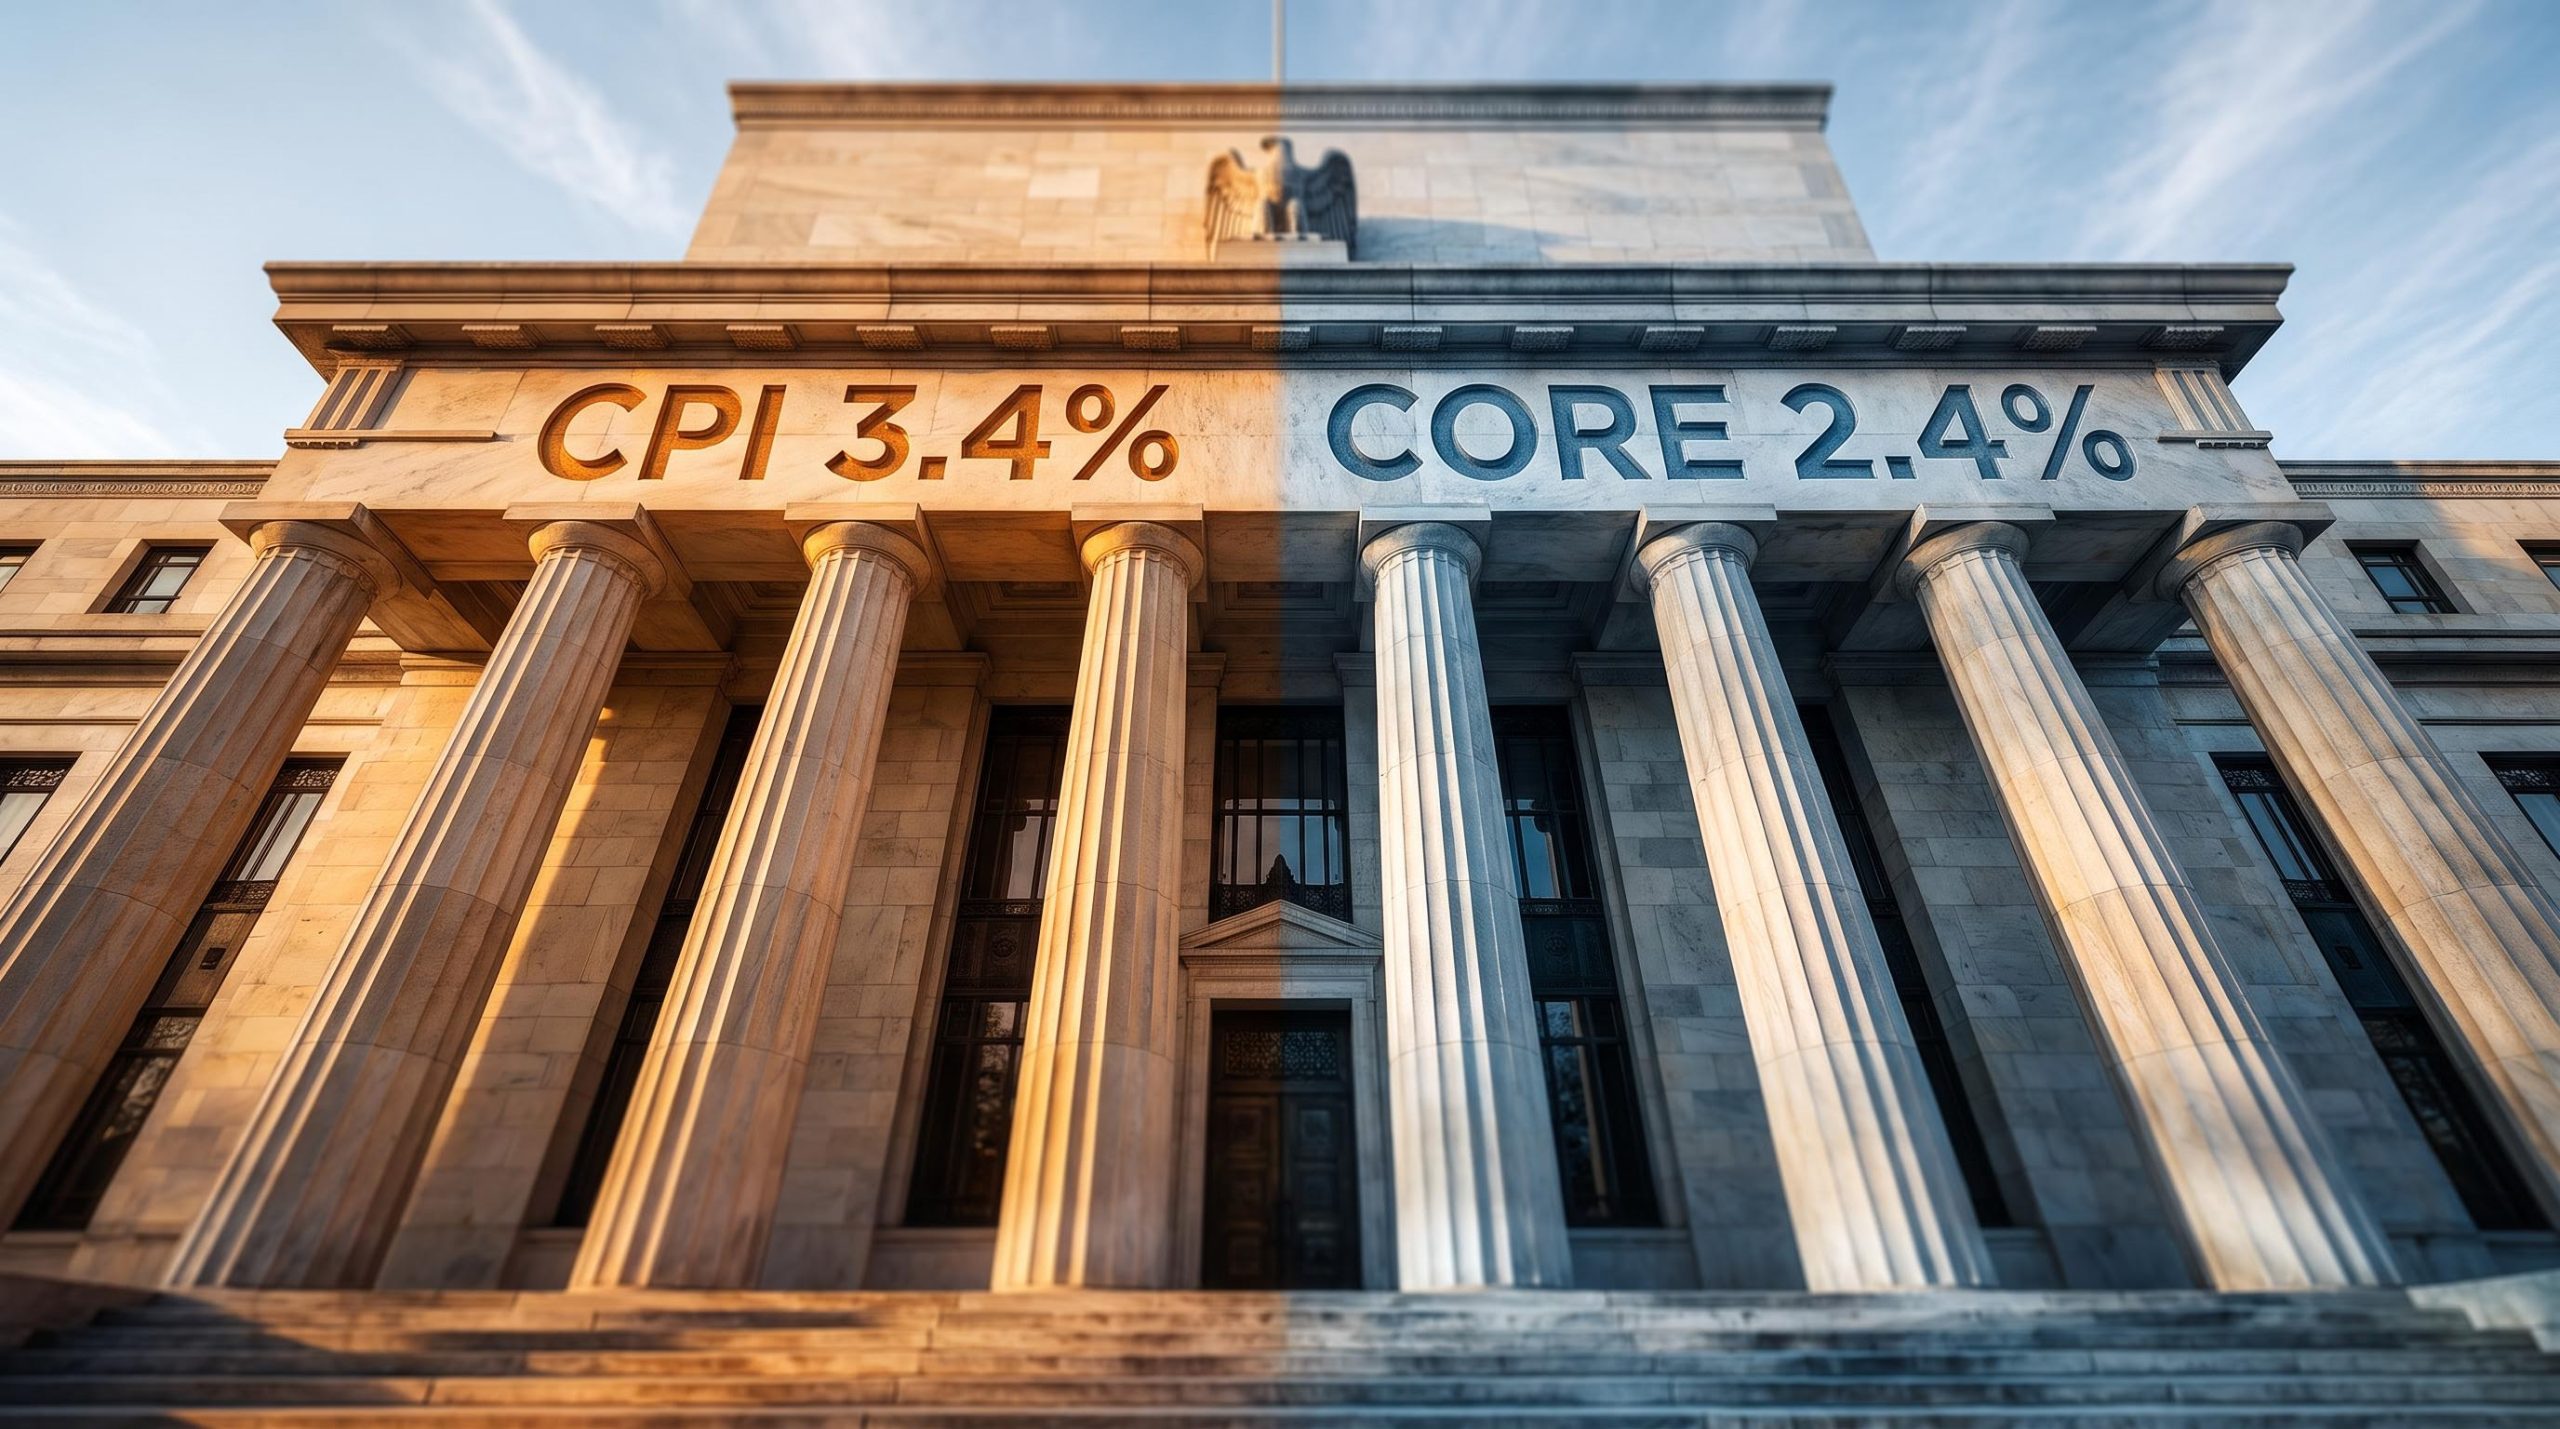
Investors bracing for the Fed’s September 15-16 meeting are watching the same August inflation print and reaching opposite conclusions. Headline CPI came in at 3.4% year-on-year, driven by energy and telecoms. Core CPI, which strips those components out, held at 2.4%. Two numbers, two very different stories about what the Fed should do next.
The disagreement matters because one camp is asking the wrong question. Whether the Fed hikes is less important than whether a hike would actually change anything, and when the drivers of elevated inflation sit outside the reach of interest rate policy, the framing shifts from “will the Fed hike?” to “can markets absorb one if it does?”
Two economies have already run that experiment in 2026. Australia and Europe give a cleaner answer than any Fed statement, and what follows uses them as the empirical baseline for a data-backed way to think about rate decisions rather than react to headlines. You will leave with a concrete evaluative framework, not a prediction.
Why the Fed’s tools do not reach the inflation driving August’s numbers
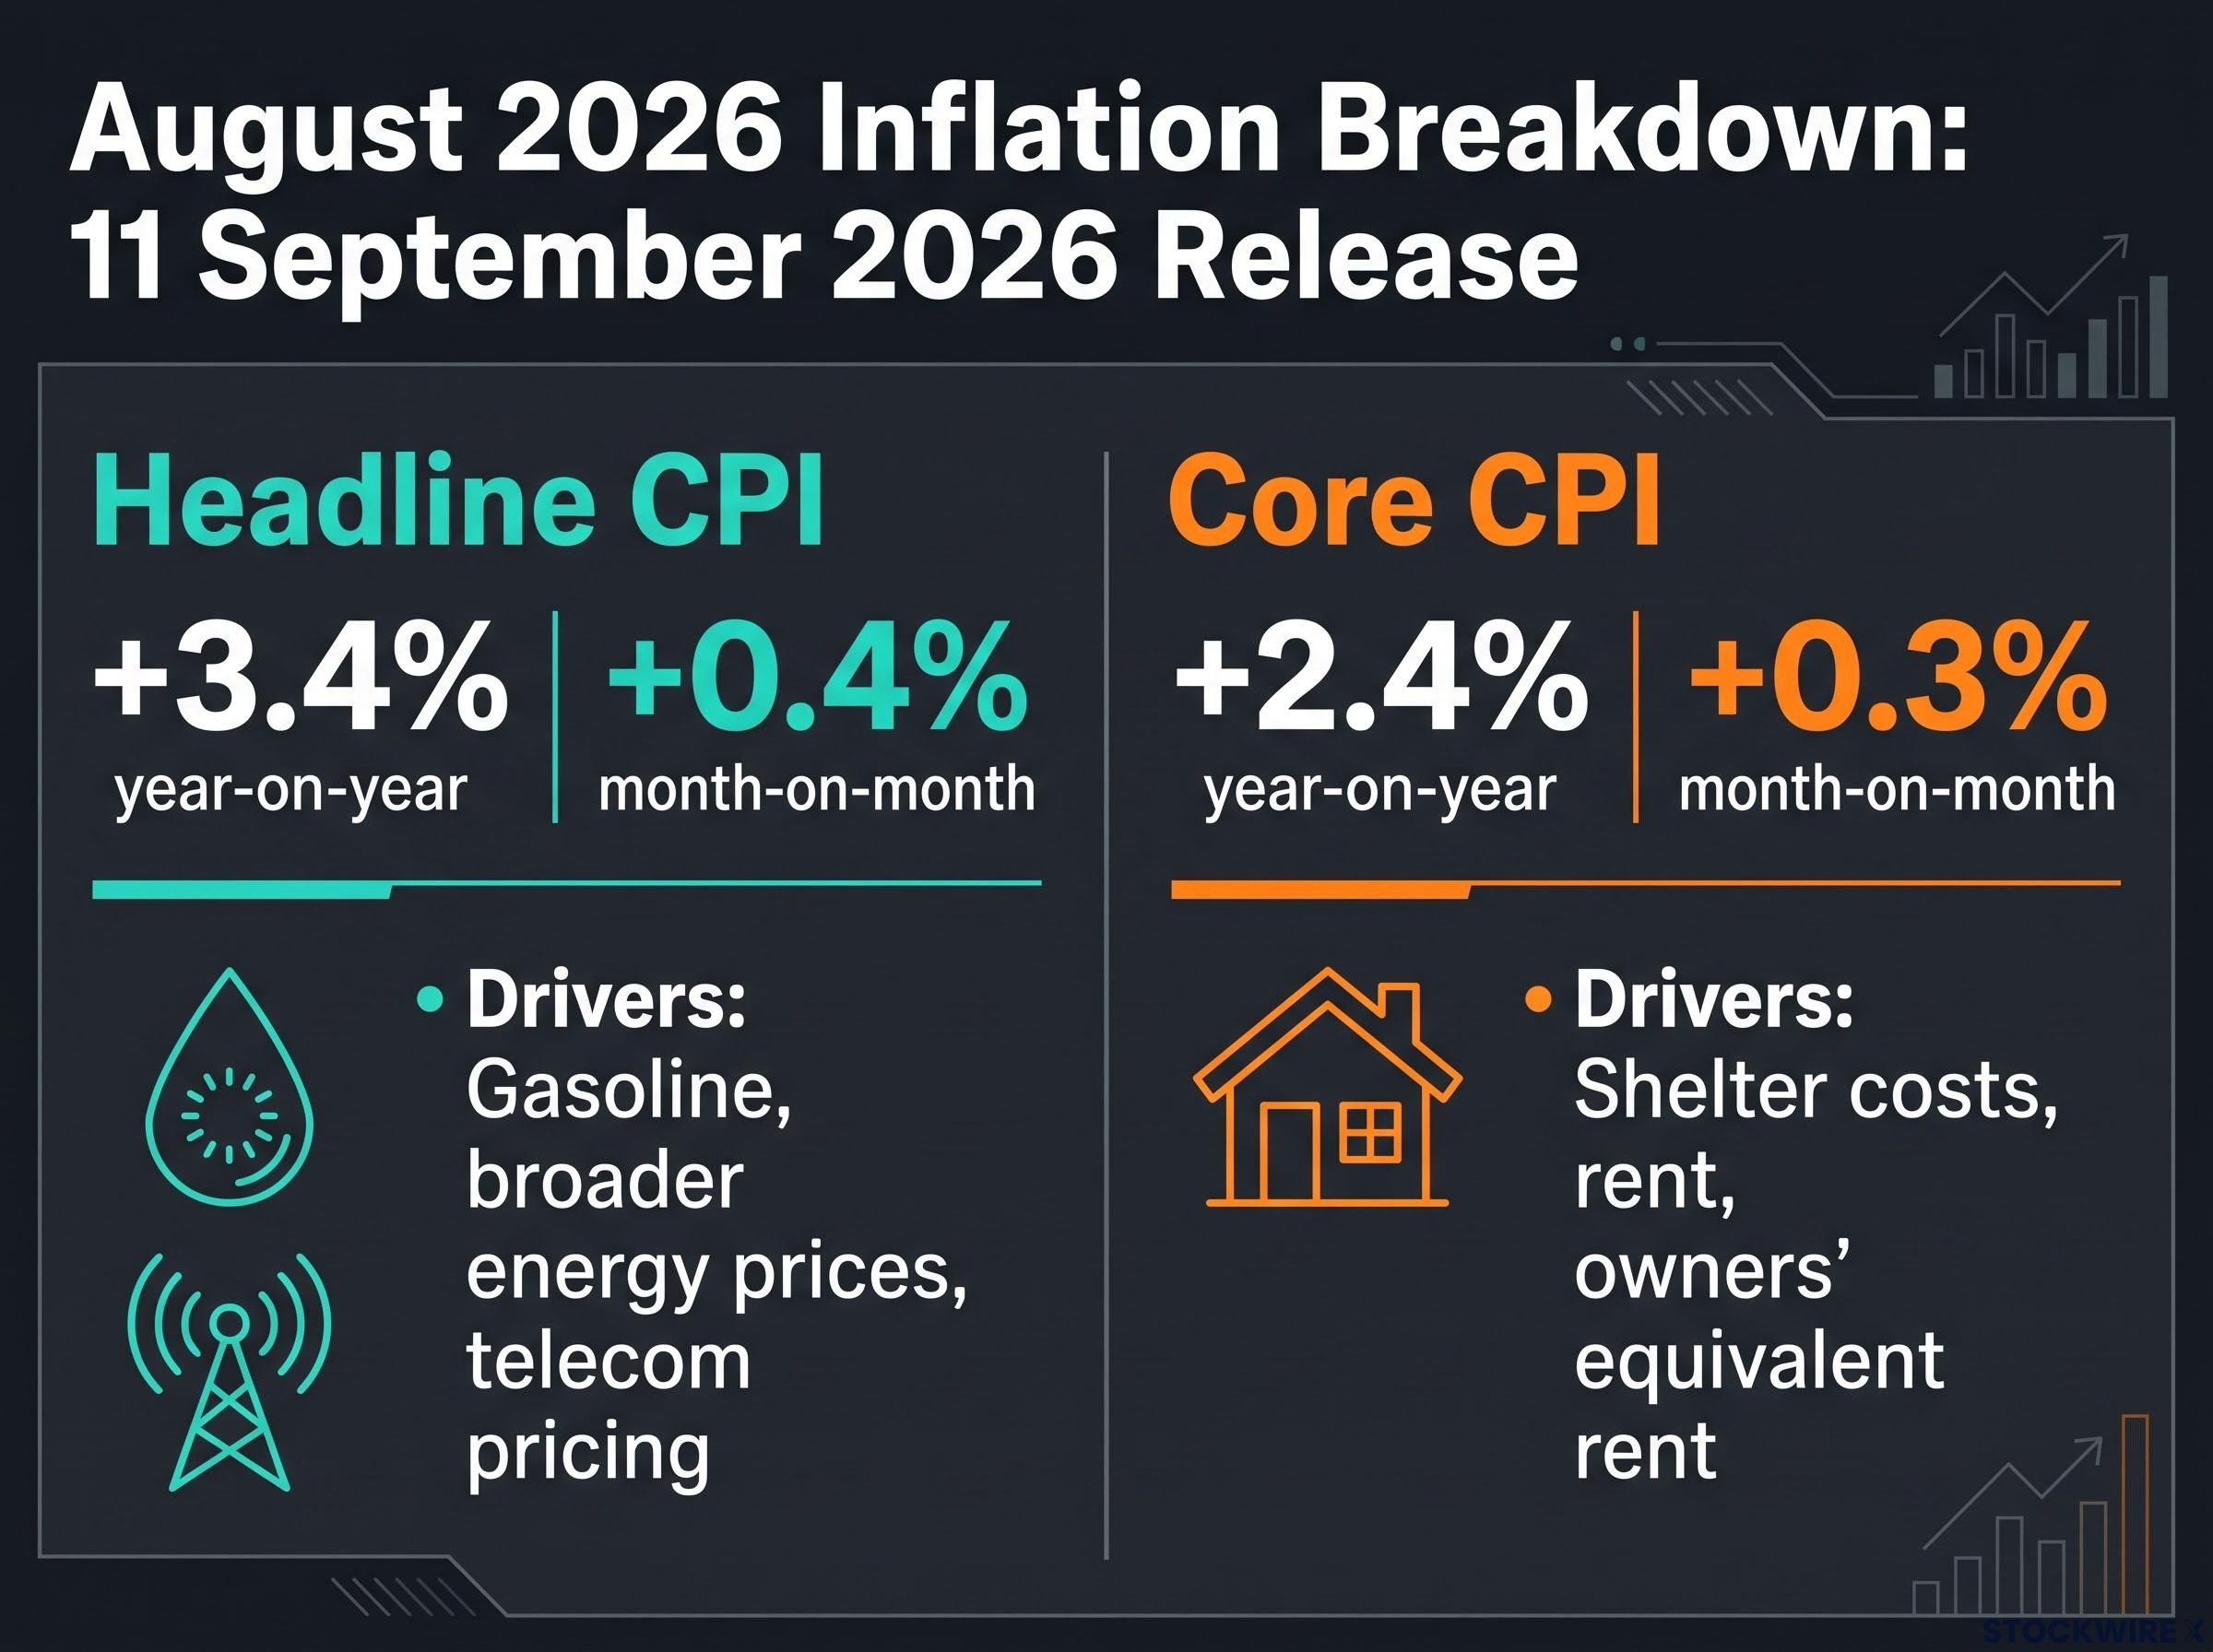
Start with what the numbers actually contain. According to the Bureau of Labor Statistics release published on 11 September 2026, headline CPI rose 0.4% month-on-month and 3.4% year-on-year, while core CPI (all items excluding food and energy) rose 0.3% on the month and 2.4% on the year.
The gap between those two figures is the whole story. Here is what the August print breaks down to:
The May 2026 report offered an earlier instance of the same diagnostic challenge: a supply-driven inflation spike where headline CPI hit 4.2% while core held at 2.9%, confirming that the headline number was geopolitical in origin rather than a sign of economy-wide demand excess.
- Headline CPI (+3.4% year-on-year): accelerated primarily on rising gasoline and broader energy prices, with telecom pricing decisions cited as the other driver.
- Core CPI (+2.4% year-on-year): continued its gradual deceleration, with shelter costs (rent and owners’ equivalent rent) still doing most of the work.
Now consider how a rate hike actually functions. The Fed raises borrowing costs to cool credit demand and spending. That mechanism works on demand-side inflation, the kind that comes from an economy running hot. It has no grip on the price of a barrel of oil or a carrier’s pricing sheet.
That is the transmission gap. The forces pushing headline CPI higher sit on the supply side, and higher short-term rates do not reopen a disrupted oil route or reverse a telecoms price rise.
The Fed’s transmission limits extend well beyond energy and telecoms: the overnight interbank rate it directly controls is several steps removed from the mortgage, business loan, and consumer credit rates that actually shape real economic activity, a structural gap that makes the blunt-instrument critique more than rhetorical.
The Fed knows this. Chair Jerome Powell has repeatedly framed tariff-driven and war-related energy shocks as the kind of pressure central banks generally look through, precisely because they are supply events rather than demand excess. Coverage attributed to Fed officials in late July put it bluntly.
Interest rates “can’t reopen the Strait of Hormuz and get oil flowing again.”
The IMF’s analytical work sharpens the cost of ignoring that distinction. When inflation is supply-driven, its research finds, forcing disinflation through rate hikes comes at a higher output cost, steepens the Phillips curve, and raises the odds of financial stress, because output and employment must be pushed well below potential to hit the target.
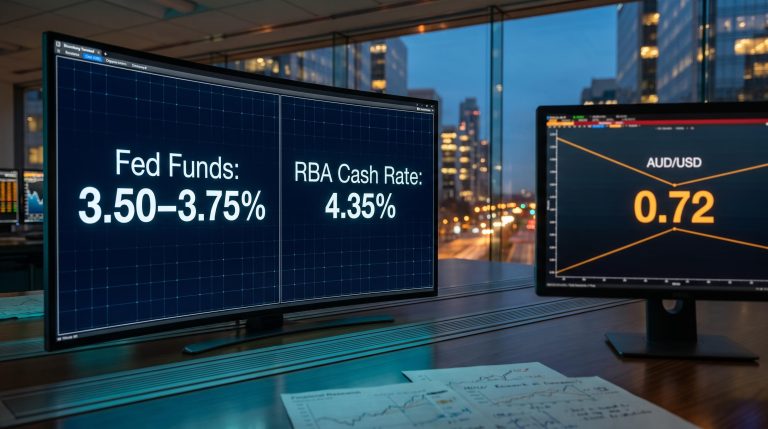
The federal funds target has sat at 3.50-3.75% since the start of 2026. What the August composition tells you is that a hike from here would be a blunt instrument aimed at a problem it cannot fix, which means the risk of it landing on the wrong side of the ledger is higher than the headline 3.4% suggests on its own. If you anchor your reaction to that headline number, you are misreading the signal. Separating supply-side inflation from demand-side inflation is the first move before any portfolio response.
When big ASX news breaks, our subscribers know first
What Australia and Europe’s 2026 tightening cycles actually showed
The useful evidence is recent and measurable. Both the Reserve Bank of Australia (RBA) and the European Central Bank (ECB) tightened into energy-driven inflation during 2026, and both left their equity markets standing.
The RBA delivered three quarter-point hikes early in the year. Starting 3 February 2026, the cash rate moved to 3.85%, then to 4.10% in March, then to 4.35% in May, before a hold in August. Over that stretch, the ASX 200, which hit record highs above 9,200 points in February, gained 1.5% in Australian dollar terms including gross dividends from 3 February to 14 September 2026, and returned roughly 2.4% for the first half of the year. Strong mining and banking earnings, a rotation toward value and income styles, and the market pricing in the eventual pause did the supporting work.
Europe ran a slower version of the same trade. After a February hold, the ECB lifted its deposit facility rate to 2.25% on 11 June (effective 17 June), then to 2.50% on 10 September (effective 16 September), framing the move as a response to an energy shock linked to the war in Iran. The MSCI EMU index appreciated 1.9% in euro terms including net dividends from 11 June to 14 September 2026. During an earlier ECB review window, euro area equities had already risen 4.5%, with financials up 4.9%.
| Central Bank | Hike Path | Yield Curve Status | Equity Market Outcome |
|---|---|---|---|
| RBA (Australia) | +75 bp total, terminal 4.35% | Positive throughout | +1.5% (ASX 200, AUD total return, 3 Feb-14 Sep) |
| ECB (Eurozone) | +50 bp total, deposit rate to 2.50% | Positive throughout | +1.9% (MSCI EMU, EUR net dividends, 11 Jun-14 Sep) |
What links the two outcomes is not investor courage. It is structure. Three features held both markets steady through tightening:
- Positive yield curves throughout. Long rates stayed above short rates, keeping bank lending profitable and credit flowing.
- Incremental, well-telegraphed sizing. Quarter-point moves with clear communication, no surprises to shock valuations.
- Earnings that validated the macro backdrop. Corporate results confirmed the economy could carry the higher rates.
The shared lesson from Sydney to Frankfurt is that the hike itself was not the deciding variable. The deciding variable was whether financial conditions going into the hike were built to absorb it, and that is exactly the thing US investors need to examine now. These are live 2026 experiments with a comparable energy-shock context, which makes them a far better baseline than analogies stretched back to the 1980s or 2004.
Reading the US yield curve and bank lending data correctly
The US financial conditions dashboard looks supportive at first glance. The trap is stopping at first glance.
Yield curve steepening: what the signal is, and what it is not
A positively sloped curve, where long-term yields sit above short-term rates, is genuinely good for the credit engine. Banks borrow short and lend long, so a steeper curve widens their margins and gives them a reason to keep extending loans even as the Fed holds short rates high. That supports economic activity.
The recent readings look constructive. The 10-year Treasury yield climbed from roughly 4.93% on 11 September to about 5.01% on 14 September, touching an intraday high of 5.041% during the 15 September session.
As of 14 September 2026, the spread between the 10-year Treasury and the fed funds target upper bound reached its steepest level in four years, based on historical data going back to January 1971.
Here is where the interpretation forks. A steep curve can mean two very different things:
Yield curve steepening loosens credit supply rather than tightening it, because wider term spreads improve bank net interest margins and make originating new loans more economically attractive, which is why the direction of the steepen matters as much as its magnitude when assessing whether conditions can absorb a hike.
- Bear steepening: long-end real yields rise on growth confidence. This is the reading that supports the “markets can absorb a hike” thesis, though it also pressures high valuations.
- Bull steepening: short-end yields fall because markets are pricing anticipated Fed cuts. This signals recession concern, not resilience.
That distinction is not academic. Most US recessions since 1955 were preceded by bear flattening followed by bull steepening, with the downturn arriving as the curve un-inverts. The 2006-07 steepening is the cautionary counterexample: it ran alongside strong risk appetite and still preceded the financial crisis. So the curve is only constructive for the absorb-a-hike case if growth confidence, not recession pricing, is powering it. Skip that check and you are reading a supportive-looking dashboard without asking what is driving the numbers.
Bank lending growth: reading the pace correctly
The credit data adds a complementary signal, with a caveat. The Federal Reserve Bank of St. Louis reported bank lending expanding at 7.3% year-on-year through 2 September 2026, near its fastest pace in over three years. The Fed’s own July Monetary Policy Report shows a lower figure, roughly 5.5% annualised across the first half of 2026, the gap reflecting differences in scope and timing. Either way, growth is real. But strong loan growth late in a tightening cycle can reflect lagged effects of earlier accommodation and fresh risk-taking rather than durable demand, so treat robust lending as encouraging rather than conclusive.
A framework for evaluating rate decisions without reacting to headlines
Pull the evidence together and it resolves into a repeatable tool. Rather than predicting the September decision, you can assess whether conditions favour absorption or disruption using three variables:
- Inflation composition: is elevated inflation supply-driven or demand-driven?
- Yield curve character: is the steepening bear (growth confidence) or bull (recession pricing)?
- Credit conditions: is bank lending growing from durable demand or from lagged risk-taking?
Each variable has a favourable and an unfavourable reading.
| Framework Variable | Conditions Favouring Absorption | Conditions Signalling Disruption |
|---|---|---|
| Inflation Composition | Demand-driven, core disinflating | Supply-driven headline, sticky core |
| Yield Curve Character | Bear steepening on growth confidence | Bull steepening on recession pricing |
| Credit Conditions | Lending from durable demand, stable credit | Late-cycle risk-taking, tightening credit |
Strategists are applying versions of this logic now. The UBS Chief Investment Office holds a base case of 25 bp hikes in September and December 2026, describing them as absorbable given solid growth and gradual disinflation. The BlackRock Investment Institute maintains a pro-risk stance contingent on cash-flow durability and higher return hurdles. Fisher Investments has argued editorially that a hike would be a policy misstep, though not catastrophic for markets. Behind these views sit the same historical reference points: the early-1980s Volcker cycle, the gradual 2004-2006 tightening, and the post-2015 normalisation.
One caution on the international benchmarks. The RBA and ECB experiences are useful anchors, not templates, because the US market carries higher valuations, heavier technology-sector concentration, and a distinct fiscal trajectory. What this framework gives you is a way to evaluate any central bank rate decision, not just this one, by focusing on structural conditions rather than the headline rate move. That is what professional investors actually do.
What the evidence actually says about US market resilience ahead of the decision
Weigh it all and the picture is clearer than the headlines suggest, without being resolved. August’s inflation spike is largely supply-driven and outside the Fed’s direct corrective reach. The yield curve and bank lending data are constructive but carry dual readings. The RBA and ECB precedents favour absorption under the right structural conditions.
What stays unresolved is the meeting itself. Whether 15-16 September produces a hike from the current 3.50-3.75% range or a hold is not knowable in advance, and the Fed’s forward communication on the terminal rate matters as much as the decision.
The current readings, as of 14-15 September, line up like this:
- Inflation composition: core at 2.4% and still decelerating is the policy-relevant signal, favouring absorption.
- Yield curve character: steepest in four years, constructive only if growth confidence, not recession pricing, is driving it.
- Credit conditions: lending growth of 5.5% to 7.3% is healthy, with the late-cycle caveat still open.
The evidence does not tell you what to do. It tells you what to look at, and that distinction is what separates informed positioning from headline-driven noise. You now have a concrete basis for forming your own view instead of deferring to competing forecasts.
This article is for informational purposes only and should not be considered financial advice. Investors should conduct their own research and consult with financial professionals before making investment decisions.
Past performance does not guarantee future results, and forward-looking statements about rate paths and market outcomes are speculative and subject to change based on market developments.
Three variables to watch before the Fed’s next move
The framework does not expire on 16 September. It updates with each new data release, which turns every print into an input rather than a fresh source of anxiety. From today forward, track three things:
- CPI composition split. Watch the core versus headline gap and what is driving each. A widening supply-driven headline with sticky core is the disruption signal; continued core deceleration is the absorption signal.
- Yield curve character. Watch the 10-year minus fed funds spread and identify whether steepening is bear (growth-led) or bull (cut-led). The driver, not the slope, is what matters.
- Bank lending pace and quality. Watch the growth rate against the Fed’s Monetary Policy Report benchmark, and stay alert to late-cycle risk-taking dressed up as durable demand.
The next inflation releases and Fed communications will be the first tests of where these readings sit.
For readers wanting to track how the supply-driven spike evolves month to month, our full explainer on inflation trajectory signals examines what the energy reversal, real disposable income data, and consumer inflation expectations from June tell investors about the conditions under which a sustained spiral becomes plausible.
The structural conditions, not the rate decision itself, determine the market outcome. Track the three and you are equipped to read every future meeting, not just this one.