#
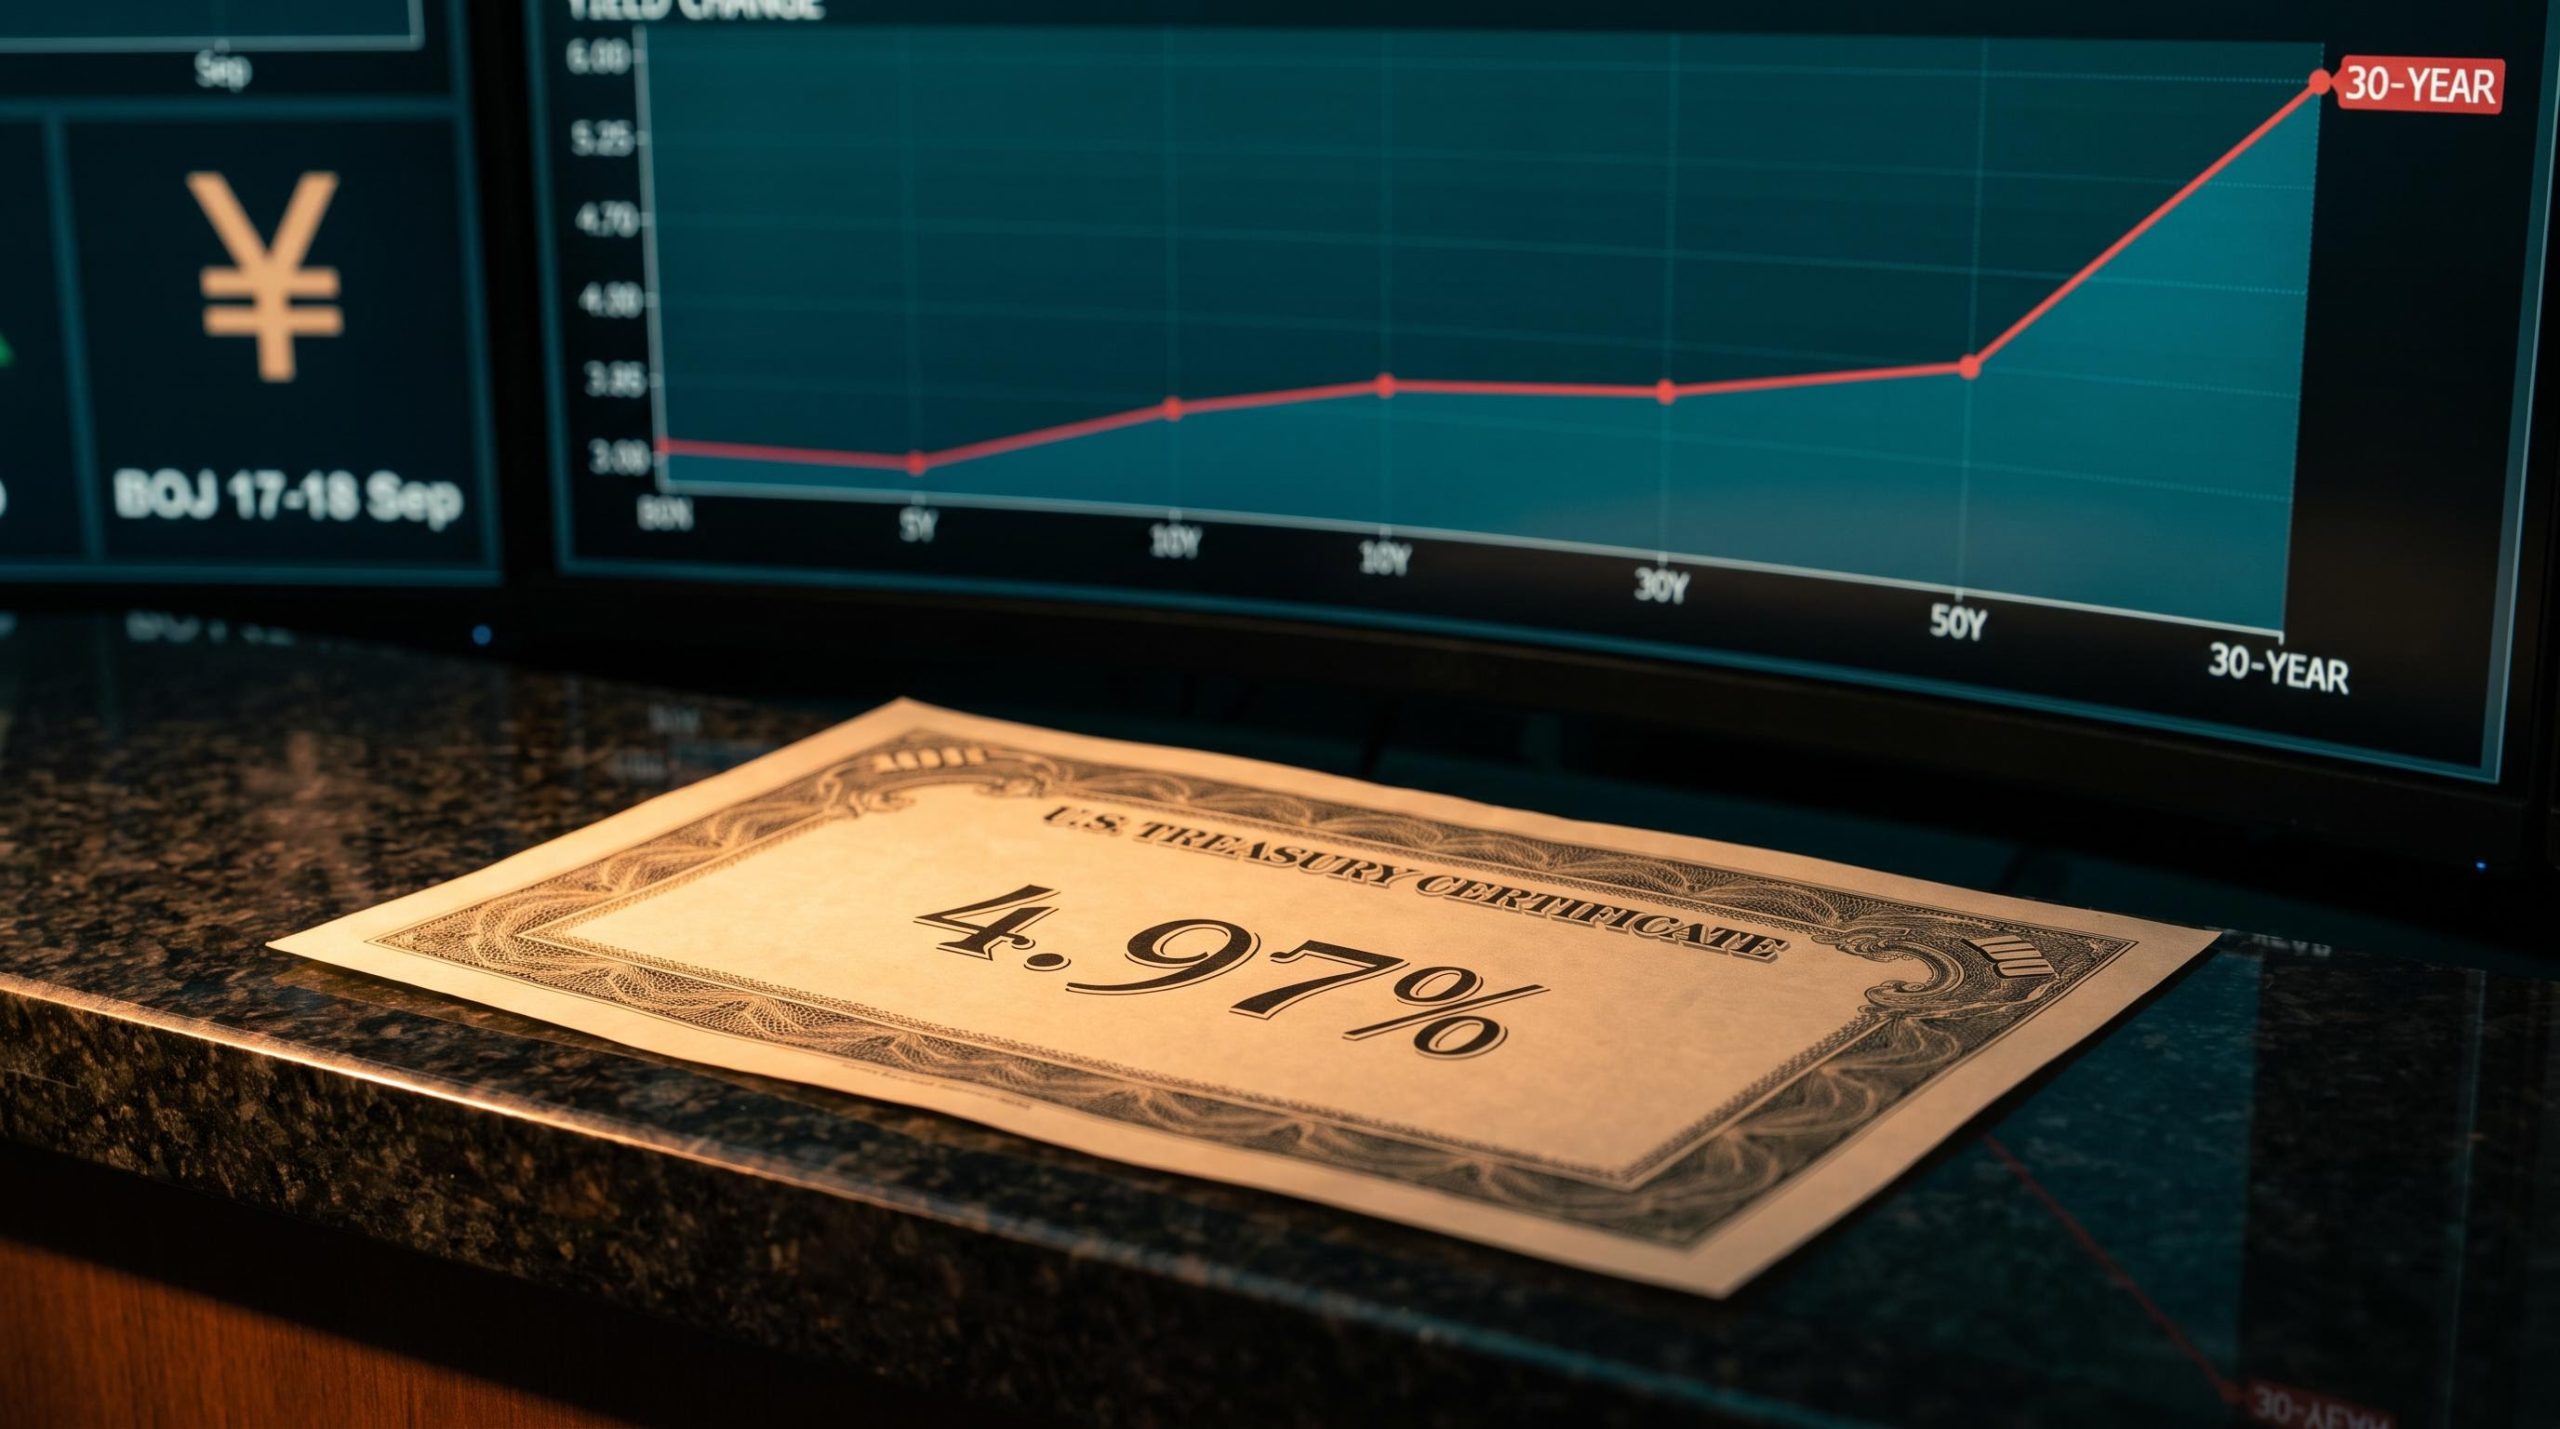
The 10-year US Treasury yield hit 4.97% on 11 September 2026, its highest level since October 2023, while markets priced an 86% probability that the Federal Reserve would raise rates within days.
That single number captures a shift underway across the global economy right now. US yields are surging on inflation and oil, the Bank of Japan is preparing its own hike on 17-18 September 2026, UK GDP is quietly outperforming, and US consumer sentiment has slumped to its second-lowest reading on record. This is not one central bank acting alone. It is synchronised global monetary policy tightening playing out against sharply divergent local conditions, and that combination is what makes this week’s macro picture so unusually complex.
Here is what these simultaneous moves mean for your portfolio, your borrowing costs, and the volatility you are watching unfold. This piece breaks down what is pushing yields higher, how tightening actually reaches your finances, why Japan matters more than most investors assume, and what history says about cycles like this one.
What is driving sovereign yields to multi-year highs right now
Start with the headline: 4.97% on the 10-year Treasury on 11 September 2026, up 0.27 percentage points in a month and 0.90 percentage points higher than a year earlier. FRED constant-maturity data logged 4.95% the day before, and earlier in the week the benchmark touched an intraday high of 4.8568%, its strongest since November 2023 by Reuters’ reckoning.
Behind that number sit two competing forces, and telling them apart matters for how long yields stay this high.
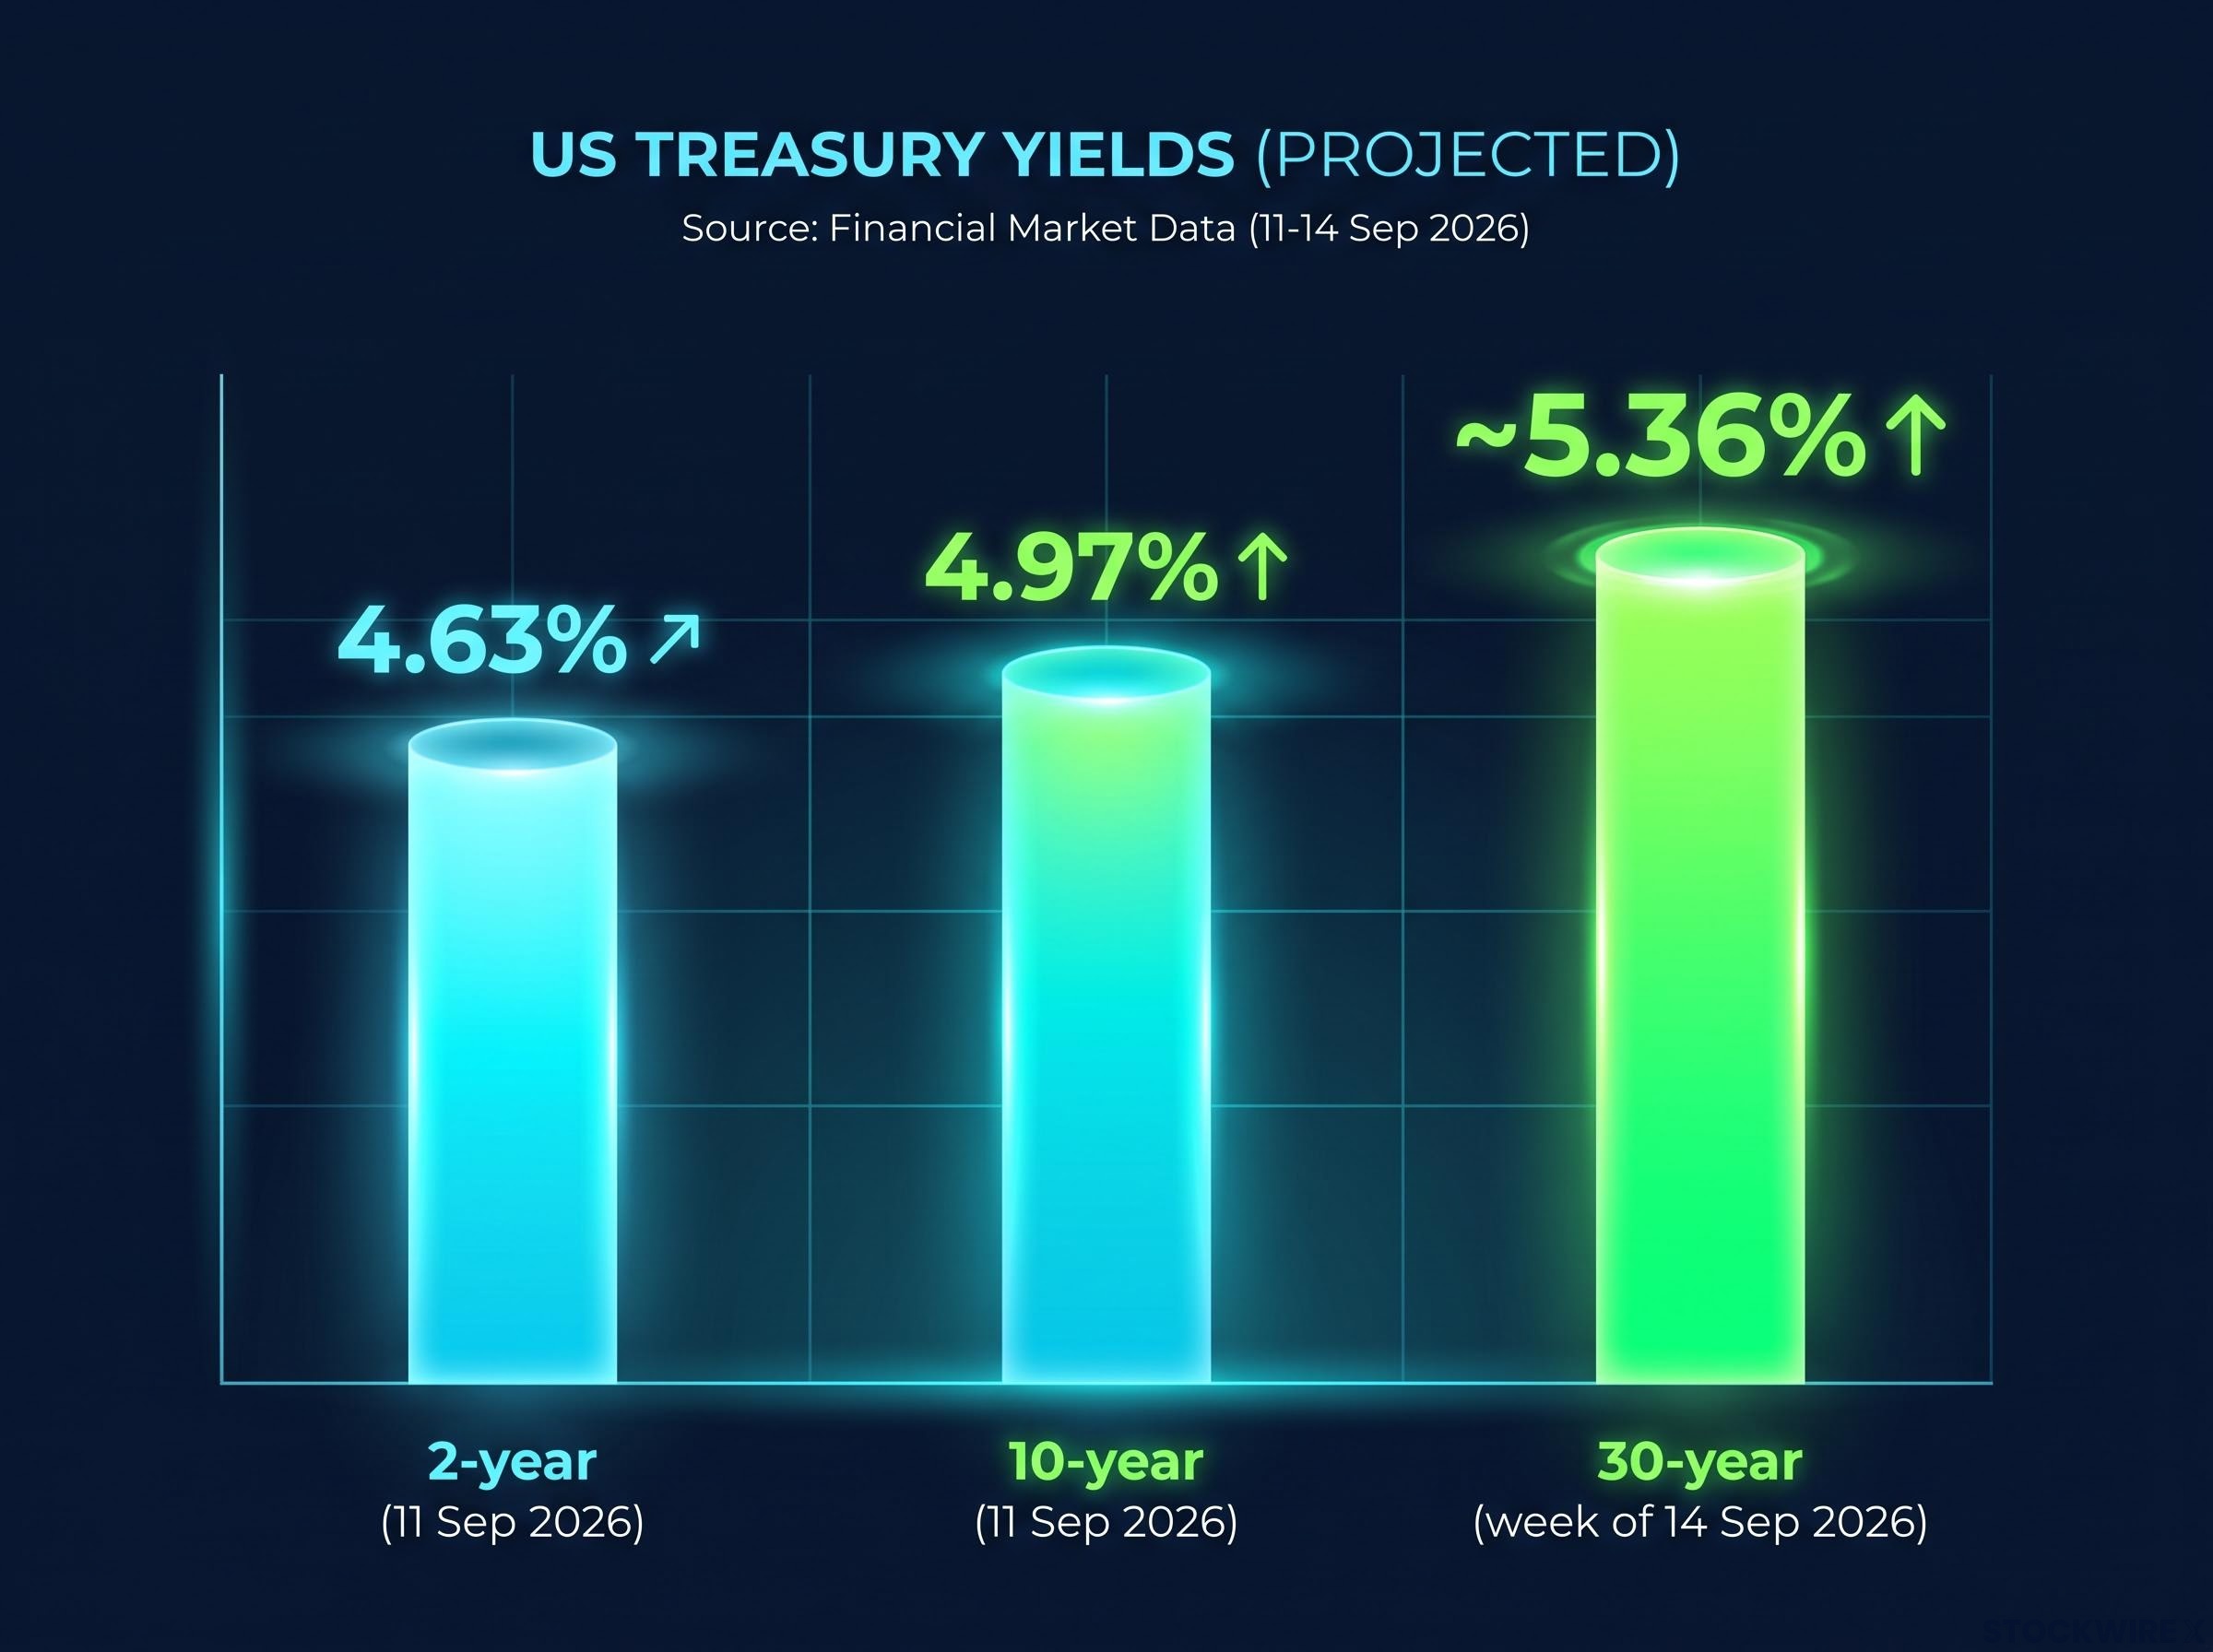
The move is not confined to one point on the curve. The 2-year yield reached 4.63% on 11 September 2026, a level not seen since July 2024, while the 30-year held near 5.36% during the week of 14 September 2026. When compensation rises across the whole curve rather than just the front end, it tells you markets are not only bracing for near-term Fed action. They are demanding more to hold long-dated debt, and that reprices the cost of capital for companies, governments, and households planning years ahead.
Behind the headline numbers, bond yield mechanics explain why the 10-year and 30-year moved together this week: both are repricing inflation expectations and term premium simultaneously, not simply tracking the Fed funds rate.
One caveat on the record-keeping: Trading Economics benchmarks the current 10-year level against an October 2023 prior peak, while Reuters references November 2023. The gap is minor, but it is worth noting the sources do not agree perfectly.
| Maturity | Current yield | Prior-cycle comparison |
|---|---|---|
| 2-year | 4.63% (11 Sep 2026) | Highest since July 2024 |
| 10-year | 4.97% (11 Sep 2026) | Highest since October 2023 |
| 30-year | ~5.36% (week of 14 Sep 2026) | Multi-year high |
Oil, inflation, and the supply overhang
The dominant story in the market is cyclical. According to Trading Economics and CNBC, the surge to 4.97% reflects renewed inflation concerns driven by higher oil prices and geopolitical tension, which pushed traders to lift their bets on a Fed hike. That is the inflation-and-oil channel: hotter conditions, faster repricing.
There is a second engine, distinct from the first. Reuters and AFP flagged a disappointing Treasury auction and broader supply-side dynamics as a significant driver of the move to multi-year highs. When the bond market has to absorb heavy issuance and demand falls short, yields rise regardless of the inflation picture.
Supply-side yield pressure has become a structurally persistent force as the Fed’s share of outstanding public debt has shrunk from roughly 26% in 2021 to around 14% in mid-2026, leaving the bond market itself as the primary price-setter for long-duration money.
Why the distinction matters to you: a yield spike driven by a temporary oil shock can fade, but one driven by structural supply pressure tends to persist. Right now the evidence points to both operating at once, which is precisely why the elevated cost of capital may prove stickier than a single clean narrative would suggest.
When big ASX news breaks, our subscribers know first
How monetary policy tightening actually works, and why the sequence matters
Tightening starts where you live. When a central bank lifts its policy rate, benchmark yields follow, and the cost of everything you borrow, mortgages, car loans, credit card balances, moves up with them. Higher borrowing costs slow household spending and corporate investment. That slowdown is the intended disinflationary effect, not a side effect.
From there the mechanism radiates outward into channels you feel less directly but that shape your portfolio just as much:
- Consumer borrowing costs: Mortgage, auto, and credit card rates climb, cooling housing activity and discretionary spending, with variable-rate borrowers hit hardest.
- Equity discount rates: Higher rates lift the discount applied to future earnings, compressing price-to-earnings multiples. Growth stocks, whose value sits furthest in the future, feel this most.
- Credit market conditions: Rising benchmark yields widen spreads for weaker borrowers, tighten underwriting in direct lending and private credit, and raise stress on leveraged loans funded by short-term money.
- Systemic liquidity risk: Sharp rate jumps can expose duration and liquidity mismatches, where long-dated assets are funded by short-term liabilities, risking forced asset sales.
The data explains why the Fed is moving. US August CPI rose 0.4% month-on-month and 3.4% year-on-year, matching forecasts, while core CPI came in at 0.3% monthly and 2.4% annually. That core annual figure is the lowest since March 2021, yet the monthly core print edged above the 0.2% estimate, enough to shift expectations.
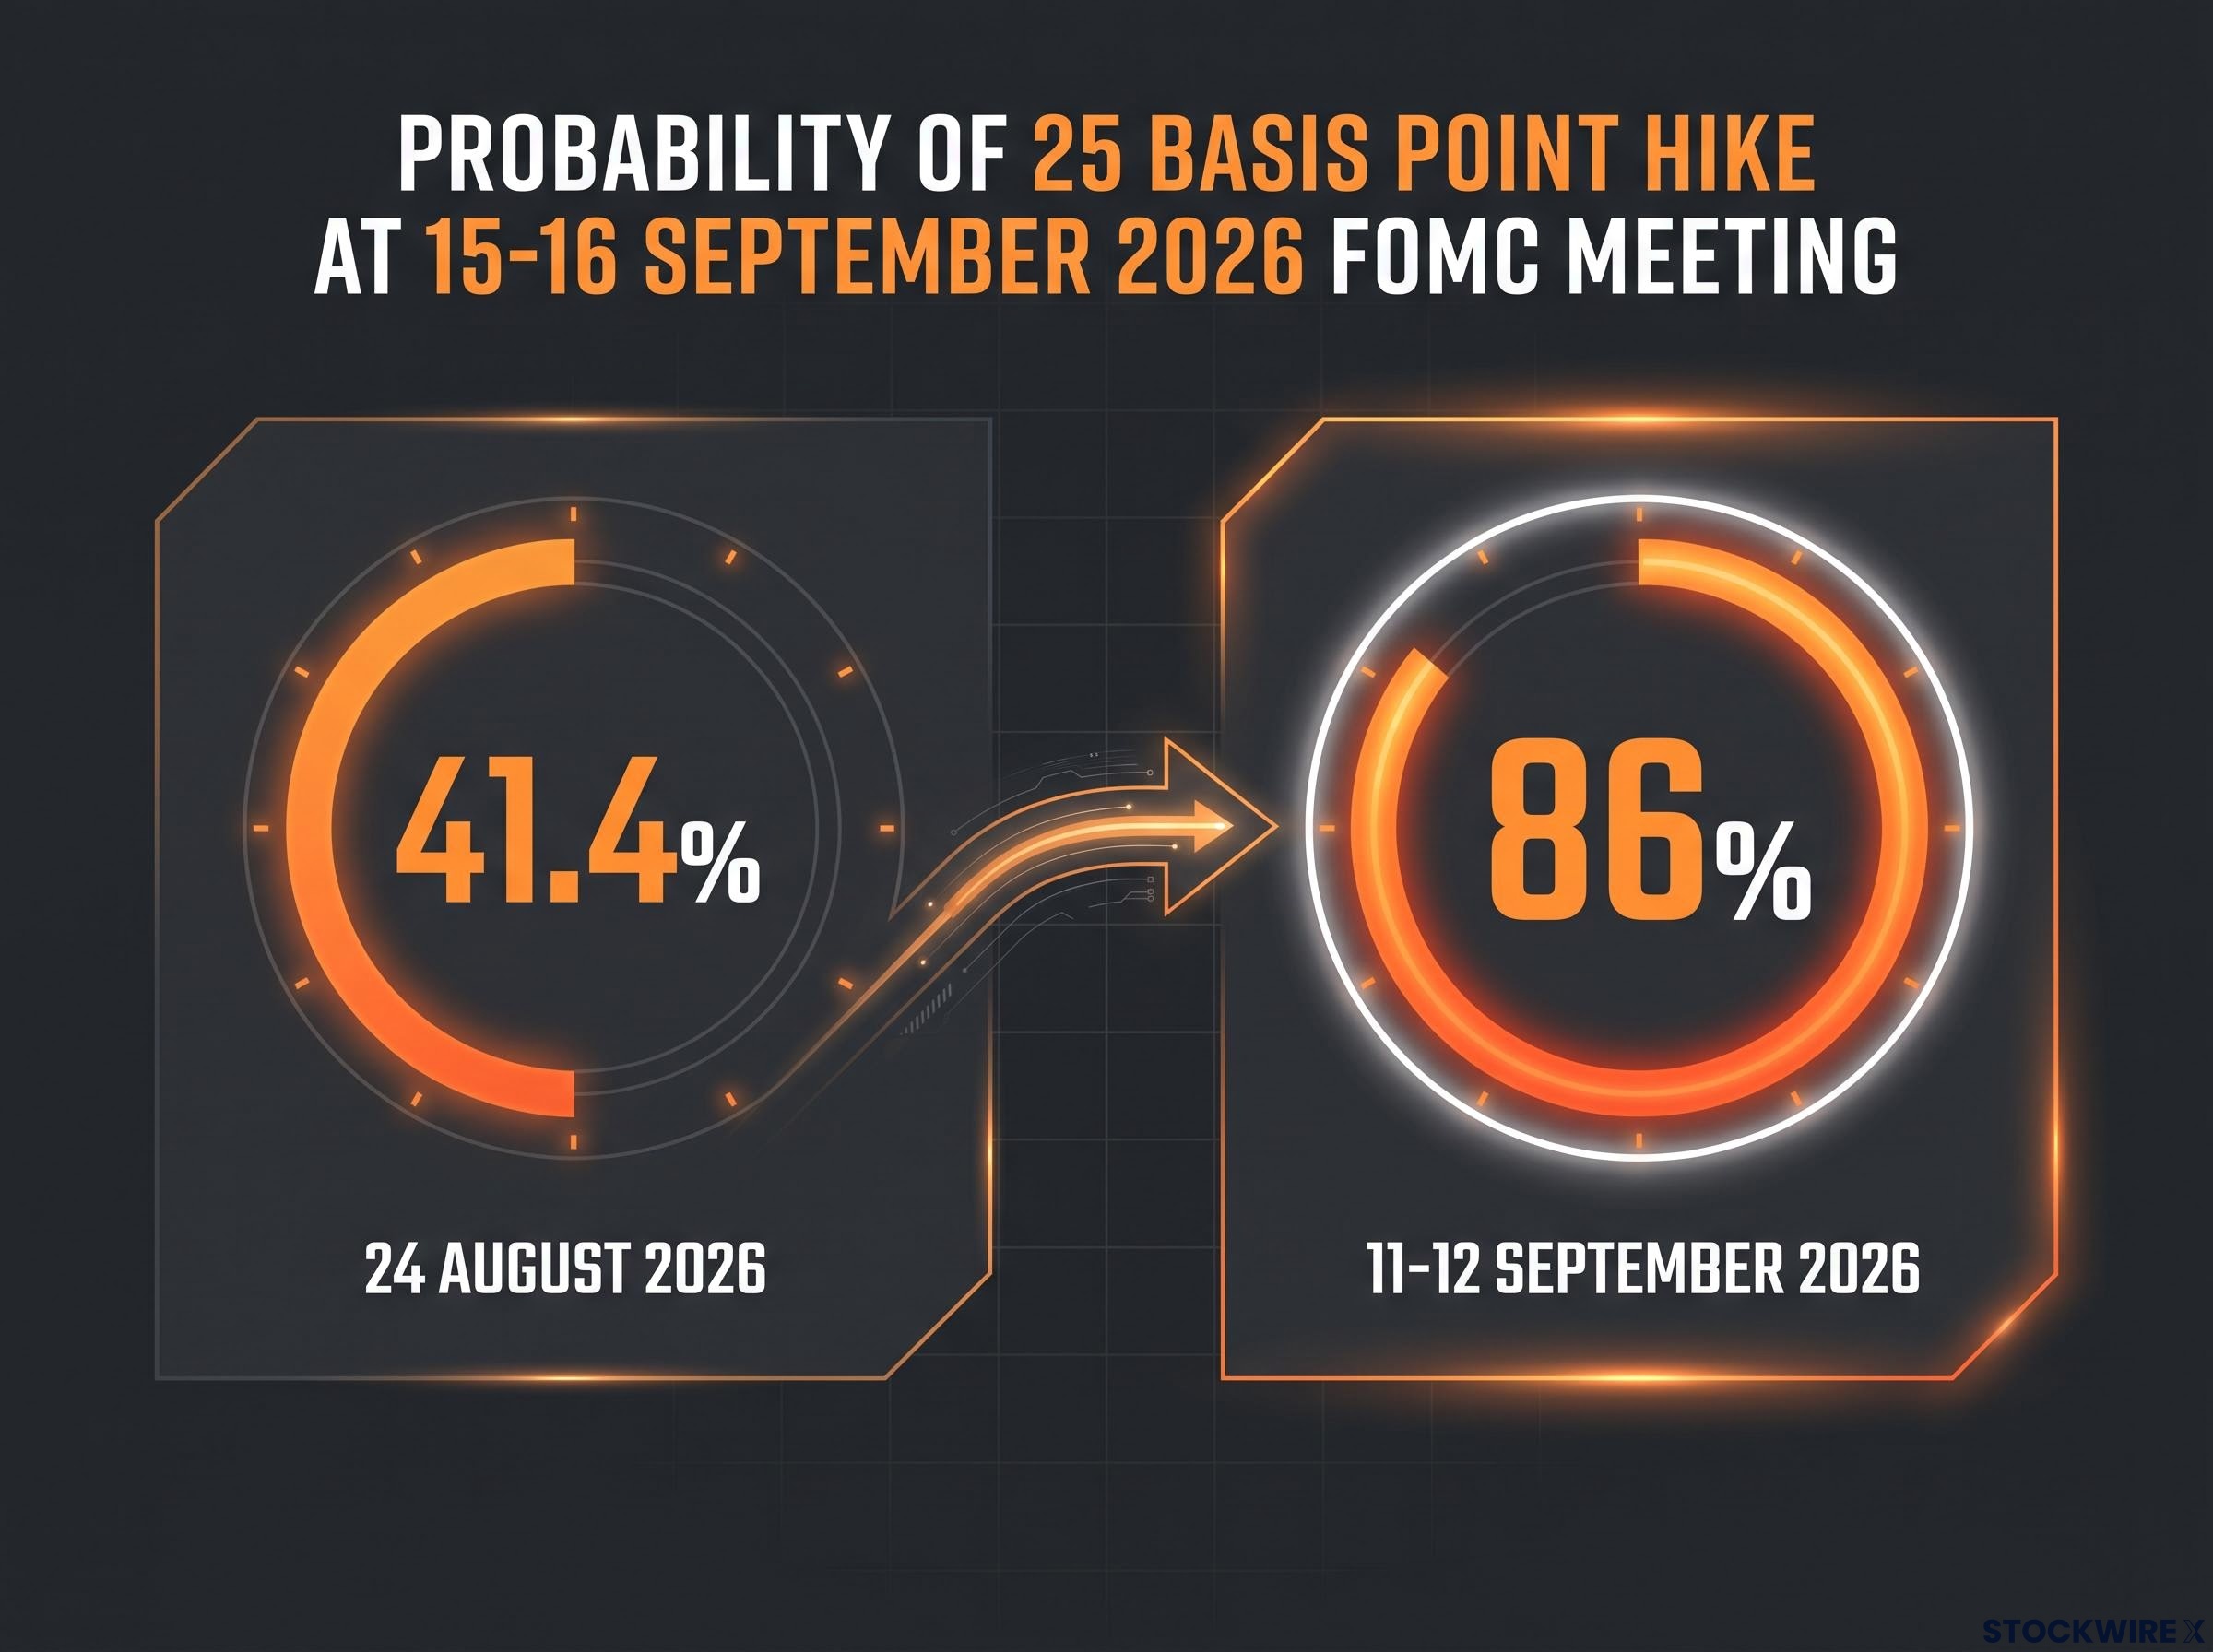
And shift they did. CME FedWatch put the probability of a 25 basis point hike at the 15-16 September 2026 FOMC meeting at roughly 86% as of 11-12 September, with markets pricing two hikes before year-end. Pre-CPI readings sat nearer 60-70%, and an 24 August snapshot showed just 41.4%. The repricing happened in weeks.
Here is the complication. The preliminary September University of Michigan consumer sentiment index fell 7.5% to 47.8, its second-lowest reading on record.
Consumer sentiment: 47.8 The preliminary September 2026 University of Michigan reading is the second-lowest in the survey’s history, down 7.5% in a single month.
That number tells you tightening is already biting at the household level. The Fed is raising rates into an environment where confidence is fragile, which narrows the margin for policy error well below what the calm headline CPI figures would imply. For you, it means the sequencing of effects across equities, credit, and spending makes positioning in this cycle genuinely difficult, because the real economy may be closer to a breaking point than the inflation data alone suggests.
The New York Fed Survey of Consumer Expectations for August 2026 shows households lifting their near-term inflation forecasts alongside rising job-loss anxiety, a combination that helps explain why the University of Michigan sentiment reading landed at its second-lowest level on record even as headline CPI appeared broadly contained.
Japan’s tightening path and what it means for global capital flows
Japan is the piece most investors underweight, and it deserves your attention. The Bank of Japan is expected to lift its policy rate by 25 basis points to 1.25% at its 17-18 September 2026 meeting, with Reuters citing four sources familiar with the bank’s thinking and markets pricing the move almost fully.
The BOJ normalisation cycle gathered pace in June 2026 when the bank raised its overnight call rate to 1.0%, a 31-year high, alongside a structured JGB tapering schedule that signalled sustained withdrawal from ultra-loose policy rather than a one-off adjustment.
This is faster tightening than previously expected, and the reason is a paradox worth understanding.
The BOJ is hiking partly because the yen is weak. A weak yen makes imported goods more expensive, feeding domestic inflation. Japanese wholesale prices rose 7.6% year-on-year in August 2026, above the 7.4% consensus, while yen-denominated import costs jumped 24.8% year-on-year. Takuji Aida, economic adviser to Prime Minister Sanae Takaichi, projects a September hike followed by quarterly increases through January of the following year.
| Date | Expected policy rate |
|---|---|
| September 2026 | 1.25% |
| End-March 2027 | 1.50% |
| Q2 2027 | 1.75% |
That 24.8% jump in import costs is not just a Japan story. It shows how currency dynamics amplify monetary policy transmission across borders, and if you hold international assets or watch global rate differentials, Japan’s normalisation belongs in your thinking.
The carry trade dynamic and why it keeps the yen under pressure
Here is the twist: the BOJ is hiking, yet the yen stays weak. The carry trade explains it. A carry trade involves borrowing in a low-rate currency, the yen, to invest in higher-yielding foreign assets. As long as the gap between Japanese rates and US or European rates stays wide, that trade remains attractive even as Japan’s rates creep up.
Markets expect the Fed and other central banks to hold rates high for longer, keeping the differential wide, which is why yen weakness persists despite BOJ action.
The global consequence is the part that reaches your portfolio. As JGB yields become more competitive, analysts are discussing potential repatriation of Japanese capital from foreign bond markets. If that unfolds, it could soften demand for US Treasuries and European sovereigns at precisely the moment supply is already heavy. That is a second source of upward pressure on global yields, arriving from a direction most investors are not watching.
What history says about synchronised tightening cycles
History here is a calibration tool, not a comfort blanket. Each past episode reveals a specific failure mode you can map onto the present:
- 1994 Fed cycle: Rapid, surprise hikes triggered sharp bond-market losses and stressed leveraged investors even with sound fundamentals. Lesson: communication and gradualism matter independently of the terminal rate.
- 2013 Taper Tantrum: Merely signalling slower asset purchases sent long-term yields jumping and emerging markets selling off, far out of proportion to the actual policy shift.
- 2018-2019 tightening: Cumulative hikes and balance-sheet runoff fed enough equity volatility to force a policy pause before transmission fully worked through.
- Early 1980s Volcker disinflation: Aggressive tightening broke inflation but at the cost of recession, the extreme tail risk if inflation proves more persistent than current data suggests.
The 2013 episode is the one that rhymes most closely with today. It showed that a change in the expectation of policy can move markets as violently as the policy itself.
From 41.4% to 86% in under three weeks The market-implied probability of a September Fed hike jumped from 41.4% on 24 August 2026 to roughly 86% by 12 September, a repricing driven entirely by shifting expectations before a single vote.
That shift is a Taper Tantrum in miniature. It tells you volatility from changing expectations can arrive before any rate actually moves, and the takeaway is a durable one: the transmission of rate expectations into asset prices runs faster than the transmission of real rate changes into the economy. Markets are moving now even though the FOMC has not yet voted, and understanding that lag is your framework for the weeks ahead.
Positioning when rates are moving from multiple directions at once
Treat this as a single system rather than a list of separate events. You are navigating Fed tightening into fragile consumer sentiment, BOJ normalisation reshaping global capital flows, and elevated yields compressing equity multiples, all at once.
The divergence in outcomes is itself a consideration. UK GDP expanded 1.6% year-on-year and 0.4% month-on-month in July 2026, led by services, evidence that tightening has not slowed every developed economy uniformly. Set that against the US consumer sentiment reading of 47.8, the clearest sign of transmission risk to real demand, and the message is that global tightening is not producing uniform results. Geography-specific positioning may matter more this cycle than in previous ones.
The near-term political risk is contained: the White House has indicated it will back the Fed’s upcoming decision, reducing the chance of a sudden policy reversal.
Here are the concrete signals worth watching in the coming weeks:
- September US CPI, for confirmation or a miss on the inflation trend
- The BOJ’s 17-18 September outcome and, crucially, its forward guidance language
- US consumer credit data, for signs of household stress deepening
- Treasury auction results, for whether the supply overhang is easing or worsening
Synchronised tightening creates real risks, equity and credit repricing, duration mismatches, but also selective openings such as short-duration fixed income and yield pick-up in investment-grade credit. Knowing how these forces interact is what keeps you from being caught off guard by the next probability repricing.
For readers wanting to translate the yield moves described here into concrete portfolio decisions, our dedicated guide to bond investing strategy in rising yield environments covers duration risk, the case for bond ladders, and why starting yield is the strongest predictor of 5-10 year bond returns.
This article is for informational purposes only and should not be considered financial advice. Investors should conduct their own research and consult with financial professionals before making investment decisions.
Past performance does not guarantee future results, and financial projections are subject to market conditions and various risk factors. Forward-looking rate paths are speculative and subject to change based on incoming data and central bank decisions.