Gold roughly doubled in price over a two-year stretch. Across most of that same stretch, the largest gold exchange-traded funds on the planet were losing money hand over fist.
That contradiction sits at the centre of any serious gold bull market outlook, and it breaks the most basic assumption investors carry into commodity rallies: that rising prices pull buyers in across every channel. When the biggest, most accessible gold products bleed capital while the metal itself surges, something structurally unusual is driving the move. That difference is not academic. It shapes how much room the rally may have left.
Here is the read this analysis offers: a way to interpret gold beyond the price chart. It identifies the specific demand sources that powered the first leg higher, and the institutional reallocation that has, by most measures, barely started.
The price doubled while the crowd was selling: understanding the ETF flow paradox
Start with the outflow data, because the scale of it is what makes the whole thing strange.
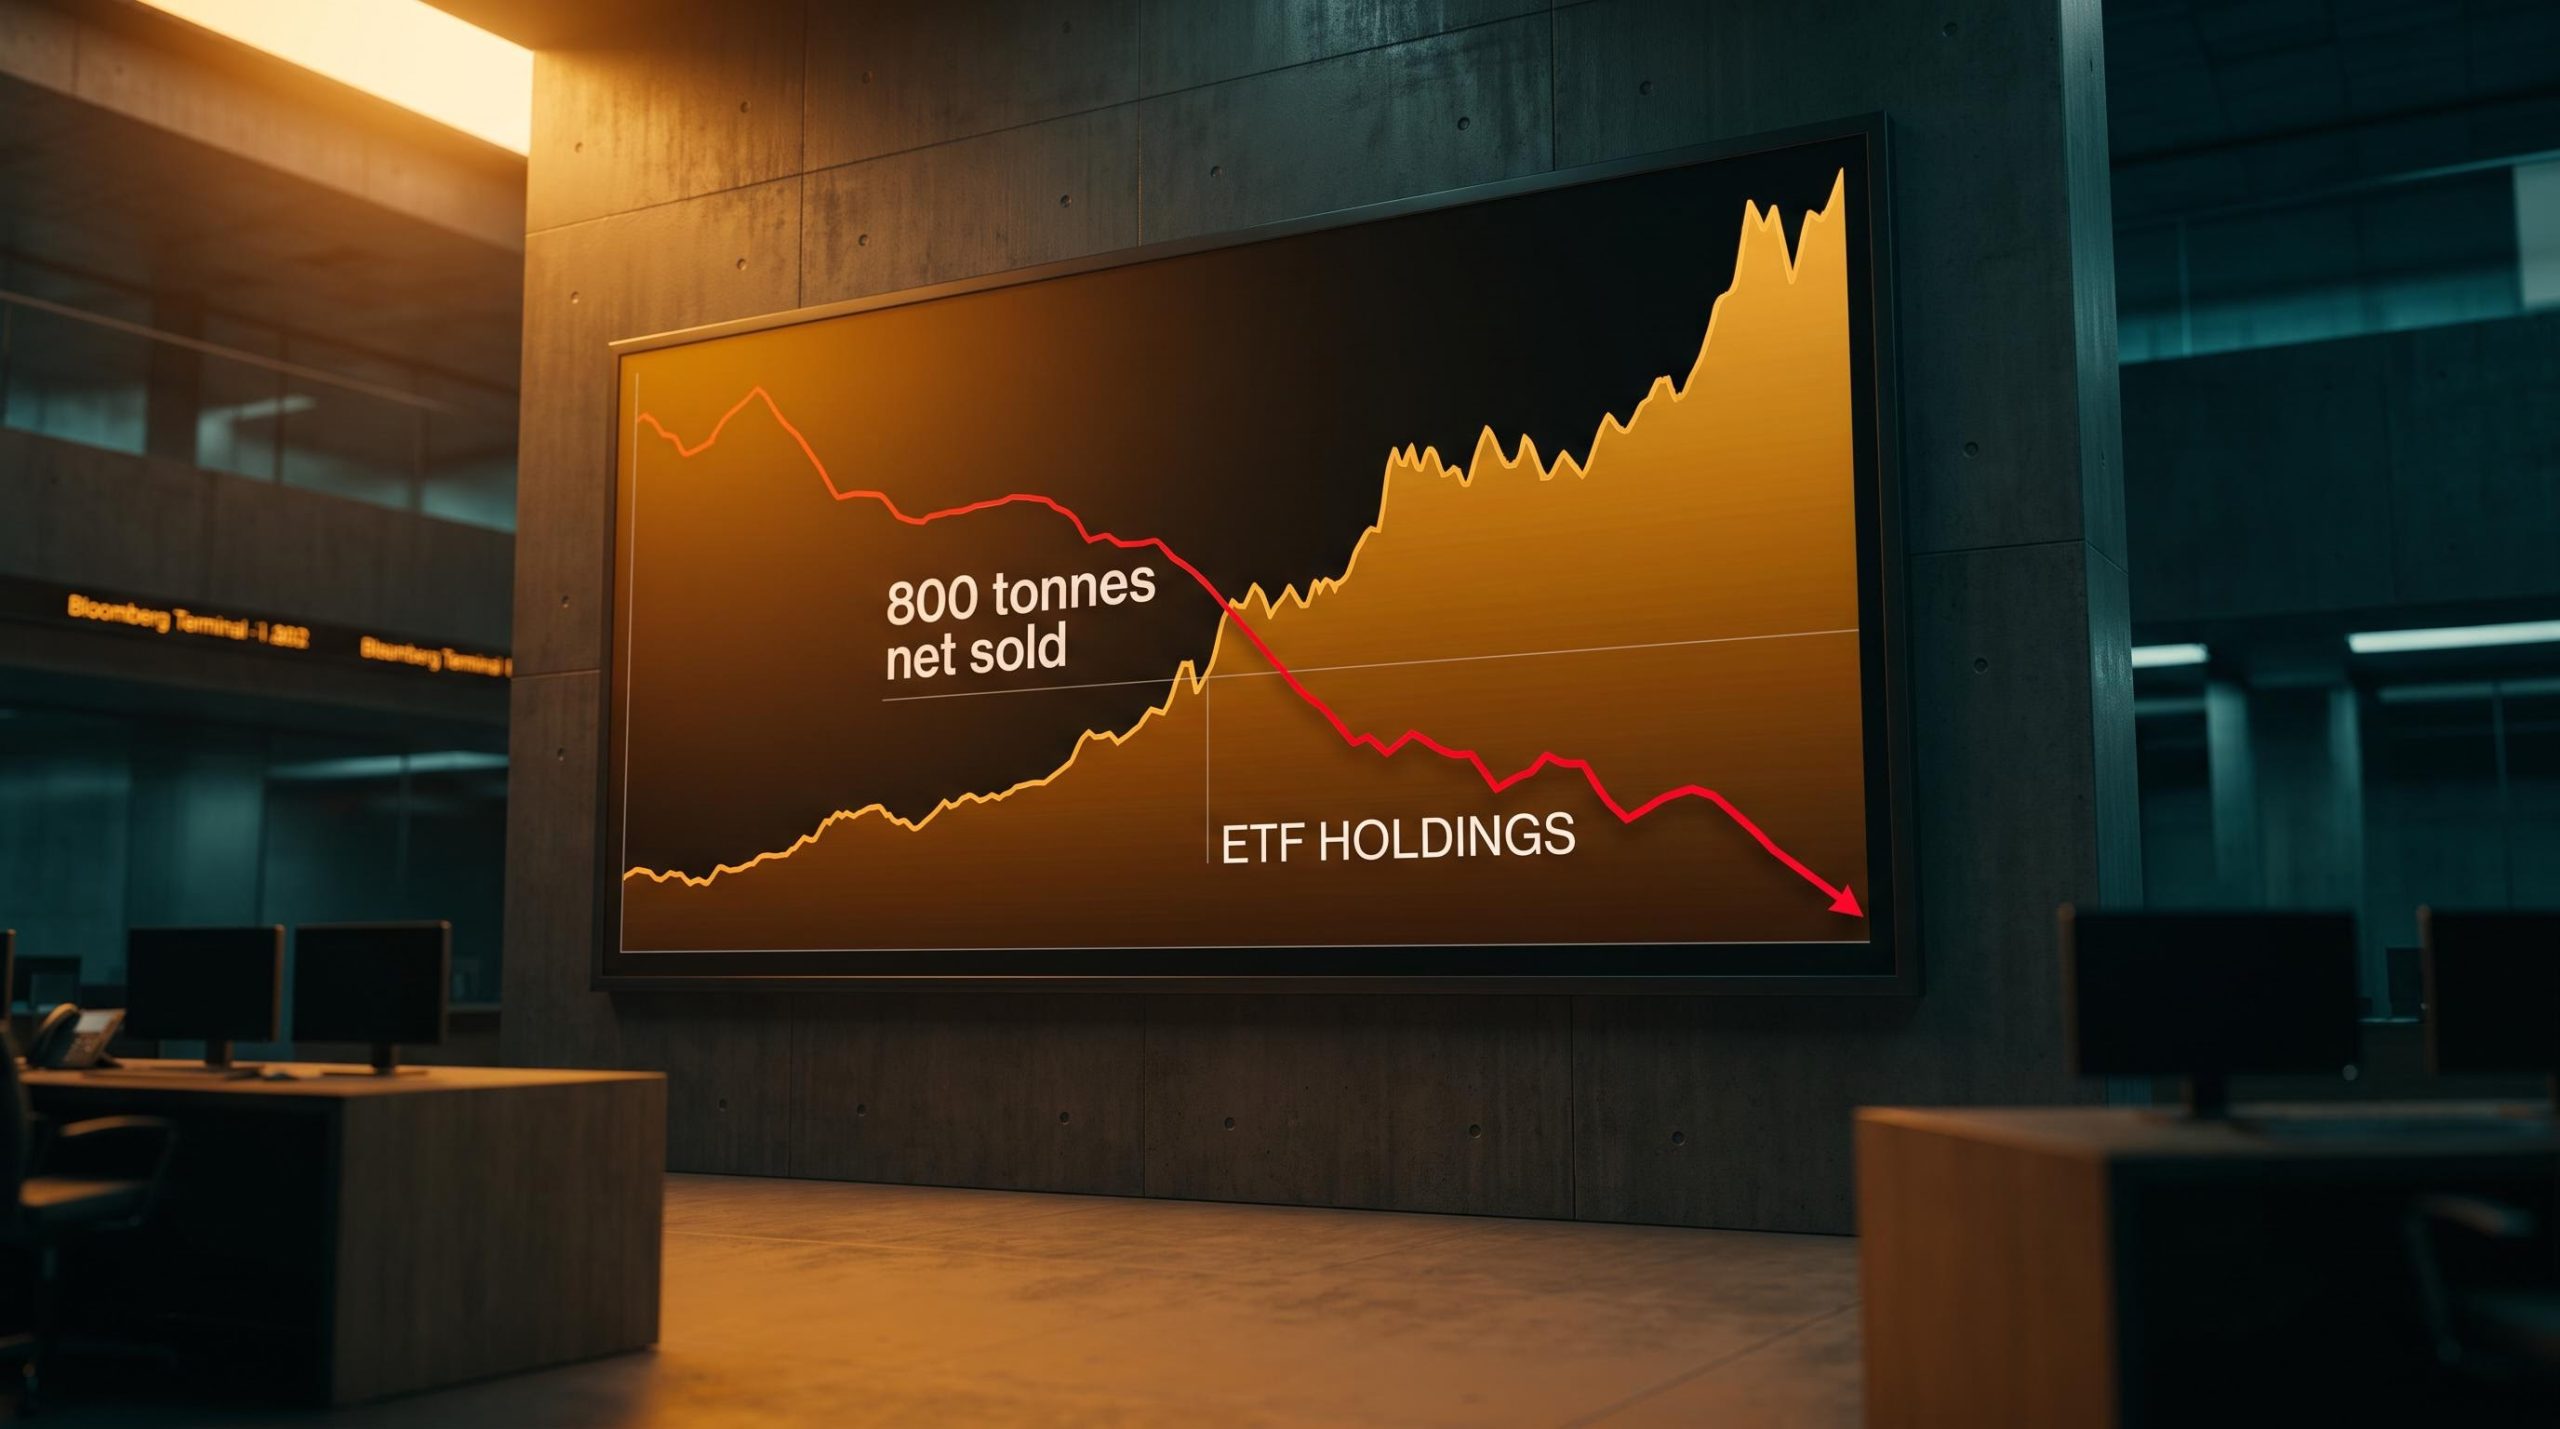
From Q4 2020 to Q2 2024, global gold ETFs recorded net sales of nearly 800 tonnes. Prices climbed through that entire window. The vehicles that most retail and institutional investors use to hold gold were shrinking while the underlying asset rose.
The outflow that defined the era Nearly 800 tonnes of net gold ETF sales between Q4 2020 and Q2 2024, even as the gold price steadily advanced.
The individual product numbers sharpen the picture. In the first half of 2024 alone, the iShares Gold Trust (IAU) lost $1.4 billion, and the SPDR Gold Trust (GLD) saw $2.8 billion walk out the door. These are among the most liquid gold products in existence, and they were being sold into a rising market.
| Product | Period | Net Flow (USD) | Direction |
|---|---|---|---|
| IAU (iShares Gold Trust) | H1 2024 | $1.4B | Outflow |
| GLD (SPDR Gold Trust) | H1 2024 | $2.8B | Outflow |
| GLD (SPDR Gold Trust) | YTD to July 2025 | $7.5B | Inflow |
| IAU (iShares Gold Trust) | YTD to July 2025 | $4.9B | Inflow |
The turn came only from the middle of 2025. In the first half of that year, global physical gold ETFs pulled in $38.1 billion, the strongest six-month showing in five years. By 9 July 2025, GLD had gathered $7.5 billion in year-to-date net inflows and IAU $4.9 billion.
That timing matters more than the size. The inflows arrived after gold had already essentially doubled, on its way to an all-time high near $5,590/oz in late January 2026. ETFs did not lead this market. They confirmed it, late.
ETF flow data as a leading indicator operates differently from what most investors assume: the 46.7-tonne single-week inflow that preceded gold’s move above $5,100 arrived before the price breakout, not after it, meaning WGC weekly flow releases carry more forward signal than the monthly aggregates most analysts track.
So the paradox resolves into a question with real weight for how you monitor gold. If the vehicles most investors watch were selling through the entire first leg, then whoever drove that leg was operating in channels standard flow data does not capture. For anyone who used ETF flows to time gold exposure, the signal was not just unhelpful. It pointed the wrong way, and it cost them the run.
What actually drove the rally: central banks, OTC markets, and the de-dollarisation trade
If the ETFs were selling, the buyers were somewhere else, and the aggregate numbers say exactly where.
Overall gold investment demand rose 25% in 2024, in the same year ETF flows ran negative. That demand concentrated in central banks, over-the-counter (OTC) derivatives, and physical bars, coins, and vaulted accounts. OTC refers to trades arranged directly between two parties rather than on a public exchange, which is precisely why so little of this buying showed up in the data investors normally track.
The scale is hard to overstate. Central banks bought more than 1,000 tonnes of gold annually for three consecutive years, from 2022 to 2024, accounting for roughly 20% of total global gold demand in 2024. Q4 2024 alone saw a 54% year-on-year jump to 333 tonnes.
This is not opportunistic trading. The logic behind it is geopolitical and, for the buyers, close to compulsory.
The jurisdictional safety logic behind sovereign gold accumulation is categorically different from the price-appreciation thesis most retail investors apply: physically vaulted gold cannot be frozen, sanctioned, or restricted by a foreign government’s political decisions, which is precisely why the 2022 Russian reserve seizure converted a theoretical risk into a demonstrated one for dozens of sovereign institutions simultaneously.
When the United States froze Russian dollar reserves following the invasion of Ukraine, it demonstrated something to every non-aligned government holding dollars or euros: fiat reserve assets carry counterparty risk. They can be switched off. Gold, held physically, cannot. As Peter Schiff, Chief Economist at Euro Pacific Asset Management, has argued, a central bank reducing dollar exposure does not need to rotate into another fiat currency at all. Gold is the non-fiat alternative, and Schiff has been making that case since he first recommended the metal around $400/oz in the early 2000s.
The OMFIF Global Public Investor survey released in mid-2026 captured a historic milestone in this de-dollarisation shift: for the first time on record, more sovereign institutions declared intent to reduce dollar holdings than to increase them, a finding that reframes central bank gold demand as a structural realignment rather than a tactical trade.
There is also an opacity problem, and it is the most telling data point in the entire market.
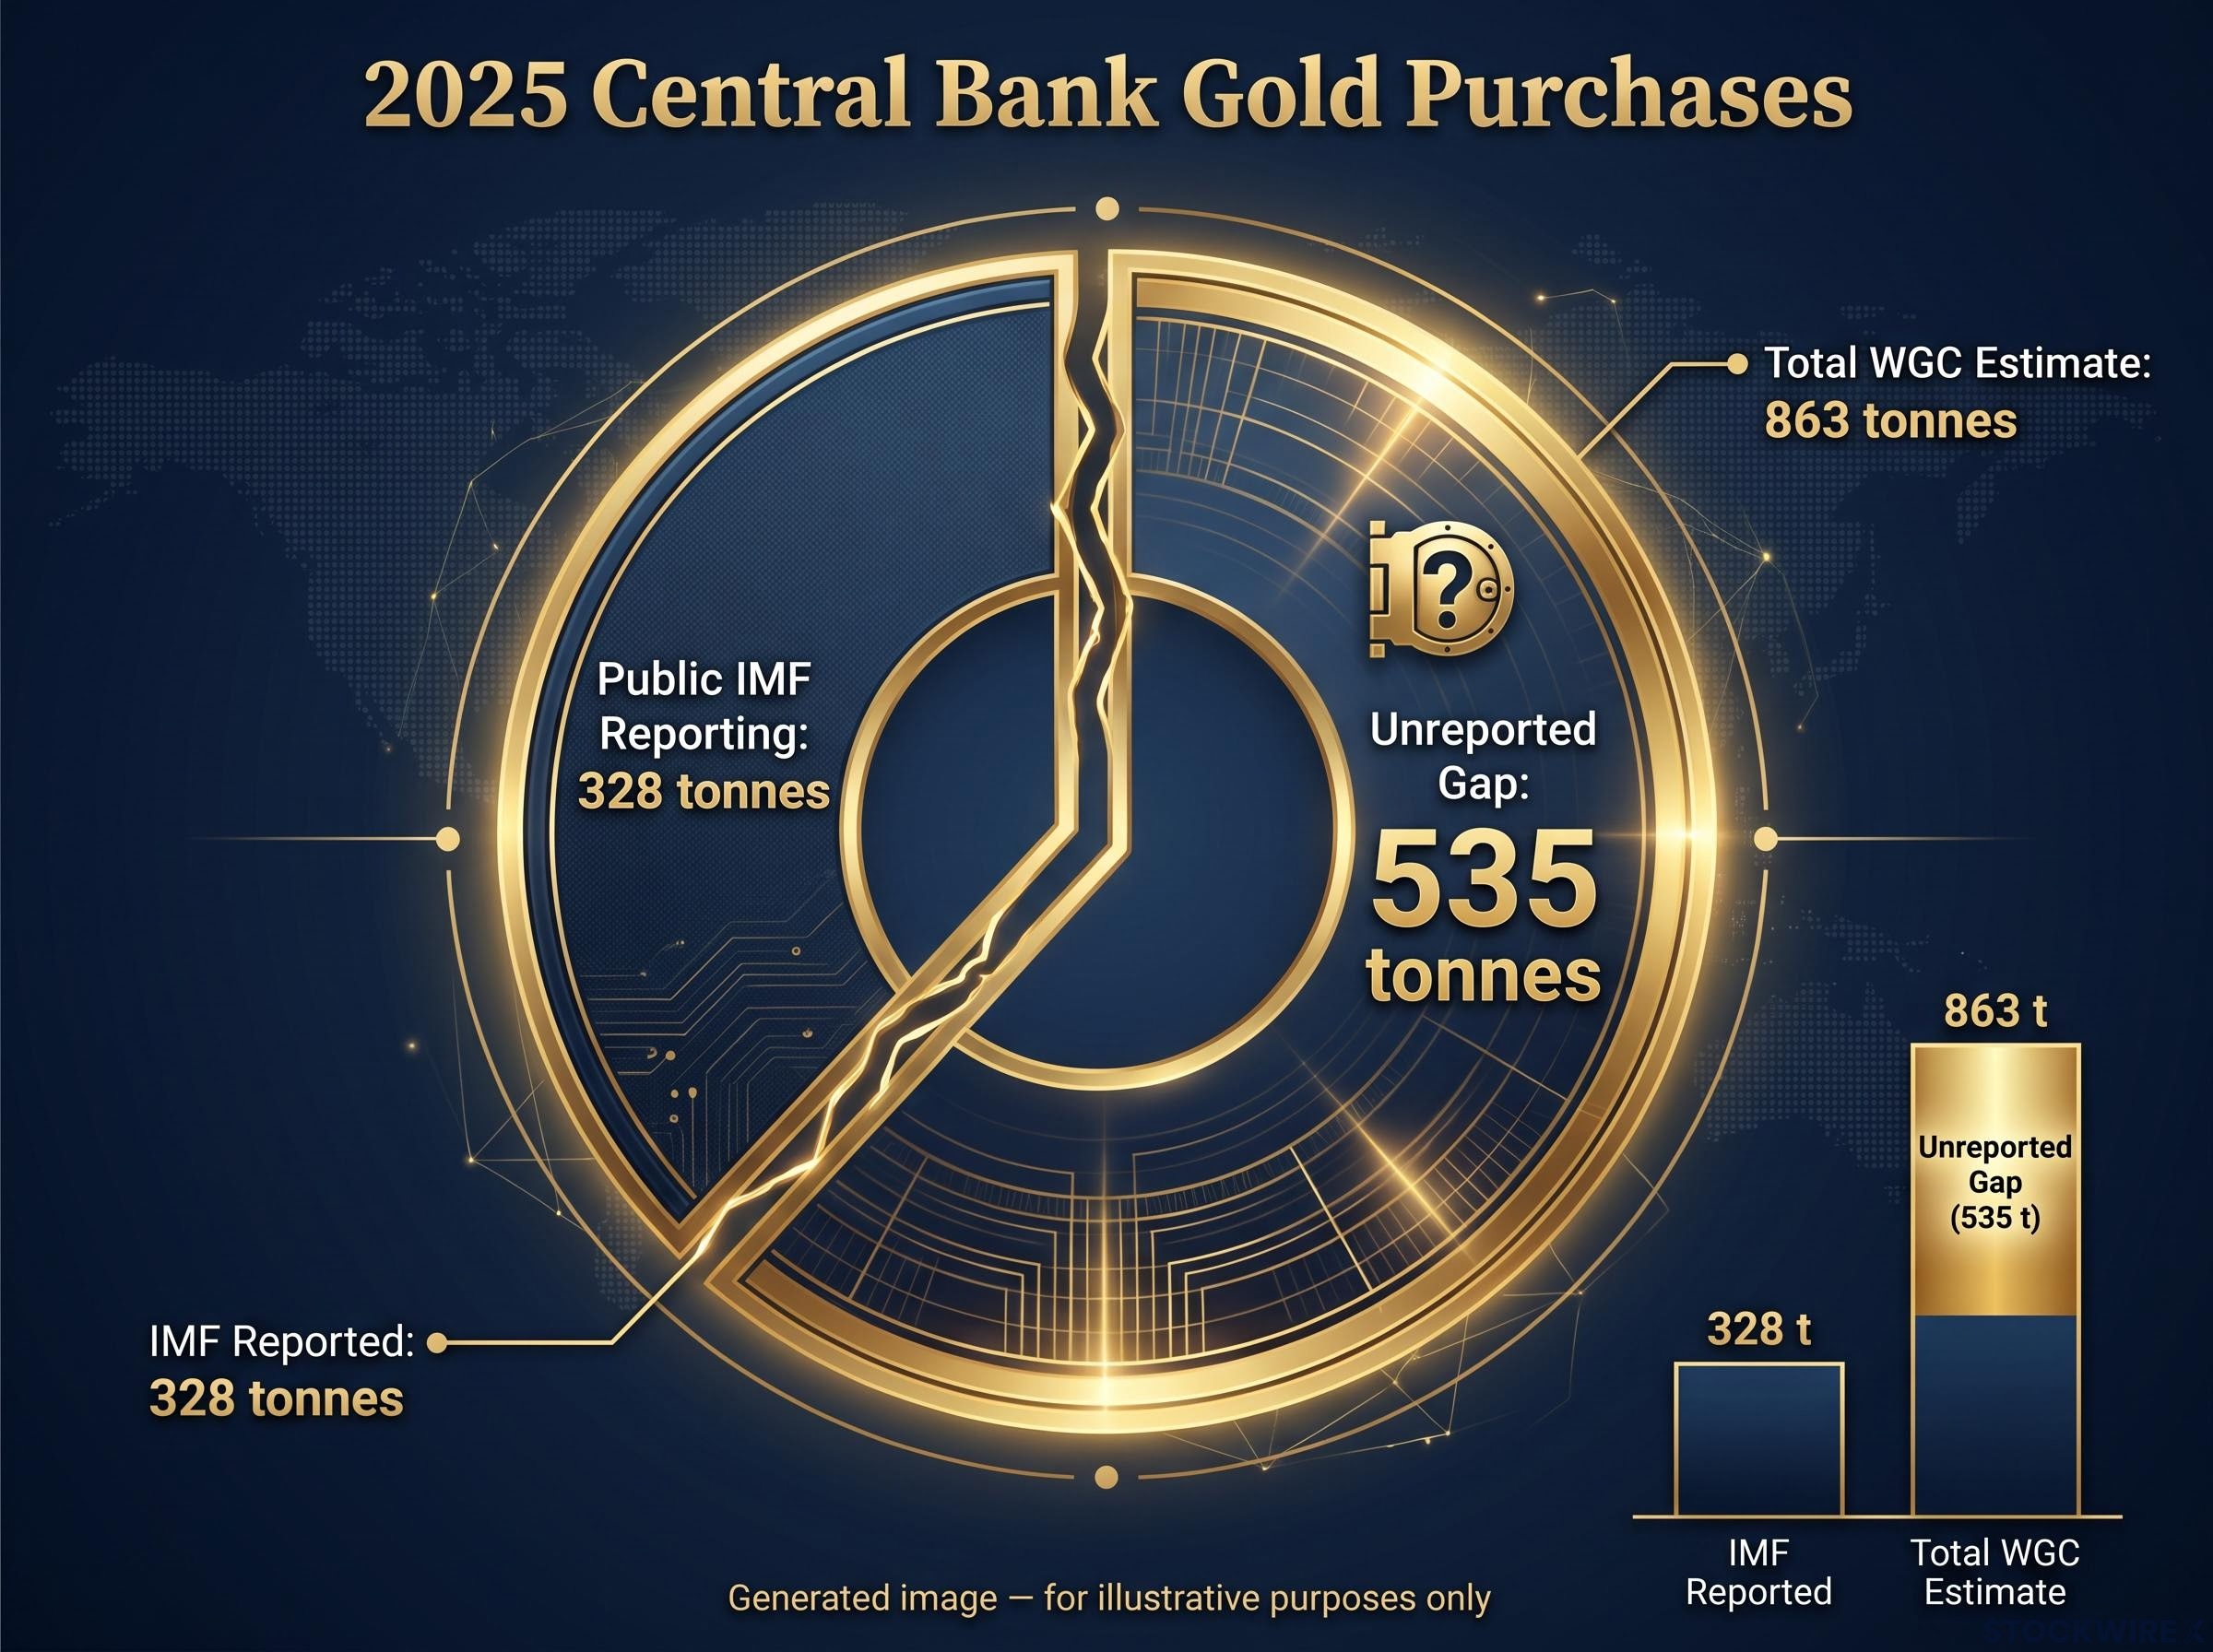
The reporting gap The World Gold Council estimated 863 tonnes of central bank net purchases in 2025. Public IMF-based reporting captured only 328 tonnes.
That 535-tonne gap is not a rounding error. It is the difference between what sovereigns are actually buying and what they are willing to disclose. What it tells you is that official gold data should be treated as a floor, never a ceiling. The real accumulation is larger and more politically sensitive than any published figure admits.
The World Gold Council central bank demand analysis documents the scale of unreported buying, the gap between estimated physical flows and figures publicly disclosed through sources such as the IMF, confirming that official statistics routinely undercount the true pace of sovereign accumulation.
The reserve allocation gap and what it implies for future demand
The structural argument for gold’s long runway lives in one uneven set of numbers.
| Country / Bloc | Gold as % of Reserves | Buyer Status |
|---|---|---|
| China | ~6% | Active |
| Japan | ~4-5% | Inactive |
| France | 50-60% | Inactive |
| Germany | 50-60% | Inactive |
| Poland | Rising | Active |
China holds gold at roughly 6% of its total foreign reserves. Japan sits near 4-5%. Legacy Western European holders such as France and Germany carry 50-60% of reserves in gold, a product of decades of accumulation.
Now run the maths on that imbalance. If Asian sovereigns moved even part of the way toward Western European allocation norms, the resulting demand would dwarf annual global mine supply by orders of magnitude. This is why the buying reads as a reallocation with decades of precedent, not a spike. The time horizon you apply to gold’s demand profile should reflect that.
Bitcoin’s role as a competing store-of-value narrative
There is a reason not all of that displaced retail capital found its way into gold, and it has a ticker.
Bitcoin absorbed attention and money that would, in an earlier era, have looked at gold first. The mechanism was Wall Street itself: the creation of Bitcoin ETFs and structured products gave institutions a familiar, regulated wrapper for crypto exposure, and flows followed the plumbing.
The correlation data shows the two are now being managed as substitutes. The 3-month realised correlation between gold and Bitcoin recently reached approximately 0.51, its highest since the onset of COVID-19.
The substitution signal A gold-Bitcoin correlation near 0.51, the highest since early 2020, suggests a shared investor base is treating both as competing store-of-value bets.
Three specific channels explain the diversion:
- ETF product creation: regulated Bitcoin ETFs routed institutional flows toward crypto rather than precious metals.
- The store-of-value narrative: Bitcoin competes directly for younger investors who might otherwise have adopted gold as their inflation hedge.
- Allocation frameworks: institutional models increasingly slot crypto into the alternative-asset bucket gold once occupied alone.
Schiff frames Bitcoin as having drained capital that would otherwise have entered gold, and that view is worth weighing alongside the correlation. A reading near 0.51 means a material slice of the capital pool sees these as interchangeable. That tells you gold’s pace of mainstream re-adoption now depends partly on how the crypto story evolves, a variable sitting entirely outside gold’s own fundamentals.
Where the risks sit and what a late-cycle entry actually looks like
The structural case is strong. That does not mean every entry point into it is equal, and this is where honesty about timing matters.
Three risk vectors deserve clear naming:
- Macro reversal: a stabilising or strengthening US dollar and rising real yields would remove the monetary backdrop gold has leaned on.
- Demand-side moderation: central bank buying slowed from more than 1,000 tonnes annually to an estimated 863 tonnes in 2025, raising the question of whether official support has peaked.
- Valuation and mean reversion: after touching roughly $5,590/oz on 28 January 2026, gold looks stretched against historical norms and is vulnerable to consolidation.
Not all of these are equal in kind, and separating them is the whole exercise. A collapse in de-dollarisation or a genuine reversal of sovereign buying would challenge the structural thesis itself. Mean reversion after an extreme move and a temporarily stretched valuation are ordinary cyclical events that say nothing about the long-term case.
Distinguishing structural demand from cyclical positioning risk
Two questions are hiding inside “should I buy gold now,” and confusing them is how investors get hurt.
The first is structural: is the long-term bull case intact? That case rests on de-dollarisation, the enormous reserve reallocation still ahead for Asian central banks, and the near-total absence of mainstream institutional participation. A price peak resolves none of those.
The second is cyclical: is this a good entry point at current prices? A consolidation after an extreme run does not invalidate the structural story, but it absolutely affects what you pay and what you can reasonably expect back.
Here is the asymmetry that a late-arriving ETF buyer needs to sit with. A central bank that accumulated gold well before prices approached current levels and an investor buying through an ETF above $5,000/oz in 2025 or 2026 are not making the same bet. The thesis may hold for both. The margin of safety and the expected return profile are worlds apart. Knowing which position you are actually in is the line between informed positioning and chasing a chart.
The bull market that most investors missed, and whether the second leg looks different
Step back and the shape of the whole thing becomes clear.
Gold delivered one of its strongest multi-year price runs in modern history almost entirely without mainstream investor participation. The buyers were sovereigns, OTC desks, and physical holders in Asia. The retail and institutional crowd, watching ETF flows, largely sat it out.
The scale of the move From roughly $400/oz in the early 2000s to an all-time high near $5,590/oz in January 2026.
The first leg was a sovereign and physical-buyer phenomenon. The second leg, if it arrives, would have to be an institutional reallocation story, and that transition is measurable. Three variables are worth watching:
OTC investment flows are the category most coverage omits entirely: in Q2 2026 alone, OTC gold investment delivered 327 tonnes against a widely reported 46% year-on-year fall in headline investment demand, a measurement gap that mirrors precisely the structural blind spot the 2020-2024 outflow period created for investors watching ETF data.
- Sustained ETF inflows running above the mid-2025 baseline, with the $38.1 billion first-half figure signalling that mainstream participation is beginning, not established.
- Visible acceleration in Asian central bank reallocation toward Western European norms, the single largest structural demand overhang given China and Japan sit at 4-6% versus 50-60% in France and Germany.
- A meaningful softening of Bitcoin’s store-of-value narrative, which would free capital currently treating crypto as gold’s substitute.
The contrarian roots of this case are real. Gold was dismissed at $400/oz and has since outperformed major equity benchmarks over the long run, according to Schiff’s account. Past contrarian vindication does not cancel present valuation risk, though. The most important number to track from here may be the central bank buying pace, whose slide from over 1,000 tonnes to 863 tonnes is the clearest early tell on whether the thesis is strengthening or quietly deteriorating.
This article is for informational purposes only and should not be considered financial advice. Investors should conduct their own research and consult with financial professionals before making investment decisions. Past performance does not guarantee future results. Financial projections are subject to market conditions and various risk factors.