The U.S. 10-year real bond yield just touched 2.5%, a level this cycle has not seen before, and markets are starting to register the weight of what that figure actually implies.
Most finance readers are comfortable with the familiar numbers: a nominal 10-year yield hovering near 5% and headline inflation at 3.4%. The real yield gets discussed far less, yet it matters more. It is the rate the economy has to clear before any investment makes sense, and at 2.5% it is now materially restrictive by almost any historical benchmark. European equities are already feeling it, and Wall Street’s cushion over risk-free bonds has all but vanished.
Here is what the real yield signal is actually telling you, and why the answer matters more than the nominal headline. The distinction between what is durable in this rates move and what is transitory is the single most important call you can make before touching your portfolio.
Real yields at 2.5%: how far and how fast
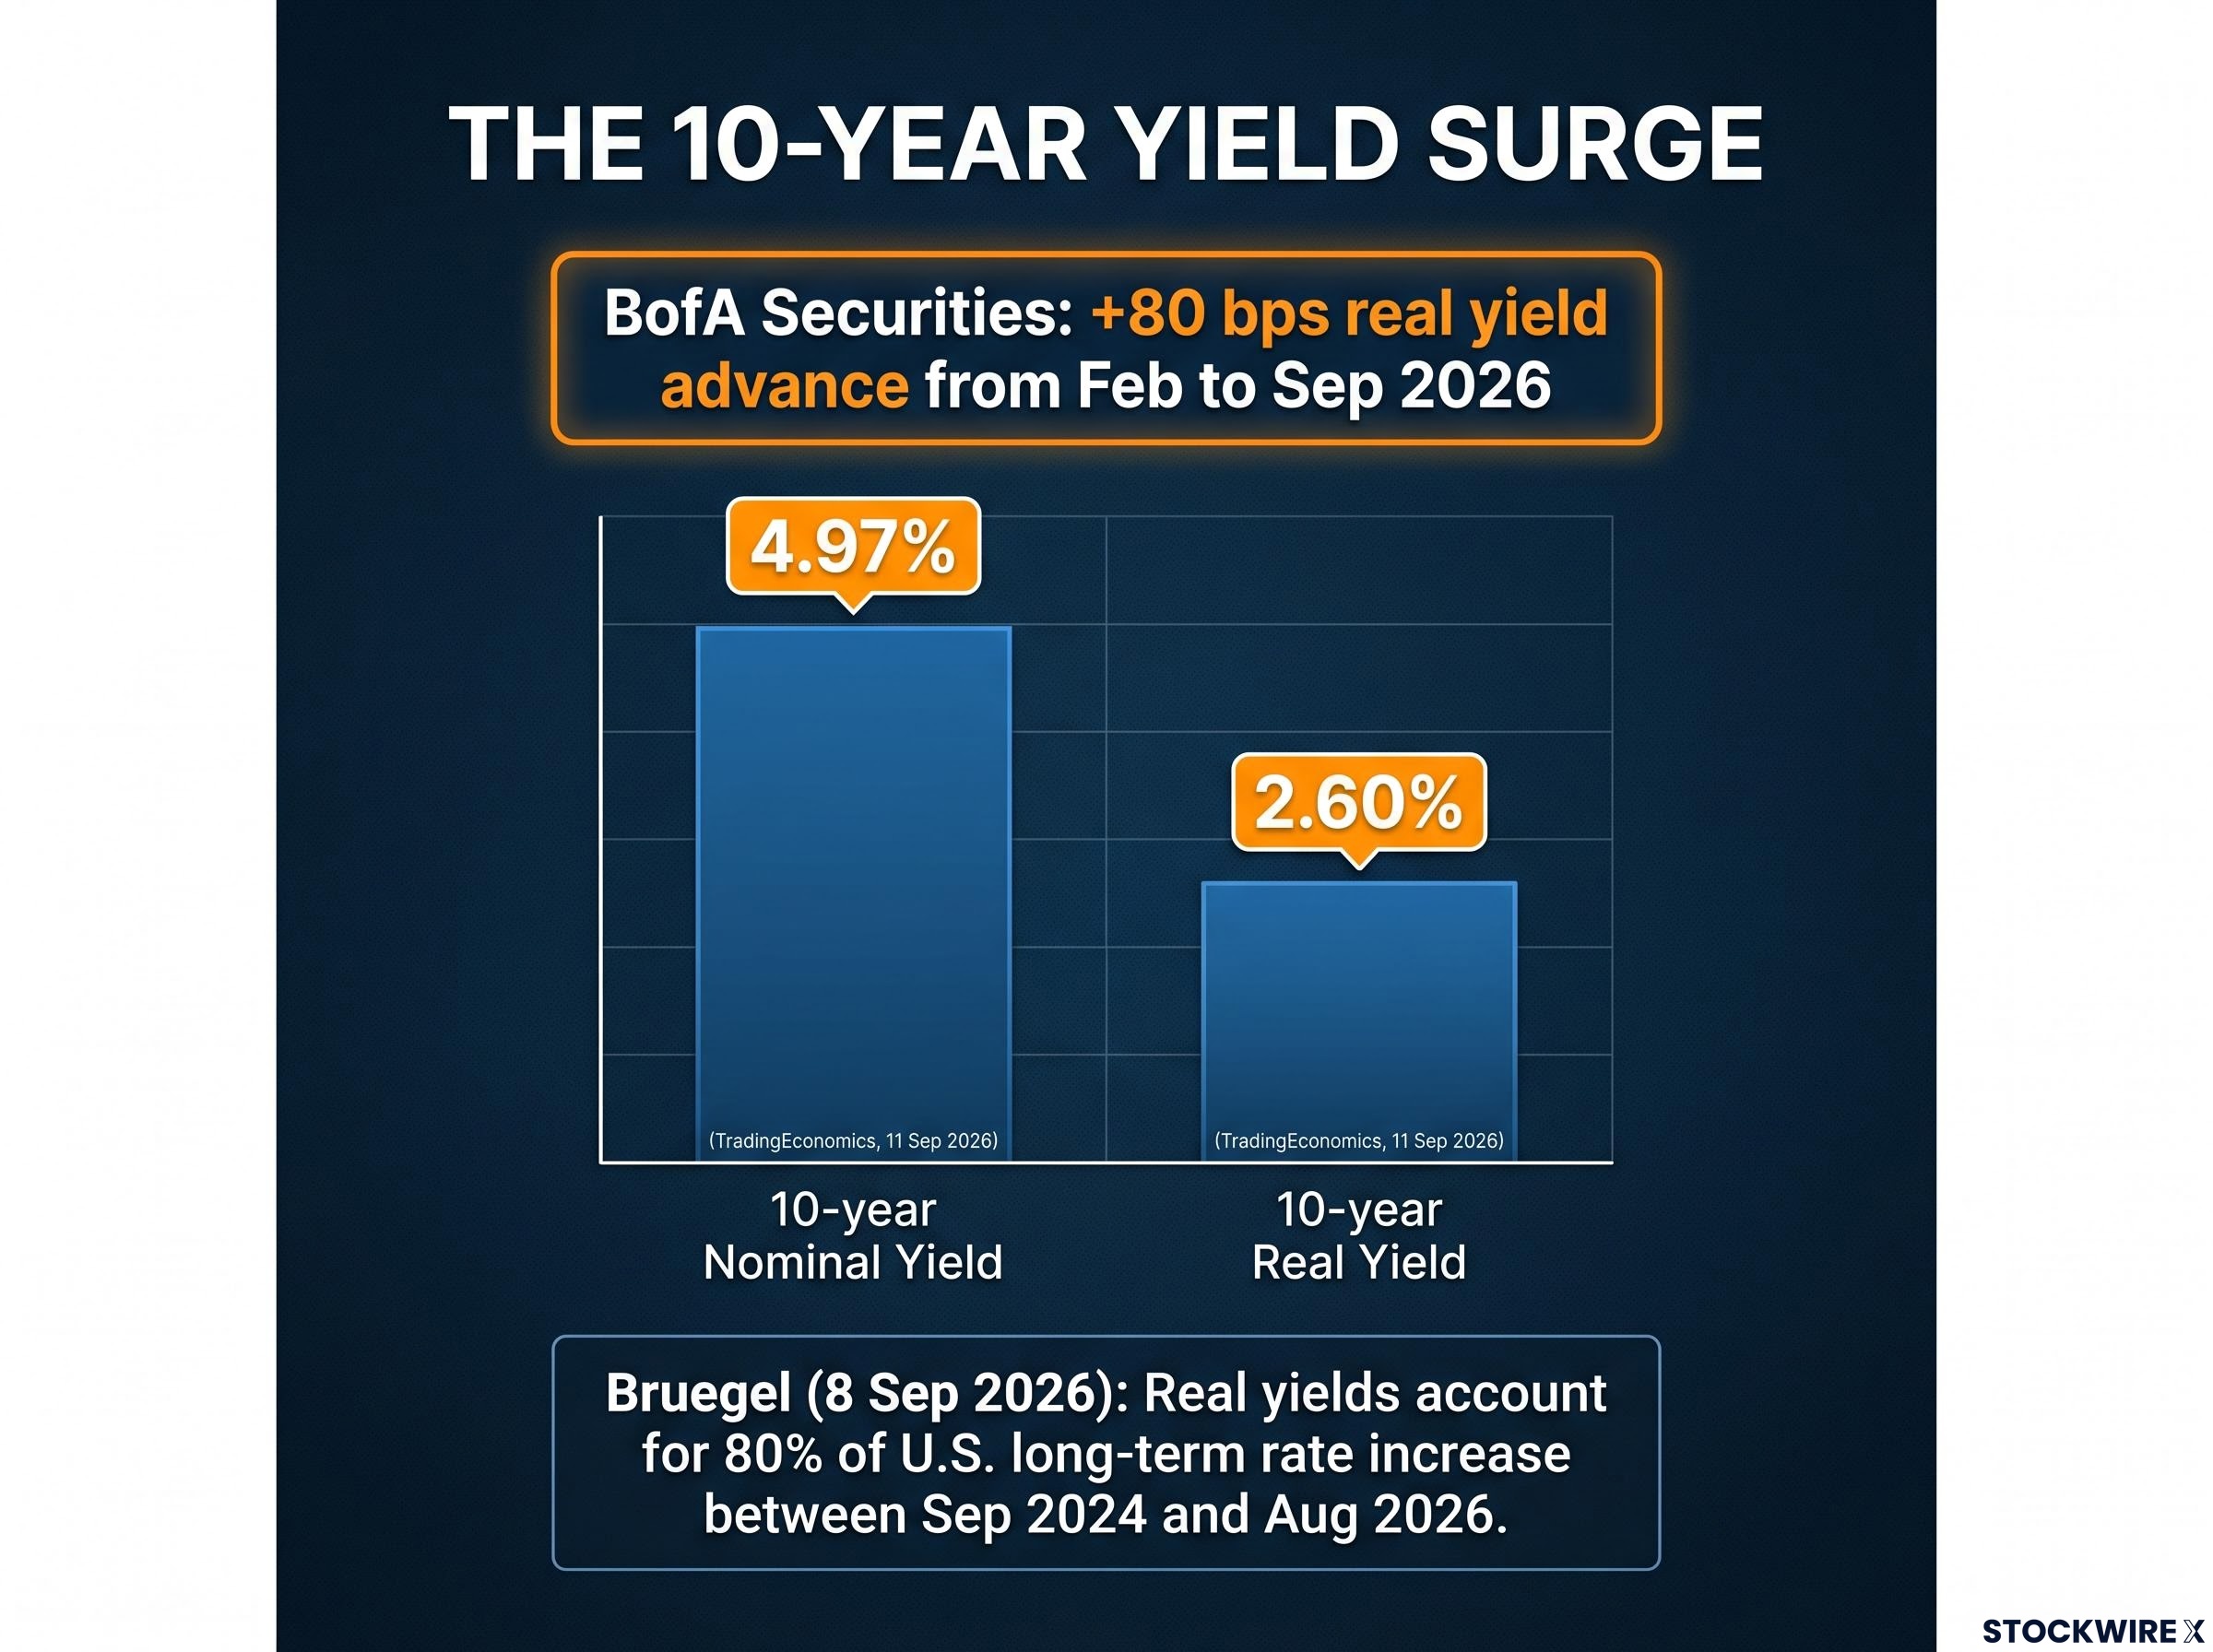
Start with the raw scale of what has happened. According to BofA Securities, the 10-year real bond yield climbed 80 basis points from February 2026 to a cycle peak of 2.5% by mid-September. That is a sprint, not a drift.
Real-time market data confirms the level. Federal Reserve Economic Data (series DFII10) put the 10-year TIPS yield at 2.55% on 10 September 2026, while TradingEconomics quoted 2.60% on 11 September 2026. The real cost of money, in other words, is sitting at its highest of the cycle across independent sources.
The Federal Reserve TIPS yield data provides the official framework for interpreting real yields, defining them as the riskless real return on inflation-protected securities with inflation compensation derived by comparing TIPS yields to their nominal equivalents, the same methodology underpinning the FRED DFII10 series cited throughout this analysis.
Set that alongside the nominal picture and the significance sharpens. The nominal 10-year Treasury yield stood at 4.97% on 11 September 2026, per TradingEconomics. But the composition of that number is where the story lives.
According to Bruegel (8 September 2026), real yields account for roughly 80% of the increase in U.S. long-term interest rates between September 2024 and August 2026, an unusually high share by historical standards.
That attribution is the whole point. When four-fifths of a yield increase comes from the real component rather than inflation premia, this is not an inflation scare. It is a discount-rate shock, a repricing of the hurdle every asset in your portfolio must clear to justify its valuation.
The distinction matters because bond yield mechanics determine whether a yield surge reflects growth confidence, inflation fear, or fiscal risk repricing, and each driver carries entirely different implications for how long the move persists and which assets bear the brunt.
The inflation backdrop reinforces that reading. The Bureau of Labor Statistics reported August 2026 headline CPI at +3.4% year-over-year and core CPI at +2.4%, both released on 11 September 2026. Sticky, but hardly a runaway.
Short-term momentum tells a murkier story, and the sources diverge. The Nowflation Gauge (updated 12 September 2026) put three-month annualised CPI at roughly 2.24%, while BofA Securities characterised the same metric as running near a five-year low of approximately 1.6%. The gap likely reflects different seasonal adjustment methods or lookback windows, so treat each figure with its own attribution rather than as a single agreed number.
| Metric | Level | Date | Source |
|---|---|---|---|
| 10-year real yield (TIPS) | 2.55% | 10 Sep 2026 | FRED (DFII10) |
| 10-year real yield (TIPS) | 2.60% | 11 Sep 2026 | TradingEconomics |
| Real yield advance from Feb 2026 | +80 bps | Feb-Sep 2026 | BofA Securities |
| 10-year nominal yield | 4.97% | 11 Sep 2026 | TradingEconomics |
| Headline / core CPI (YoY) | 3.4% / 2.4% | 11 Sep 2026 | BLS |
Internalise that 80-basis-point move, because every institutional view that follows only makes sense once you grasp how fast and how far the real cost of capital has shifted.
When big ASX news breaks, our subscribers know first
Why real yields have surged: the cyclical-versus-structural fault line
Here the analysis splits, and the split has real money on both sides. One camp reads the surge as healthy cyclical strength. The other sees a structural repricing that sets a new, durably higher floor. How you resolve that question determines how you position duration.
The cyclical case
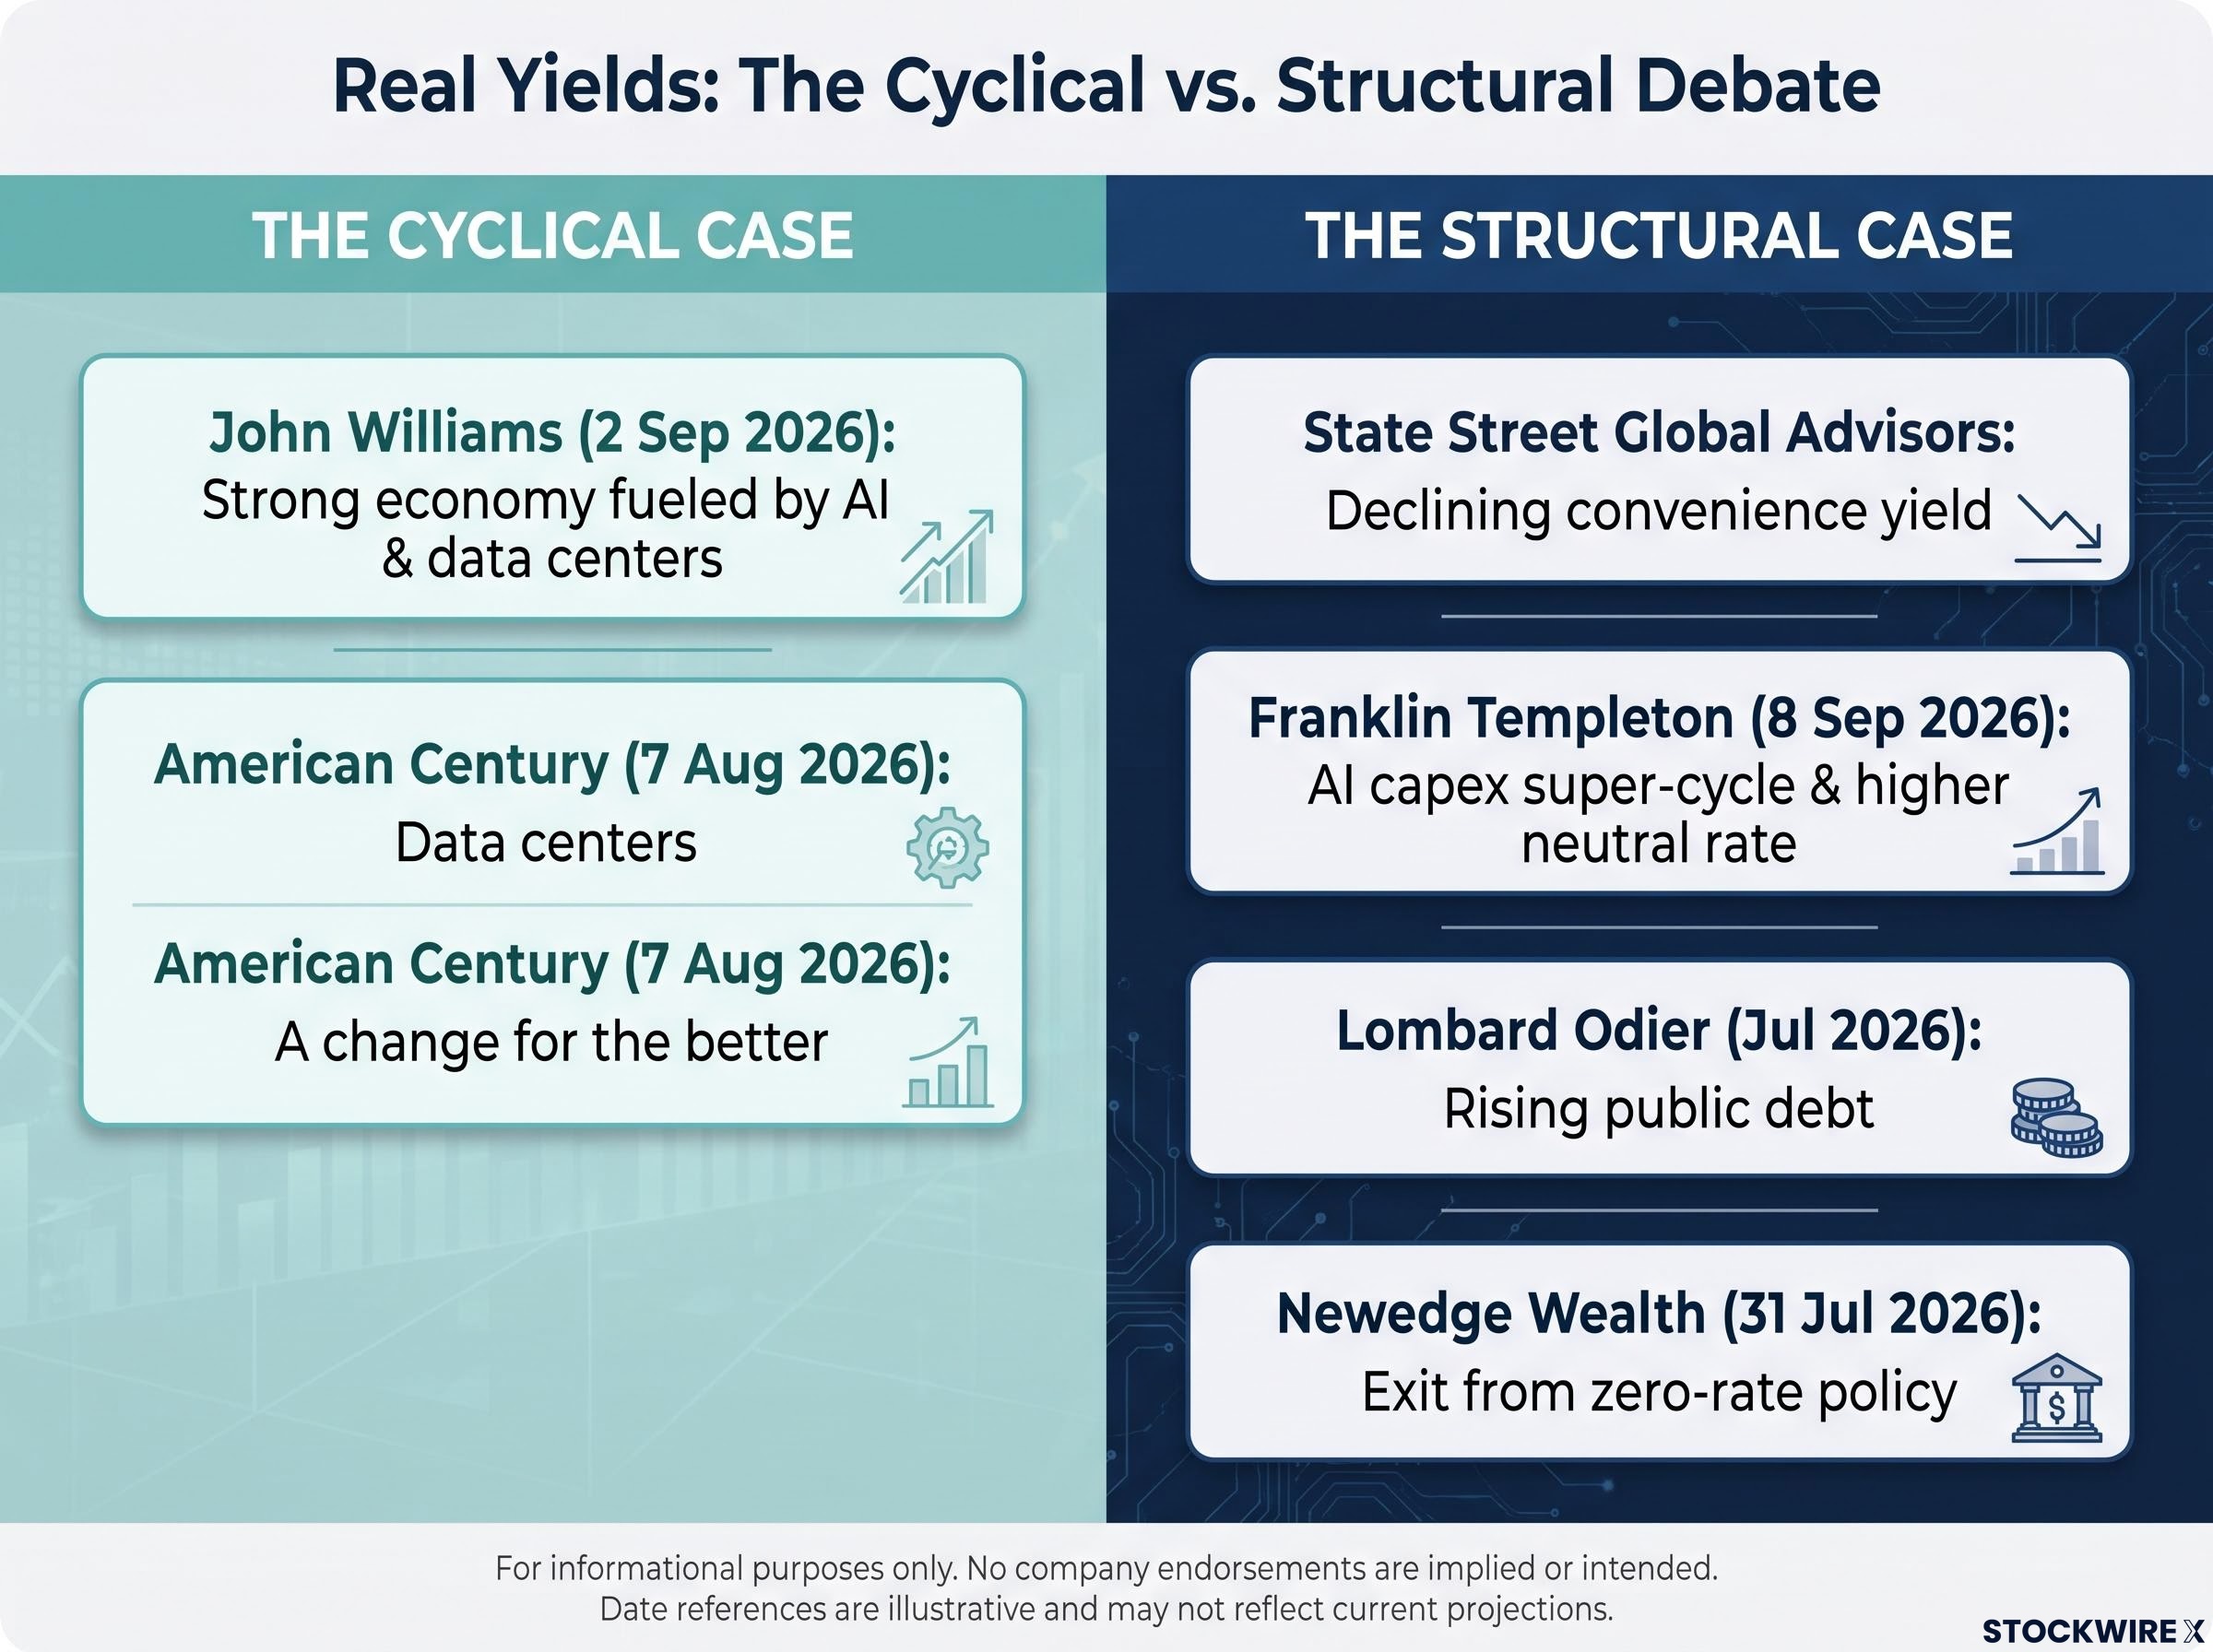
The official voices lean cyclical. New York Fed President John Williams, in a CNBC interview on 2 September 2026, argued the yield surge reflects “a strong U.S. economy and strong economic outlook fueled by big investments in AI, data centers and technology.” His framing was pointed: it is the economy driving financial conditions, not the reverse.
American Century’s Fed-watch commentary (7 August 2026) read the central bank as treating higher real and nominal yields grounded in data as “a change for the better.” In this telling, the move is deliberate normalisation rather than dysfunction, the kind of tightening that eventually mean-reverts once cyclical momentum cools.
The structural case
The structural camp reads the same data and reaches the opposite conclusion: this is a new equilibrium, not a passing peak.
- State Street Global Advisors points to a structural decline in the Treasury “convenience yield,” the safety and liquidity premium investors assign to Treasuries, eroding as fiscal deficits and debt-to-GDP ratios worsen.
- Franklin Templeton (8 September 2026) frames a “real yield reset” driven by a higher neutral real policy rate and an AI capital-expenditure super-cycle, arguing the shift is durable rather than transitory.
- Lombard Odier (July 2026) attributes the move to rising public debt, resilient private investment, and improving capital productivity.
- Newedge Wealth (31 July 2026) calls it a regime change for long-duration assets, tied to the exit from zero-rate policy and a shrinking Fed balance sheet.
The global backdrop complicates any neat cyclical label. BofA Securities notes the worldwide PMI composite hit a three-year high in August 2026, oil has pushed above $100 per barrel, reintroducing supply-chain pressure, and markets are already pricing three additional Fed hikes by mid-2027.
The honest read is that institutional research is split roughly down the middle, and that split is itself a signal. A cyclical spike eventually reverses; a structural reset sets a new cost of capital that reshapes equity valuations, real estate, and corporate investment for years. Until the evidence tilts decisively one way, treat any single forecast you encounter as a hypothesis to stress-test, not a conclusion to lean on.
For investors weighing how to tilt sector exposure as the cyclical-versus-structural debate plays out, our dedicated guide to cyclical and defensive allocation covers how institutional allocators blend both sides of the spectrum across economic phases, including the barbell approach gaining traction in mixed-signal environments.
The equity risk premium is no longer a cushion
Equities held up early in this rates move because two buffers absorbed the shock: a compressing equity risk premium and a strong earnings upgrade cycle. Watch how each one has been stripped away.
The equity risk premium (ERP) is the extra return investors demand for holding stocks over risk-free bonds. When it shrinks, equities look expensive relative to Treasuries. And it has been shrinking fast.
Societe Generale (via Reuters, 27 May 2026) estimated the U.S. ERP at roughly 3.5%, closing in on the 3% threshold where its models see equities beginning to struggle against bonds, with a nominal yield around 4.5% flagged as the critical juncture. JPMorgan (same date) put its ERP proxy, the gap between the S&P 500 equity discount rate and the real 10-year yield, at about 2.2%, a post-financial-crisis low.
Then the buffer disappears entirely.
Equity risk premium compression of this speed and magnitude has only a handful of historical precedents, with JPMorgan’s data placing the current S&P 500 reading at 2.1%, a level not seen since 2002 and below the trough recorded on the eve of the 2007 financial crisis.
Allianz (June 2026) described the real equity risk premium as “a breakeven, not a buffer,” and noted the nominal ERP has turned negative.
A separate reading from Dorsey Wright/Nasdaq (22 May 2026) placed the ERP versus the 30-year yield near -1.5%, though that figure is unverified and worth treating with caution. The direction of travel, however, is consistent across every source: the margin of safety in equities relative to bonds has collapsed.
| Institution | ERP measure | Level | Stress threshold | Date |
|---|---|---|---|---|
| Societe Generale | U.S. ERP estimate | ~3.5% | ~3% | May 2026 |
| JPMorgan | ERP proxy vs real 10-year | ~2.2% (post-GFC low) | n/a | May 2026 |
| Allianz | Real / nominal ERP | Breakeven / negative | n/a | Jun 2026 |
| Dorsey Wright | ERP vs 30-year (unverified) | ~-1.5% | n/a | May 2026 |
Europe shows what a stripped cushion looks like in practice. Per BofA Securities, the Stoxx 600 has fallen roughly 4% from its mid-August highs as rising rates stopped being offset by a falling ERP. The sequence tells the story: the index slipped 0.6% to about 647 on 1 September 2026, the DAX dropped 1.1% and the Euro Stoxx 50 fell 0.8% on 2 September, and by 9 September the Stoxx 600 shed 1.4% to 640.41 as Brent crude breached $100 a barrel, marking its steepest weekly fall since early July.
UBS analyst Kiran Ganesh captured the mechanism on 9 September 2026, warning that higher oil prices feed higher inflation expectations, greater odds of rate hikes, and higher bond yields, producing a “compounding negative impact” on equities.
The takeaway is blunt. At current real yields, with the ERP at a post-GFC low and analysts calling it a breakeven rather than a buffer, equities are no longer being paid to take on risk relative to Treasuries. Treat that as a structural vulnerability, not a dip to buy.
Why the BofA self-limiting thesis deserves serious weight
Against a consensus expecting yields to keep climbing, BofA Securities offers the most interesting contrarian call in the debate: the selloff may cap itself. The logic builds cleanly, and it deserves genuine attention before the counterarguments arrive.
- The tightening is already priced. Markets have embedded three Fed hikes by mid-2027, so much of the hawkishness is already in the forward curve.
- Inflation momentum is weaker than the headline. BofA puts three-month annualised CPI near a five-year low of roughly 1.6%, undercutting the case for aggressive further tightening.
- A selloff that hurts equities tightens conditions on its own. Falling stocks and chilled risk-taking dampen demand, which reduces the Fed’s need to hike, capping yields through the back door.
- Positioning is crowded short. Investors are heavily positioned for higher yields, which raises the odds of a mean-reverting rally lower.
Put a number on it, and the call becomes falsifiable.
BofA Securities projects the U.S. 10-year yield retreats to approximately 4.5% by year-end 2026, diverging from the consensus view that yields will keep climbing.
That target gives you a clean anchor for when Treasuries start looking attractive against equities again. But the structural camp complicates it. Bruegel, State Street, and Franklin Templeton all point to forces, fiscal deficits, the AI capex cycle, and a higher neutral rate, that could keep real yields elevated even if the Fed pauses.
Williams and American Century sharpen the doubt further: the Fed has signalled it will not pivot automatically just because equities weaken, since price stability is the mandate regardless of market volatility. So treat BofA’s 4.5% as a possibility to monitor, not a base case to act on unconditionally.
What cycle-peak real yields mean for your next portfolio move
Both camps agree on one thing: real yields are at a cycle peak. Where they part ways is whether that peak is a ceiling or a floor, and that disagreement is the only honest starting point for any decision you make now.
The ERP work translates the debate into a direct question for your allocation. At current real yield levels, the conventional case for a heavy equity weighting over fixed income rests on earnings growth holding its pace. The fading Stoxx 600 and the stalling upgrade cycle suggest that assumption is under real strain, with JPMorgan’s ERP proxy at a post-GFC low of roughly 2.2% as the reference point.
Real yield sensitivity is not uniform across the equity market: long-duration growth and technology stocks bear the sharpest repricing when real rates climb, while value and cyclical sectors with near-term cash flows have historically held up better, provided the yield rise reflects genuine growth strength rather than fiscal credibility concerns.
Rather than pretend the uncertainty resolves, track three variables that will tell you in real time which camp is winning.
- Three-month annualised CPI momentum. Watch whether it drifts toward BofA’s ~1.6% reading or the Nowflation Gauge’s ~2.24%. Softer momentum strengthens the self-limiting case.
- Treasury short positioning. If the crowded short unwinds, expect a yield rally lower, consistent with BofA’s mean-reversion argument.
- Fed communication. Watch whether equity weakness starts to soften the Williams line, or whether the “change for the better” framing holds firm.
If CPI momentum eases, shorts unwind, and Fed rhetoric bends, the environment is resolving toward BofA’s 4.5%. If not, position for a durably higher cost of capital.
This article is for informational purposes only and should not be considered financial advice. Investors should conduct their own research and consult with financial professionals before making investment decisions. Past performance does not guarantee future results, and financial projections are subject to market conditions and various risk factors.