European markets are priced for anxiety right now. The underlying corporate earnings story tells a very different tale, with STOXX 600 profits for Q2 2026 running at their strongest pace since 2022.
That gap between what investors are watching and what the data says matters more is the story of September. Two events in the first two weeks of the month have dominated European investment commentary: the European Central Bank’s second rate hike of the cycle, lifting the deposit rate to 2.50%, and UK Chancellor John Healey’s pre-budget address signalling fiscal restraint under Prime Minister Andy Burnham. Both are being read through a lens of uncertainty. That framing may be the wrong one.
European investor sentiment has rarely been more disconnected from the fundamentals underneath it. What follows here separates the signals worth weighting from the ones worth discounting, so that anyone holding European exposure can calibrate their portfolio thinking around these developments rather than react to the headlines around them.
What the ECB’s second rate hike of 2026 actually signals
On 10 September 2026, the ECB’s Governing Council raised all three key interest rates by 25 basis points. Effective 16 September 2026, the new levels stand as follows.
| ECB rate | Before September | Effective 16 September 2026 |
|---|---|---|
| Deposit facility | 2.25% | 2.50% |
| Main refinancing operations | 2.40% | 2.65% |
| Marginal lending facility | 2.65% | 2.90% |
This is the second hike of 2026, following the June move that lifted the deposit rate from 2.00% to 2.25%. The ECB’s stated reason is blunt: the Middle East conflict keeps pushing prices higher, with euro-area headline inflation sitting at roughly 2.8% in early August 2026. Staff projections point to inflation averaging 3.0% in 2026, easing to 2.3% in 2027 and 2.0% in 2028.
The ECB’s September 2026 monetary policy statement confirms staff projections placing euro-area headline inflation at 3.0% in 2026, easing to 2.5% in 2027 and 2.1% in 2028, with GDP growth forecast at 0.9% for 2026, a trajectory that underpins the calibration framing rather than a structural tightening read.
The ECB has repeatedly stated it is “not pre-committing to a particular rate path,” reinforcing a data-dependent, meeting-by-meeting approach.
That non-committal stance is the detail that narrows the field. It signals calibration, not a pre-planned tightening spiral. The analyst commentary clusters around the same conclusion.
- François Rimeu, Crédit Mutuel Asset Management: a “prudent adjustment aimed at safeguarding the ECB’s credibility, without anticipating further rate hikes.”
- Konstantin Veit, PIMCO: it is less likely there will be more than two hikes in this cycle.
- Henry Cook, MUFG Bank: roughly 50 basis points of total 2026 tightening, described as a “measured adjustment.”
There is a competing, more hawkish read that stickier inflation could extend the cycle into early 2027. It exists, but it is the minority position.
The more consequential question is whether a December ECB decision follows, with markets pricing a follow-on hike at 40-50% probability and Dutch TTF natural gas trajectory identified as the single most important conditional variable driving that scenario.
The weight of opinion pointing toward a contained, insurance-type hike cycle tells you something practical. Reacting to each ECB decision as though it confirms a broader tightening regime is likely mispricing the actual risk on the table. Where this cycle ends sets the floor for financing cost expectations across European corporate balance sheets, and reading it as a two-move calibration leads to very different portfolio conclusions than reading it as structurally restrictive.
When big ASX news breaks, our subscribers know first
The UK Chancellor’s budget signal and what parliamentary reality actually constrains
On 8 September 2026, Chancellor John Healey delivered his first major public address, and he made fiscal discipline the centrepiece. He committed to balancing day-to-day spending with tax receipts by 2029-30, insisting he and Prime Minister Andy Burnham are in lockstep. The administration has instructed ministers to hold to spending limits ahead of the October 2026 budget.
Chancellor Healey’s fiscal commitments, set out in the official GOV.UK transcript of his September address, centre on balancing day-to-day spending with tax receipts by 2029-30, a target that parliamentary approval requirements and thin OBR headroom will significantly constrain in practice.
The gilt market context makes the anxiety understandable. On 10 September 2026, the UK 10-year gilt yield rose 10 basis points to 5.378%, its highest level since July 2007. Set against that, the raw fiscal figures look demanding.
- UK 10-year gilt yield: 5.378% on 10 September 2026, the highest since July 2007.
- Debt Management Office 2026-27 remit: £252.1 billion in gilt issuance.
- Long-dated gilt issuance: under 10% of the total, a 21-year low.
- OBR fiscal headroom: just 0.7% of GDP against the balanced-budget objective.
The Office for Budget Responsibility (OBR) has projected the primary balance improving from a deficit of 1.4% of GDP in 2025-26 to a surplus of 1.5% by 2030-31, though this specific figure is not independently confirmed and should be treated as an OBR projection rather than a settled outcome.
The gap between fiscal ambition and fiscal capacity
Here is where the circle of possibility shrinks. A 0.7% of GDP headroom is razor-thin, and budget proposals require parliamentary approval before they take legal effect. Labour’s internal divisions, carried over from the leadership change earlier in 2026, are likely to moderate anything radical.
That combination limits surprises in both directions. There is little room for a large borrowing-funded stimulus, and equally little room for aggressive contraction without political cost.
The borrowing environment reinforces the point. The OBR expects market gilt rates to rise across the forecast horizon, from around 4.3-4.4% toward 5.2-5.4%, which makes debt-funded expansion progressively more expensive to justify.
Whatever the Burnham administration signals, the realistic range of fiscal outcomes is far narrower than political uncertainty headlines suggest. For investors holding UK assets, parsing what the Chancellor can actually deliver, rather than what he might want to, is the more useful exercise. The fiscal risk is real. It is also considerably more bounded than the commentary implies.
Why rate-hike anxiety tends to be a poor guide to equity outcomes
Financial commentary tends to overstate how much central banks steer long-term market outcomes. The historical record complicates the reflex to sell on a hike.
The pattern between rate hikes and equity returns is more nuanced than reflex selling implies: Goldman Sachs data shows the S&P 500 averaging roughly 9% in the 12 months after a first hike, with the early 2% dip consistent but small relative to the recovery that follows once actual earnings data arrives.
| Study source | Cycles covered | 12-month return outcome |
|---|---|---|
| Six Fed tightening cycles since 1994 | 6 | Average gain of 6.7%, median 10.7% |
| Five-decade cycle analysis | 21 | Positive total returns in 17 of 21 cycles |
| Cycles since 1984 | 11 | Positive across all 11 over 6- and 12-month windows |
The extended cycle data here is not independently verified, so treat it as historical analysis rather than certainty. Even hedged, the direction of travel is consistent: research suggests equities have tended to deliver positive returns over 12-month post-hike windows, even while tightening was under way.
The mechanism is straightforward. At the index level, earnings resilience tends to dominate financing cost headwinds when the starting rate is not extreme. A deposit rate of 2.50% is historically moderate. It is not the kind of level that structurally reprices corporate earnings.
The current European data supports that reading. Final Eurostat figures released on 7 September 2026 showed euro-area GDP growth revised upward.
Euro-area GDP rose 0.6% quarter-on-quarter and 1.2% year-on-year in Q2 2026, revised up from flash estimates of 0.4% and 1.0%. The ECB continues to assess financial conditions as supportive of economic growth.
Put the pieces together. Historical patterns point one way, and Q2 GDP was revised upward, not downward. An investor rotating out of European equities primarily because of the ECB hike is likely reacting to the wrong signal. With rates at a moderate level, geopolitical energy-price scenarios and sector-level margin dynamics are the more consequential variables for the STOXX 600’s earnings trajectory. This is the pivot: the hike is context, not threat.
The European earnings case that sentiment is missing
Start with the valuation discount, because it is a fact before it is an argument. European equities trade at a roughly 40-50% forward price-to-earnings (P/E) discount to the United States, the widest forward P/E gap in 15 years.
The European valuation discount is not a new phenomenon: the MSCI Europe forward earnings multiple has persistently trailed the S&P 500 by roughly 31%, a gap that has endured even after the early 2026 European rally, giving the valuation argument a structural rather than merely cyclical foundation.
| Metric | Europe | United States |
|---|---|---|
| Forward P/E | Low-to-mid teens | Approx. 29x |
| CAPE (cyclically adjusted P/E) | 22 (approx. 40% discount) | Materially higher |
| 2026 EPS growth forecast (Goldman) | 15% | Not specified |
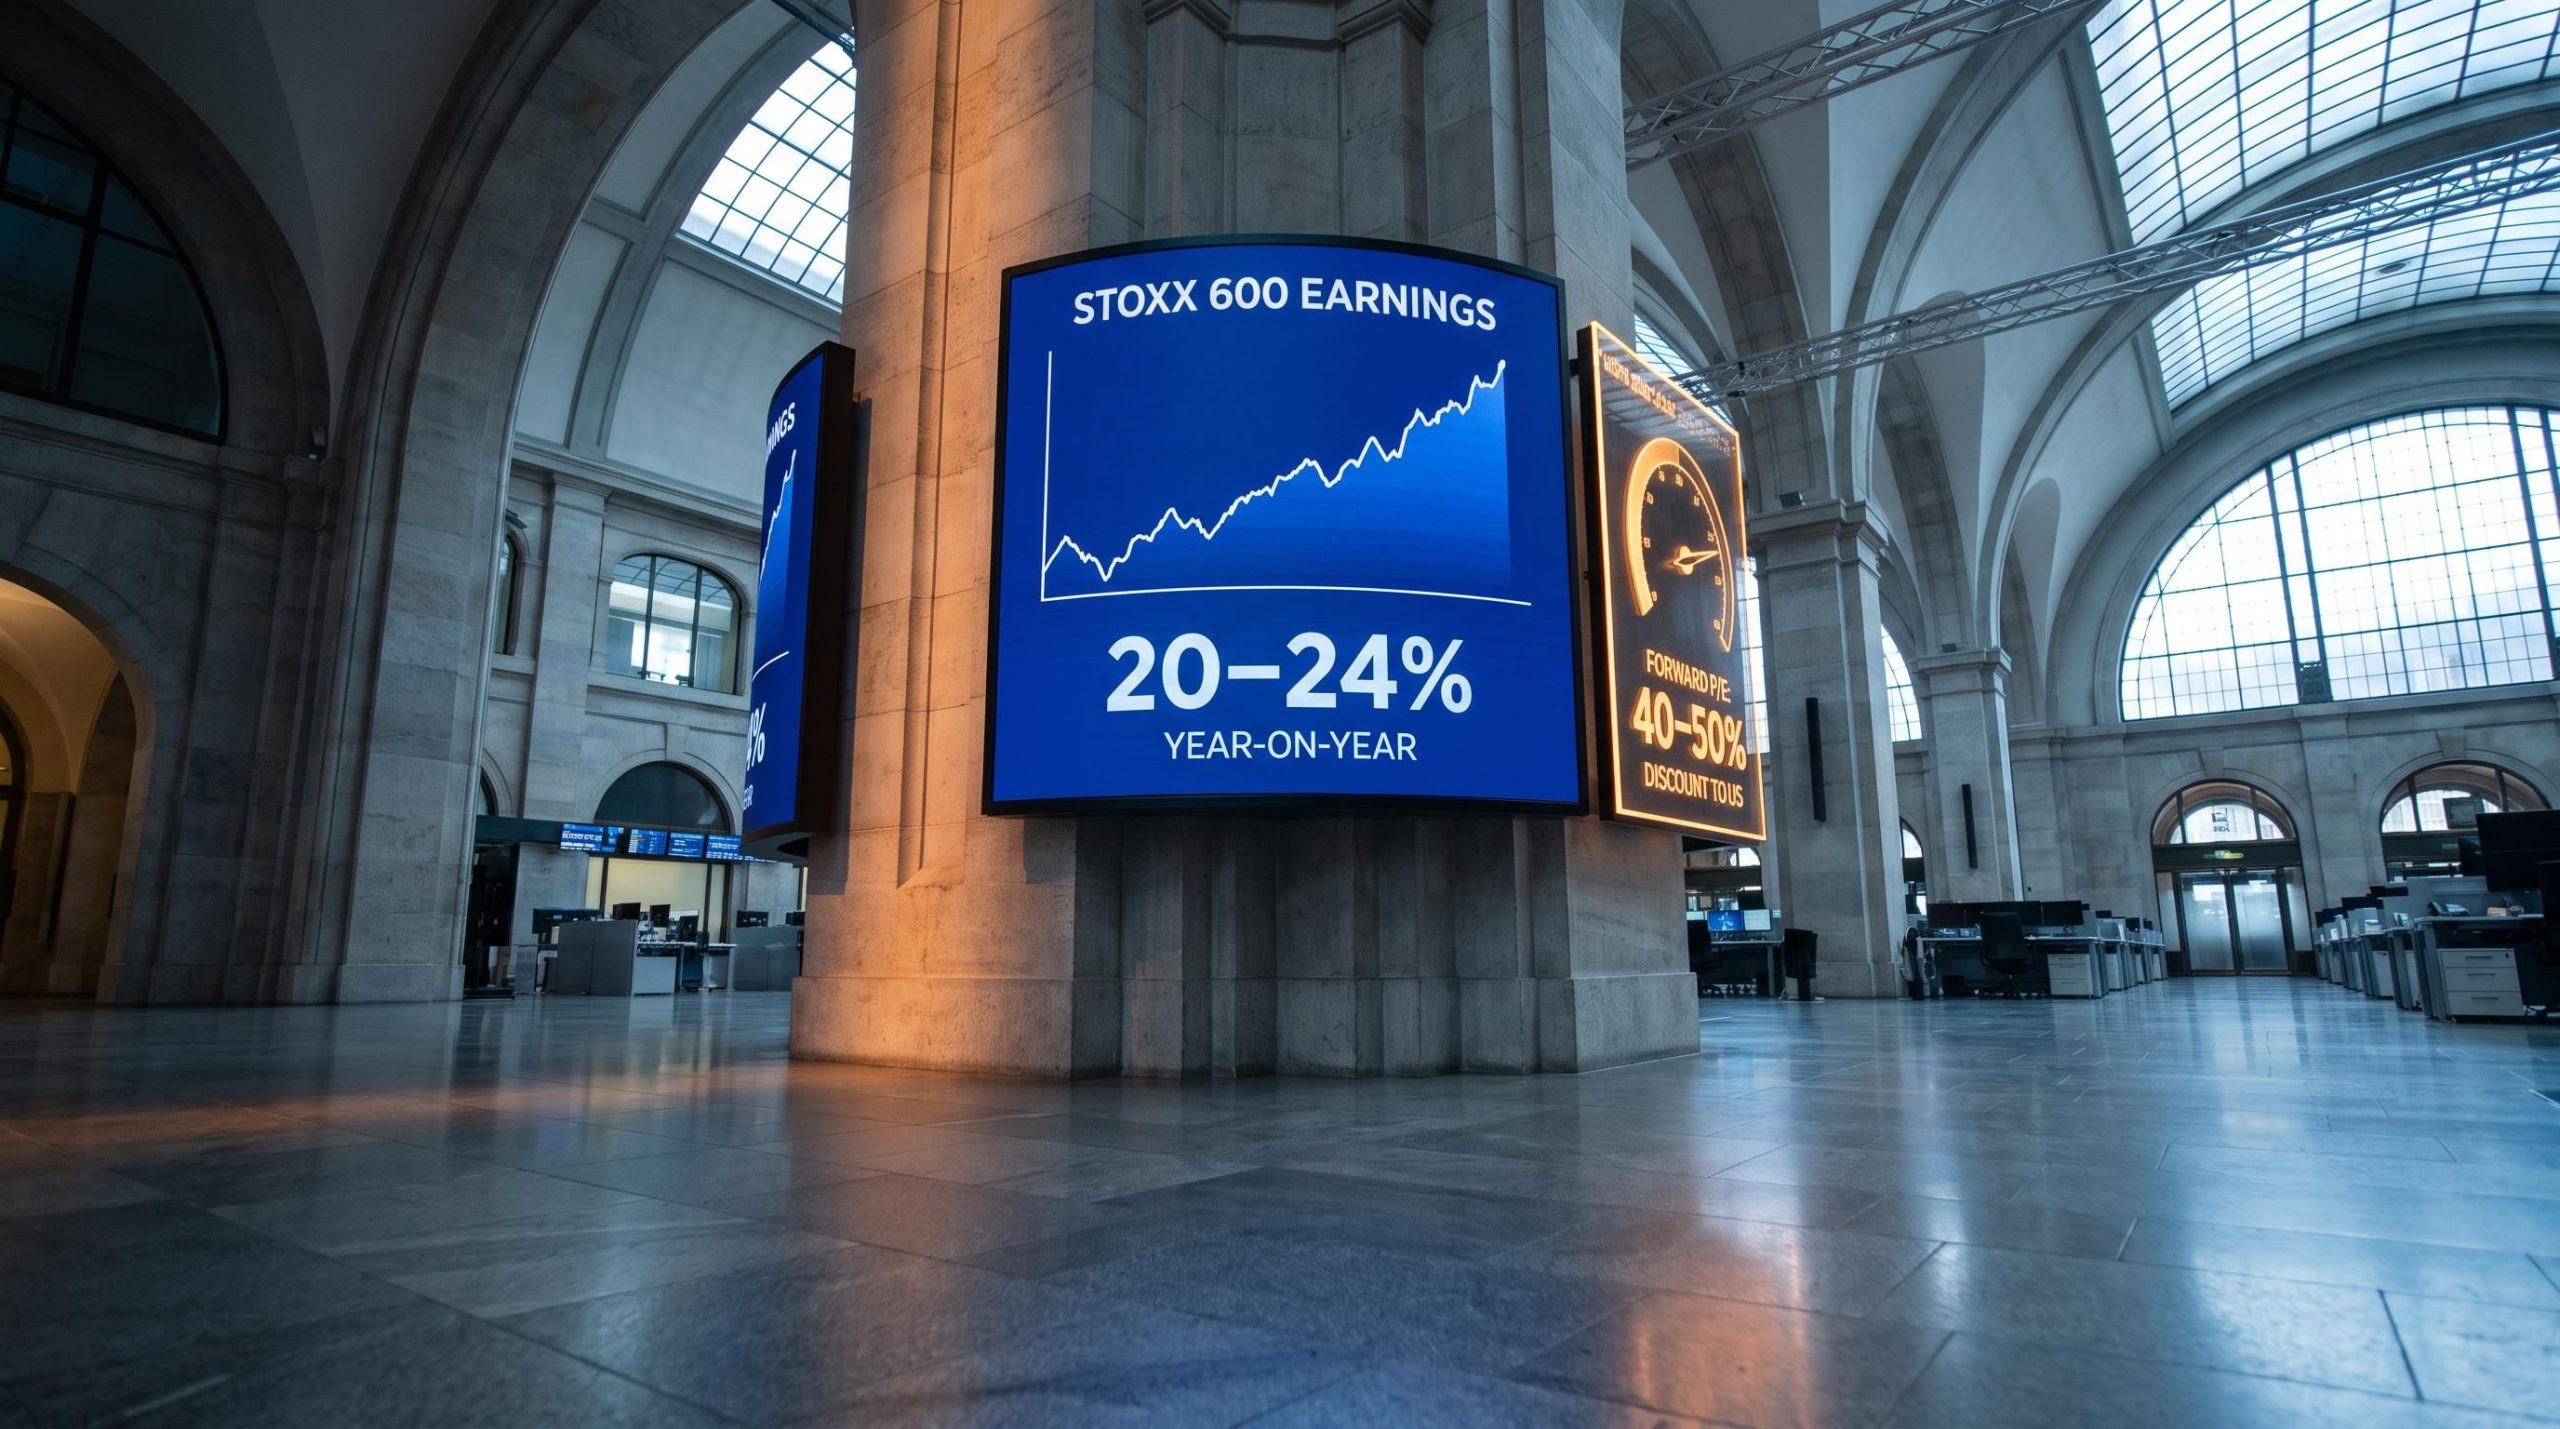
A discount alone proves nothing. What makes it potentially mispriced is the earnings revision story sitting behind it. STOXX 600 companies were tracking earnings growth of roughly 20-24% year-on-year in Q2 2026, the strongest since 2022, and the forecasters have moved to catch up.
Goldman Sachs raised its 2026 STOXX 600 earnings growth forecast to 15%, up from a prior estimate of 10% and a significant increase from an early-year forecast of just 5%.
UBS has moved in the same direction, lifting its 2026 eurozone earnings growth forecast to around 15%. Allianz Global Investors noted European indices gained 6-8% year-to-date through late February 2026, outperforming US markets in euro terms.
The sentiment overhang is genuine. War and energy risk, an index heavy in financials and industrials, and limited technology weight all keep confidence muted. The positioning data captures exactly how muted.
- 7 of 22 European wealth managers overweight European stocks.
- 11 neutral.
- 4 underweight.
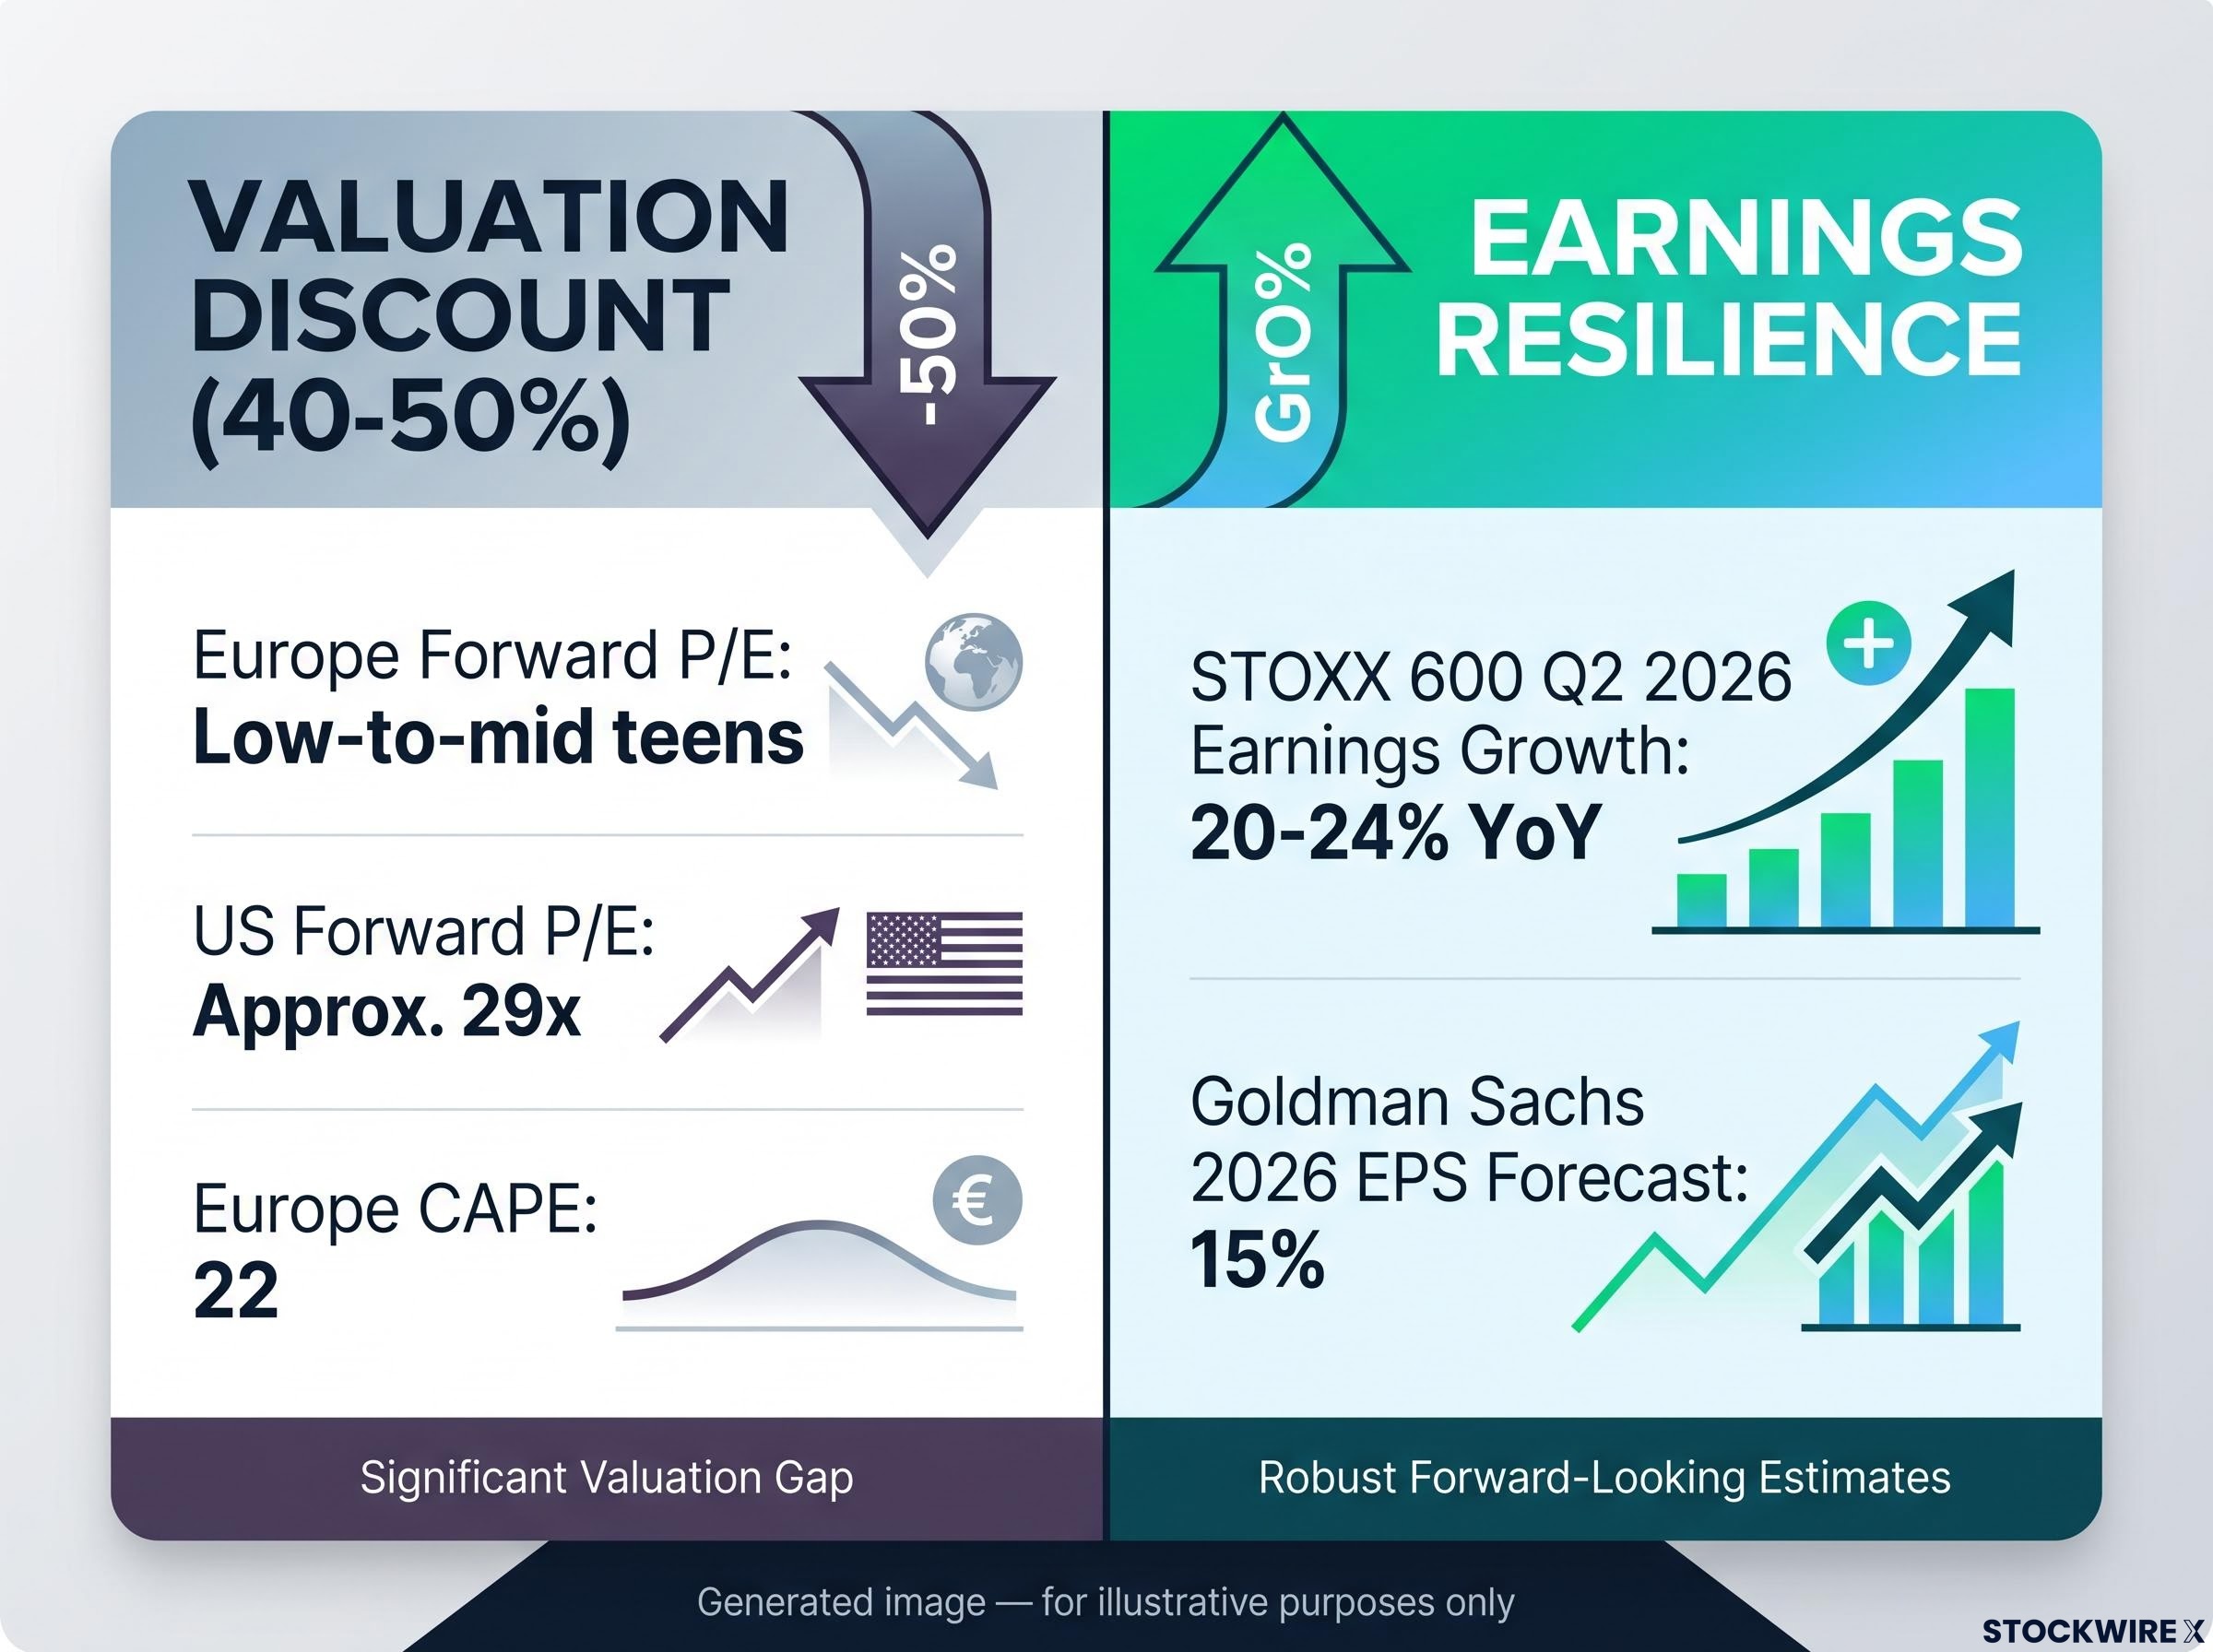
That is the setup that matters. A 40-50% valuation discount sitting alongside earnings growth of 20-24% year-on-year is the kind of divergence that has historically preceded a sentiment rerating. If you are sitting neutral or underweight European equities, the risk of being wrong is now asymmetric in the other direction. Low expectations meeting strong delivery is precisely the combination that tends to drive European outperformance against a cautious consensus.
What investors with European exposure should actually be tracking now
The practical takeaway is a shift in attention. Central bank meeting dates and pre-budget political signals absorb most of the commentary, but the analysis above points to three variables that genuinely move the medium-term thesis.
- Eurozone corporate earnings trajectory. Q3 2026 reporting season is the next concrete test of whether the 20-24% Q2 growth rate is sustainable. This is the single most important input.
- UK parliamentary budget arithmetic. The October 2026 budget will show what a government with 0.7% of GDP headroom can actually deliver.
- Geopolitical energy price scenarios. Energy is the primary driver of the ECB’s rate path and the main margin pressure across energy-intensive European sectors.
Energy price escalation transmits through a three-stage chain of energy costs, logistics costs, and consumer prices, with oil-importing economies facing faster pass-through than advanced economies and central banks caught between fighting cost-push inflation and the risk of tipping fragile growth into contraction.
The base case is more constructive than current positioning implies. Financial conditions remain supportive on the ECB’s own assessment, Q2 GDP was revised up to 0.6% quarter-on-quarter, and analyst consensus points to no more than 50 basis points of total 2026 tightening. Energy price escalation is the one downside risk that would genuinely change the calculus.
There is a quieter point worth holding onto. A Burnham administration boxed in by 0.7% of GDP headroom and parliamentary approval requirements is structurally unlikely to produce a radical fiscal surprise in October. That constraint is itself a form of predictability, and it may be a risk reduction that investors are currently underweighting.
For anyone holding European equities or gilts, the October 2026 budget and the Q3 earnings season are the two events worth watching closely. Individual ECB rate decisions within the consensus range are unlikely to shift the medium-term investment thesis on their own.
This article is for informational purposes only and should not be considered financial advice. Investors should conduct their own research and consult with financial professionals before making investment decisions.
Past performance does not guarantee future results. Financial projections are subject to market conditions and various risk factors, and forward-looking analyst forecasts are speculative and subject to change based on market developments and company performance.